generates a density plot based on the relationships in relations.
Details and Options
relations is a list or association of index pairs and agreement factors. This is an array of two indices for each key and a relationship factor (a real number where negative is disagreement and positive is agreement) for each value or a list of such associations.
The option Steps→steps (default 100) generates a density plot after running the alignment simulation steps times. It must be set to a positive integer, and best results are obtained when steps >= 100.
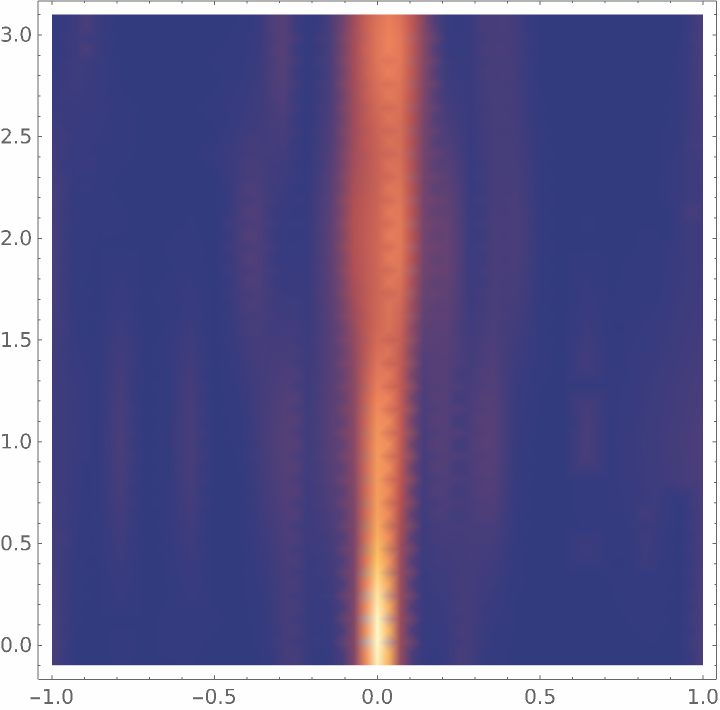
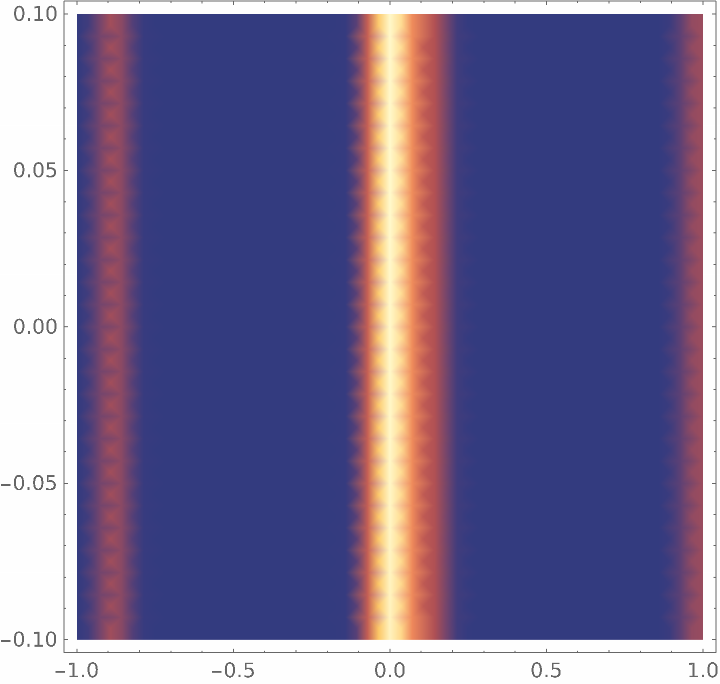
The resulting plot is a heatmap of agreement and disagreement in a community, where individuals that agree clump together in high-density areas. If a list of associations was provided the heatmap is two dimensional and visualizes each association starting from the bottom and going upward.
Plot the alignment of 30 individuals over ten time points:
In[3]:=
In[4]:=
Out[4]=
Scope (1)
Steps (1)
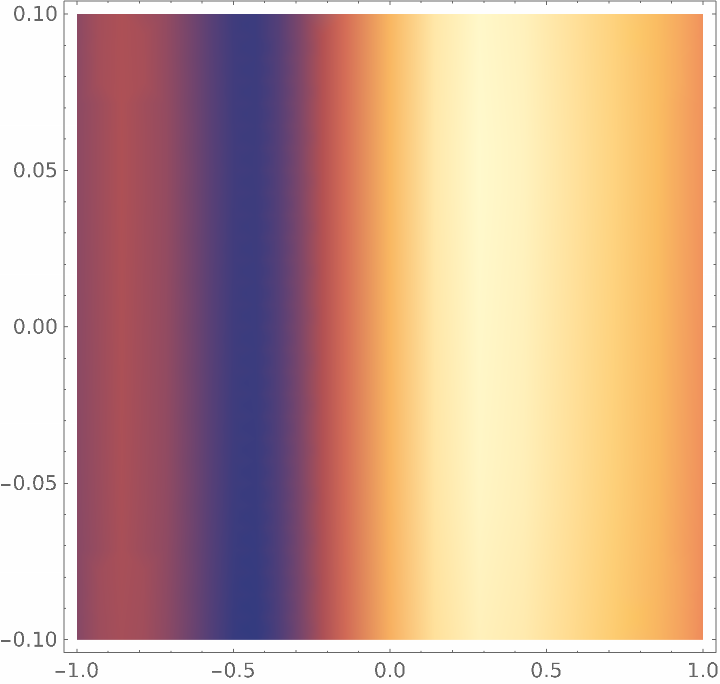
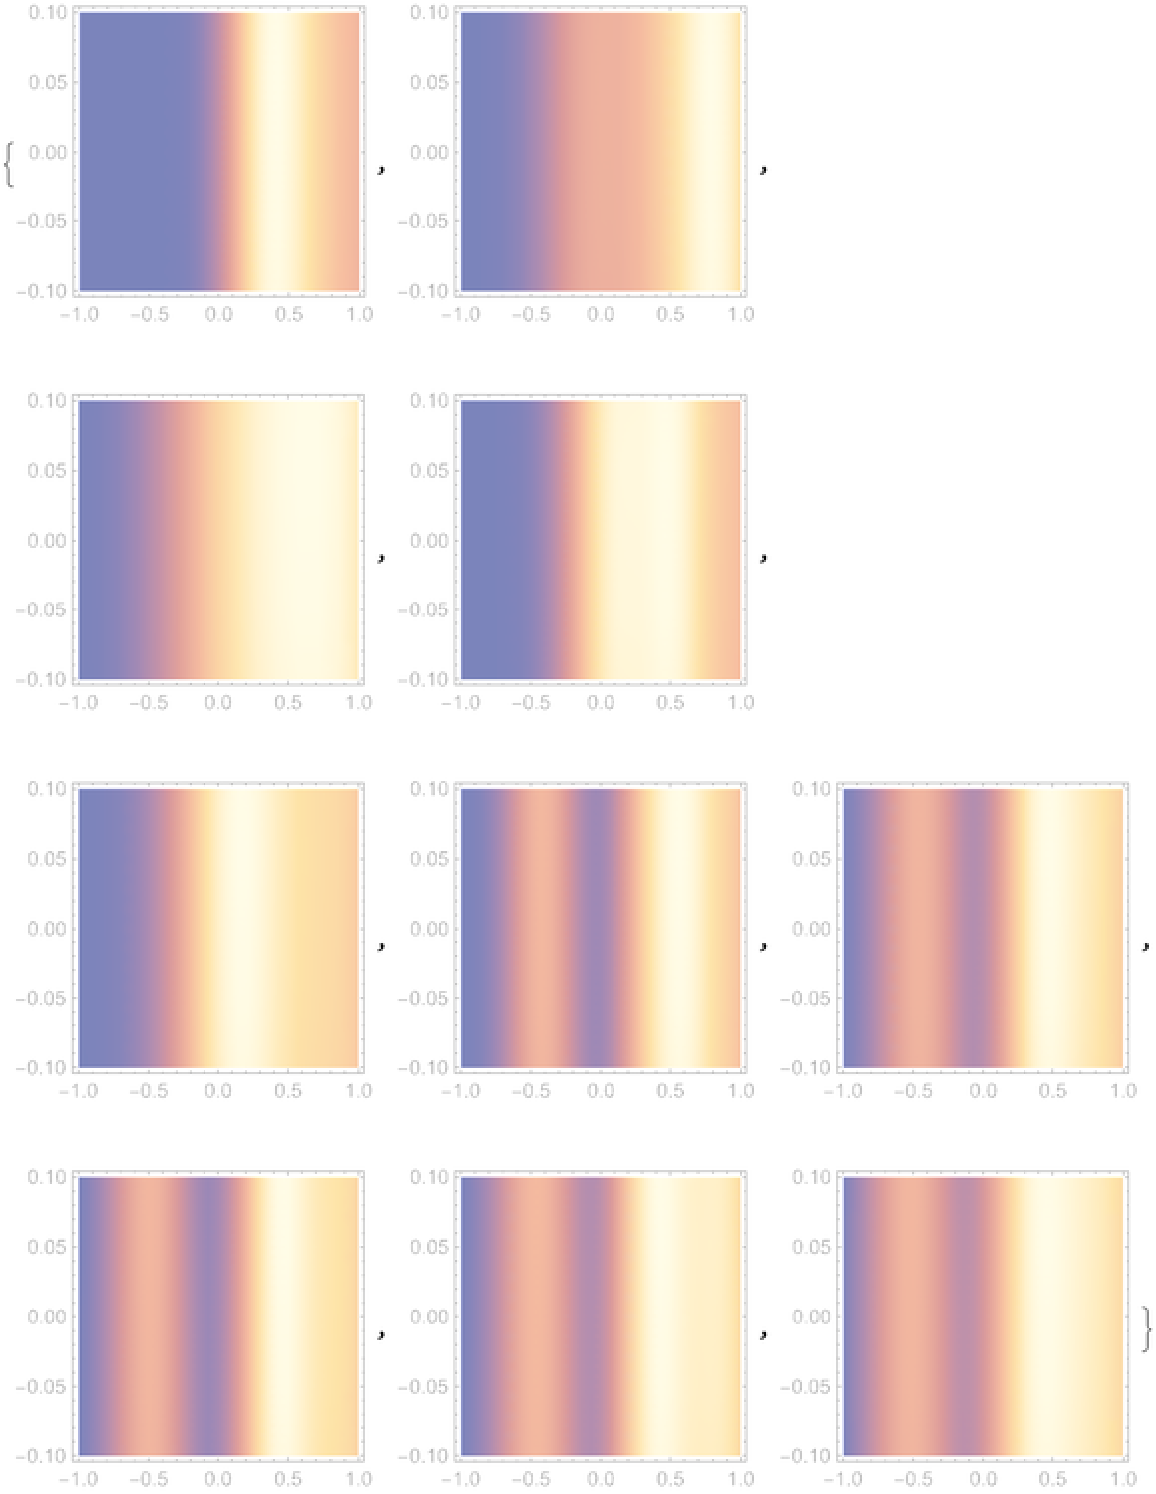
Each alignment plot is generated by stepping each individual in either direction until the forces (attraction for agreement and repulsion for disagreement) are balanced. Increasing the number of steps improves the accuracy of the plot, but returns diminish as steps increases:
In[5]:=
Out[6]=
Possible Issues (1)
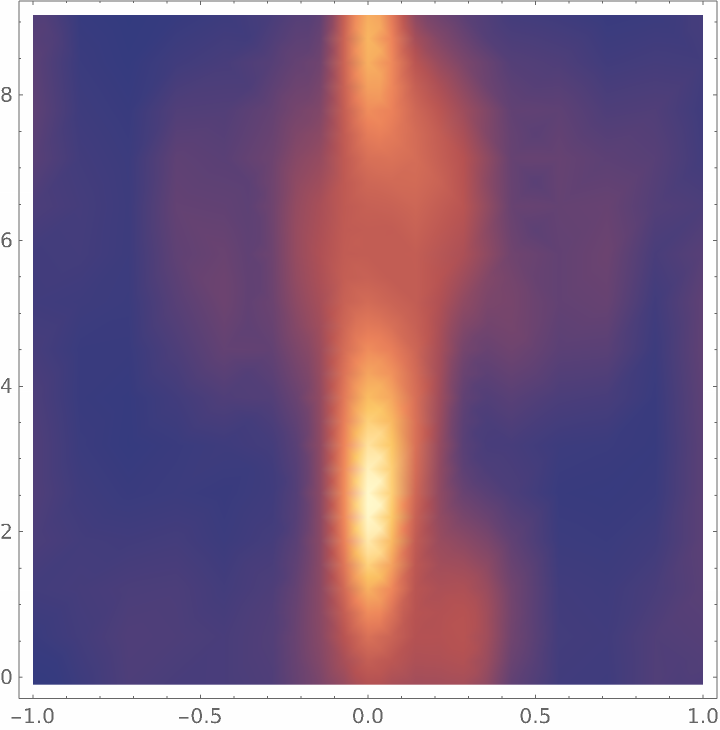
Particularly volatile data can lead to artifacts in the plot:
In[7]:=
Out[12]=
Neat Examples (1)
Visualize the level of agreement in the voting record of 50 members of Congress on four particular votes:
![data = <|{1, 2} -> 0.6, {1, 3} -> 0.6, {1, 4} -> -1., {1, 5} -> -0.6, {2, 3} -> -0.2, {2, 4} -> 0.6, {2, 5} -> 1., {3, 4} -> 0.6, {3, 5} -> 0.2, {4, 5} -> -0.6|>;
ResourceFunction["AlignmentClusterPlot"][data, Steps -> #] & /@ Range[10]](https://www.wolframcloud.com/obj/resourcesystem/images/15d/15d5b5a6-4a1a-432e-8b17-8cc3fd39d90d/3dc42440efd23e2c.png)
![data = <|{1, 2} -> -0.2, {1, 3} -> 0.2, {1, 4} -> 0.2, {1, 5} -> 0.2, {1, 6} -> 0.2, {1, 7} -> 0.2, {1, 8} -> -0.2, {1, 9} -> 0.2, {1, 10} -> 0.2, {2, 3} -> -0.6, {2, 4} -> 0.2, {2, 5} -> -0.6, {2, 6} -> 0.2, {2, 7} -> 0.2, {2, 8} -> 0.6, {2, 9} -> 1., {2, 10} -> 0.2, {3, 4} -> 0.6, {3, 5} -> -0.2, {3, 6} -> 0.6, {3, 7} -> -0.2, {3, 8} -> 0.2, {3, 9} -> 0.6, {3, 10} -> -0.2, {4, 5} -> -0.2, {4, 6} -> -1., {4, 7} -> 0.6, {4, 8} -> 0.2, {4, 9} -> -0.2, {4, 10} -> 0.6, {5, 6} -> -0.2, {5, 7} -> -0.2, {5, 8} -> 1., {5, 9} -> 0.6, {5, 10} -> 0.6, {6, 7} -> 0.6, {6, 8} -> 0.2, {6, 9} -> -0.2, {6, 10} -> 0.6, {7, 8} -> 0.2, {7, 9} -> -0.2, {7, 10} -> -0.2, {8, 9} -> -0.6, {8, 10} -> -0.6, {9, 10} -> -0.2|>;
ResourceFunction["AlignmentClusterPlot"][data, Steps -> 10]](https://www.wolframcloud.com/obj/resourcesystem/images/15d/15d5b5a6-4a1a-432e-8b17-8cc3fd39d90d/7557a765d7daf461.png)
![(* Evaluate this cell to get the example input *) CloudGet["https://www.wolframcloud.com/obj/5ebf0827-1113-43bb-aaa5-7b3459640a52"]](https://www.wolframcloud.com/obj/resourcesystem/images/15d/15d5b5a6-4a1a-432e-8b17-8cc3fd39d90d/1d84c318f91f16cd.png)