| CARVIEW |
Select Language
HTTP/2 308
cache-control: public, max-age=0, must-revalidate
content-type: text/plain
date: Wed, 31 Dec 2025 01:21:05 GMT
location: /python/
refresh: 0;url=/python/
server: Vercel
strict-transport-security: max-age=63072000
x-vercel-id: bom1::wsm5w-1767144065449-74452e2c1165
HTTP/2 200
accept-ranges: bytes
access-control-allow-origin: *
age: 6
cache-control: max-age=600
content-encoding: gzip
content-type: text/html; charset=utf-8
date: Wed, 31 Dec 2025 01:21:05 GMT
etag: W/"694416ef-11c0d"
expires: Wed, 31 Dec 2025 01:30:59 GMT
last-modified: Thu, 18 Dec 2025 14:59:59 GMT
server: Vercel
strict-transport-security: max-age=63072000
vary: Accept-Encoding
via: 1.1 varnish
x-cache: HIT
x-cache-hits: 1
x-fastly-request-id: c361ba0db01d63bb5304da8d4b6a8398f016071f
x-github-request-id: D480:328FD3:A9D8AD:BEFF58:69547A79
x-origin-cache: HIT
x-proxy-cache: MISS
x-robots-tag: index
x-served-by: cache-bom-vanm7210064-BOM
x-timer: S1767144065.484074,VS0,VE1
x-vercel-cache: MISS
x-vercel-id: bom1::wsm5w-1767144065473-880d0ca2e672
content-length: 8886
Plotly Python Graphing Library


Fundamentals
More Fundamentals »
Basic Charts
More Basic Charts »
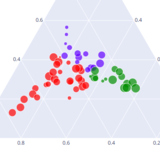
Statistical Charts
More Statistical Charts »
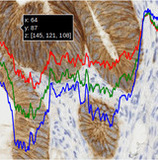
Scientific Charts
More Scientific Charts »
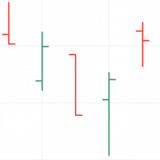
Financial Charts
More Financial Charts »
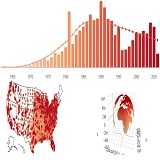
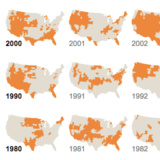
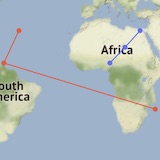
Maps
More Maps »
Artificial Intelligence and Machine Learning
More AI and ML »
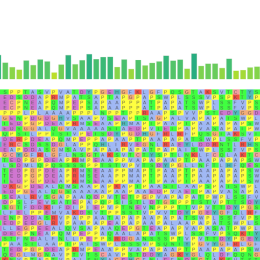
Bioinformatics
More Bioinformatics »
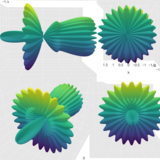
3D Charts
More 3D Charts »
Subplots
Jupyter Widgets Interaction
Add Custom Controls
Animations
Advanced

Plotly Open Source Graphing Library for Python
Plotly's Python graphing library makes interactive, publication-quality graphs. Examples of how to make line plots, scatter plots, area charts, bar charts, error bars, box plots, histograms, heatmaps, subplots, multiple-axes, polar charts, and bubble charts.
Plotly.py is
free and open source and you can
view the source, report issues or contribute on GitHub.
Plotly Studio: Transform any dataset into an interactive data application in minutes with AI. Try Plotly Studio now.


-
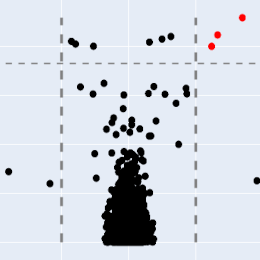
Volcano PlotView Tutorial
-
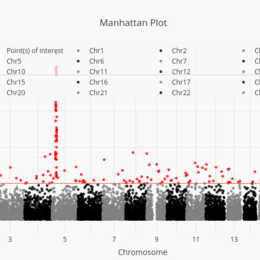
Manhattan PlotView Tutorial
-
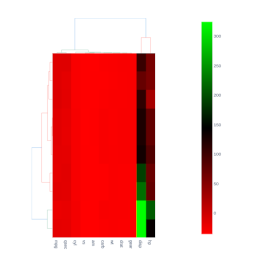
ClustergramView Tutorial
-
Alignment ChartView Tutorial