|
|
|
| CARVIEW |

![]() I can’t simplify the title beyond that, but don’t run away yet, the idea itself is straight forward once the terminology is explained. Skip ahead two paragraphs if you know what domain specificity means.
I can’t simplify the title beyond that, but don’t run away yet, the idea itself is straight forward once the terminology is explained. Skip ahead two paragraphs if you know what domain specificity means.
Recognition of objects in the visual scene is thought to arise in inferior temporal and occipital cortex, along the ventral stream (see also this planned Scholarpedia article on the topic by Ungerleider and Pessoa – might be worth waiting for). That general notion is pretty much where consensus ends, with the issue of how different object categories are represented remaining controversial. Currently, the dominant paradigm is that of Nancy Kanwisher and colleagues, who hold that a number of domain-specific (that is, modular) areas exist, which each deal with the recognition of one particular object category. The most widely accepted among these are the fusiform face area (FFA), the parahippocampal place area (PPA), the occipital face area (OFA), the extrastriate body area (EBA), and the lateral occipital complex (LO), which is a bit of a catch-all region for the recognition of any object category that doesn’t fall into one of the domains with their own area. Usually, the face-selective part of the superior temporal sulcus (STS) is also included.

Typical locations of object areas by category. B is an upside down down, C is flattened
This modular view of the visual recognition has received a lot of criticism. However, the undeniable success of the functional localiser approach to fMRI analysis, in which responses are averaged across all voxels in each of the previously-mentioned areas, has led to widespread acceptance of the approach. Essentially, then, the domain specific account seems to be accepted because recording from a functionally-defined FFA, for instance, seems to yield results that make a lot of sense for face perception.
When you think about it, the domain specific account in itself is a pretty lousy theory of object recognition. It does map object categories onto cortex, but it is considerably more difficult to explain how such a specific representation might be built on input from earlier, non-object specific visual areas. This brings us to today’s paper, which proposes a possible solution (op de Beeck et al, 2008). The bulk of the paper is a review of previous research in this area, so give it a read for that reason if you want to get up to speed. The focus of this post is on the theoretical proposal that op de Beeck et al (2008) make towards the end of the paper, which goes something like this:
Ventral stream areas contain a number of overlapped and aligned topographical maps, where each maps encodes one functional property of the stimulus. Op de Beeck et al (2008) suggest that properties might include shape, functional connectivity, process, and eccentricity. Let’s go through each of those suggestions in turn (the following is based on my own ideas – op de Beeck et al don’t really specify how the topography of these featural maps might work):
A shape map might encode continuous variations of for instance angularity and orientation of parts of the stimulus. So one imaginary neuron in this map might be tuned to a sharp corner presented at an upright orientation (see Pasupathy & Connor, 2002 for an example of such tuning in V4), and topographically, the map might be laid out with angularity and curvature as the x and y dimensions in the simplest case.
Functional connectivity is hard to explain – read the article I just linked if you’re curious, but let’s just call it brain connectivity here. A map of brain connectivity is a topographical layout of connections to other areas – for instance, one part of the map might be more connected to earlier visual areas (such as V4), while another part of the map might connect more with higher-order areas that deal with memory or emotion (e.g., hippocampus, amygdala).
The process map is a tip of the hat to some of Kanwisher’s strongest critics, such as Tarr & Gauthier (2000), who argued that the ventral stream isn’t divided by object category, but by the visual processing that is used. So for example, the FFA is actually an area specialised for expert within-category discrimination of objects (faces or otherwise), which happens to appear face-specific because we have more experience with faces than with other categories. Some parts of the map might deal with such expertise discriminations, while others might deal with more general between-category classification.
Eccentricity is a fancy term for distance from the fixation point (ie, the fovea) in retinal coordinates. If you hold your finger slightly left of your fixation point and continue to move it left, you are increasing the eccentricity of the stimulus. Eccentricity and its complicated partner polarity (visual angle) reflect the two basic large-scale topographical principles in early visual areas, but such maps can be found throughout the visual system.
Incidentally, the eccentricity map is the only of these proposed maps for which there is currently good evidence in this part of the brain (Levy et al, 2001). The part that corresponds to the FFA has a foveal (or central) representation of the visual field, which makes sense considering that we tend to look directly at faces. Conversely, the PPA has a peripheral representation, as might be expected since most of us don’t spend much time fixating on the scenery.
The central proposal is that in an area such as the FFA, the face-specific response is actually the combination of the concurrent, aligned activation of a number of different maps. For example, the FFA might correspond to responses tuned to rounded shapes in the shape map, to input from earlier visual areas in the functional connectivity map, to expert within-category discrimination in the process map, and to a foveal (central) representation in the eccentricity map.
To really get the kind of strong domain-specificity that is observed, these maps must display multiplicative interactions – op de Beeck et al (2008) suggest that if their simultaneous activations were just added to make up the fMRI response, you wouldn’t get the strong selectivity that is observed (so by implication, less strict modularists could do away with the multiplicative bit and get a map that corresponds better to their view of ventral areas).

This is a pretty interesting idea, although wildly speculative. Note that with the exception of eccentricity, there really is very little evidence for this form of organisation. In other words, this theory is a theory not just in the scientific sense, but also in the creationist sense of the word. It definitely is an inspiring source of possible future experiments, however.
References
Levy, I., Hasson, U., Avidan, G., Hendler, T., & Malach, R. (2001). Center-periphery organization of human object areas. Nature Neuroscience, 4, 533-539. DOI: 10.1038/87490
Op de Beeck, H.P., Haushofer, J., Kanwisher, N.G. (2008). Interpreting fMRI data: maps, modules and dimensions. Nature Reviews Neuroscience, 9, 123-135. DOI: 10.1038/nrn2314
Pasupathy, A., & Connor, C.E. (2002) Population coding of shape in area V4. Nature Neuroscience, 5, 1332-1338. Link
Tarr, M.J., & Gauthier, I. (2000). FFA: a flexible fusiform area for subordinate-level visual processing automated by expertise. Nature Neuroscience, 3, 764-769. DOI: 10.1038/77666
]]> ![]() Given how straight-forward their response properties are, it is curious that grid cells were only discovered relatively recently (Hafting et al, 2005). According to one of my professors, this is simply because researchers didn’t put their rats in sufficiently large boxes to see the pattern previously, but who knows… The response properties of grid cells are perhaps best illustrated in a figure (this is from the excellent Scholarpedia article on Grid cells, written by two of their discoverers).
Given how straight-forward their response properties are, it is curious that grid cells were only discovered relatively recently (Hafting et al, 2005). According to one of my professors, this is simply because researchers didn’t put their rats in sufficiently large boxes to see the pattern previously, but who knows… The response properties of grid cells are perhaps best illustrated in a figure (this is from the excellent Scholarpedia article on Grid cells, written by two of their discoverers).

In this figure, the x and y coordinates correspond to the spatial location of a rat, which is running around freely inside a large box. The black lines in the left figure shows how this particular rat explored the box in a fairly haphazard manner. However, an electrode inserted in the rat’s subcortex picks up a signal that is anything but chaotic: the responses of said neuron are given as red dots in the left figure, while the right figure gives the firing rate distribution (ranging from blue for silent and red for the peak rate of responding). Although the rat is running about randomly, this neuron is responding in a grid, seemingly coming on an off in response to the animal’s spatial location.
This response pattern is similar regardless of the exact box, so the pattern does not reflect learning of the spatial layout of this box as such. Indeed, when the light is turned out, the grid cell continues to respond as before while the rat runs around in the dark (Hafting et al, 2005 – this is not terribly impressive when you consider how little rats use vision, however). Yet, at least some grid cells showed a response pattern that rotated 90 degrees with a corresponding shift in an external visual cue, so although the grid cells do not depend on the external environment, they do seem to take cues from it when available.
Grid cells are found in Entorhinal cortex of the rat, a region which provides the main input to the Hippocampus, long known as a centre for memory consolidation and spatial navigation. Thus, these cells are a prime candidate as building blocks for more complex spatial cells that are observed in the Hippocampus proper. Different grid cells in Entorhinal cortex appear to have partially overlapping response fields, so that a given location might produce a response in some grid cells but not others. There is also a topographical structure, where the size of the grid increases as one moves from the dorsomedial to the ventrolateral side of the area. Incidentally, this pattern matches a spatial scale increase of more complex cells in the Hippocampus proper.
The obvious implication is that by combining the output of a number of partially-overlapping grid cells, perhaps a cell with more complex spatial properties could be built. The next issue of Know your neuron is about one category of such neurons, which appear to respond only to a specific spatial location.
References
Hafting, T., Fyhn, M., Molden, S., Moser, M., & Moser, E.I. (2005). Microstructure of a spatial map in the entorhinal cortex. Nature, 436, 801-806. DOI: 10.1038/nature03721
Moser, E., & Moser, M.-B. (2007). Grid Cells. Scholarpedia, 2, 3394.
]]>
![]() Although computer software is now adept at face detection – Google’s image search does it, and so does you camera if you bought it within the past year – the problem of recognising a face as belonging to a specific individual has proved a hard nut to crack.
Although computer software is now adept at face detection – Google’s image search does it, and so does you camera if you bought it within the past year – the problem of recognising a face as belonging to a specific individual has proved a hard nut to crack.
Essentially, this is a problem of classification. A model for this process should be able to sort images of three persons into three separate categories. This is remarkably difficult to do. If you look at the sheer physical differences between images of the same person, they easily outnumber the differences between images of different persons, taken from the same angle under the same lighting conditions. In other words, the bulk of the physical variability between different face images is uninformative, as far as face recognition is concerned. Thus, this remains an area where humans effortlessly outperform any of the currently-available face recognition models.
Recent work by Mark Burton at the Glasgow Face Recognition Group suggests a solution by which computer models can achieve human-like performance at face recognition. By implication, such a model may also offer a plausible mechanism for how humans perform this task. The model that Burton et al (2005) proposed is best explained by this figure, which outlines the necessary processing steps:

For each face that the model is to learn, a number of example images are collected (as shown in A). These images are morphed to a standard shape (B), which makes it possible to carry out pixel-by-pixel averaging to create a composite (C). This composite is then used by the model to attempt to recognise a new set of images of the person.
This may sound relatively straight-forward, but the idea is novel. Most face recognition models that work with photographs use an exemplar-based algorithm, where the model stores each of the images it is shown. Such models do improve as more faces are added (since there are more exemplars that might possibly match), but not as much as an averaging model does as more pictures are added to the average (Burton et al, 2005). Furthermore, when noise is added in the form of greater variations in lighting, the exemplar model breaks down rapidly while the averaging model is largely unaffected.
Why is this model so effective? The averaging process appears to remove variability that is not relevant to personal identity (such as differences in lighting and shading, changes in hair style), while preserving information that is informative for recognition (eyebrows, eyes, nose, mouth, perhaps skin texture). The figure at the top of this post highlights this (from Burton et al, 2005). The pictures are shape-free averages, created from 20 exemplar pictures of each celebrity. To the extent that hair is present, it is usually blurry. But the pictures are eminently recognisable, even though you have in fact never seen any of these particular images before (since they are composites). Indeed, Burton et al (2005) showed that participants were faster to recognise these averages than they were at recognising the individual exemplar pictures.
In the latest issue of Science, Jenkins and Burton (2008) presented an unusual demonstration of the capabilities of this model. They pitted their model against one of the dominant commercial face-recognition systems (FaceVACS). The commercial model has been implemented at MyHeritage, a website that matches pictures you submit to a database of celebrities.
Jenkins and Burton (2008) took advantage of this by feeding the website a number of images from the Burton lab’s own celebrity face database. Note that the website is all about matching your face to a celebrity, so if an image of Bill Clinton from the Burton database is given as input, you would expect the face recognition algorithm to find a strong resemblance to the Bill Clinton images stored by MyHeritage. Overall, performance was unimpressive – 20 different images of 25 male celebrities were used, and the commercial face algorithm matched only 54% of these images to the correct person. This highlights how computationally difficult face recognition is.
In order to see how averaging might affect the model’s performance, Jenkins and Burton (2008) took the same 20 images and created a shape-free average for each celebrity. Each average was then fed into the model.
This raised the hit rate from 54% to 100%.
The model that Burton is advocating is really one where individual face images are recognised with reference to a stored average. This finding is essentially the converse – the commercial model, which attempts to store information about each exemplar, is used to identify an average. But there is no reason why it wouldn’t work the other way around.
This demonstration suggests that as far as computer science is concerned, the problem of face recognition may be within our grasp. There are a few remaining kinks before we all have to pose for 20 passport pictures instead of one, however: the model only works if each exemplar is transformed, as shown in the figure above. As I understand it, this process cannot be automated at present.
While we’re on the computer science side I think it is also worth mentioning that there may be some ethical implications to automatic face recognition, especially in a country with one CCTV camera for every 5 inhabitants (according to Wikipedia). I have always dismissed the typical Big Brother concerns with the practical issue of how anyone would have time to actually watch the footage. If, however, automatic face recognition becomes common-place, you had better hope that your government remains (relatively) benevolent, because there will be no place to hide.
Turning to psychology, the assertion by Burton et al is that this model also represents to some extent what the human face recognition system is doing. This sounds good until you realise that face recognition is not hugely affected by changes in viewing position – you can recognise a face from straight on, in profile, or somewhere in between. This model can’t do that (hence the generation of a shape-free average), so if the human system works this way, it must either transform a profile image to a portrait image in order to compare it to a single, portrait average, or it must store a number of averages for different orientations, which leads to some bizarre predictions (for example, you should have an easier time recognising the guy who sits next to you in lecture from a profile image, because that’s how you have usually viewed him).
That being said, this model offers an extremely elegant account of how face recognition might occur – read the technical description of FaceVACS to get a taste for how intensely complex most conventional face recognition models are (and by implication, how complex the human face recognition system is thought to be). The Burton model has a few things left to explain, but it is eminently parsimonious compared to previous efforts.
References
Burton, A.M., Jenkins, R., Hancock, P.J.B., & White, D. (2005). Robust representations for face recognition: The power of averages. Cognitive Psychology, 51, 256-284.
Jenkins, R., Burton, A.M. (2008). 100% Accuracy in Automatic Face Recognition. Science, 319, 435. DOI: 10.1126/science.1149656
]]>
 Disturbed sleep patterns feature in a range of psychiatric disorders, many of which fall under the DSM’s mood disorder category. A recent paper by Yoo et al (2007) suggests that sleep deprivation itself can produce abnormal affective processing. In other words, sleep disturbances may be a cause as well as a symptom in conditions such as depression.
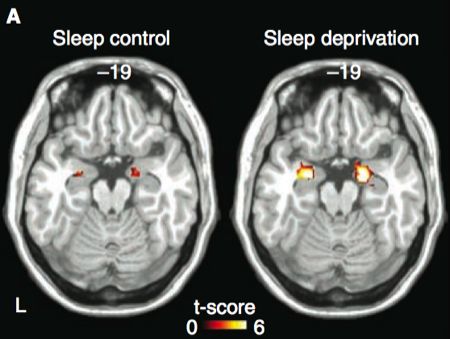
Yoo et al (2007) approached this issue with fMRI. Brain scans were taken of one participant group who had been sleep deprived for 35 hours, and one group who had slept normally. The participants viewed emotional pictures from a standardised set (the international affective picture system), which varied gradually in valence from neutral to aversive.
Yoo et al approached the imaging analysis with a few theoretical notions, which formed the basis of the brain areas that they investigated more closely. First, the amygdala is believed to mediate the emotional response to the aversive pictures, and secondly, it is argued that responding in the amygdala is mediated by an inhibitory projection from medial prefrontal cortex (a frequently invoked projection – see this related post).
To address the first issue, Yoo et al compared the amygdala response to the aversive pictures in the two groups. The amygdala was more activated bilaterally in the sleep-deprived group, and furthermore, a larger volume of amygdala was activated in this group as the figure at the top of this post shows. Note that the neutral pictures elicited no greater amygdala responses in the sleep-deprived group, so this is a case of greater amygdala re-activity, rather than an increase in baseline responding.
The role of medial prefrontal cortex in mediating the amygdala reactivity was investigated by measuring the regions that showed functional connectivity with the amygdala during the task. The method isn’t straightforward, but essentially it’s based on taking the activity in the amygdala voxels, and assessing which other brain regions show responses that covary. The results are given as a contrast between the two groups.
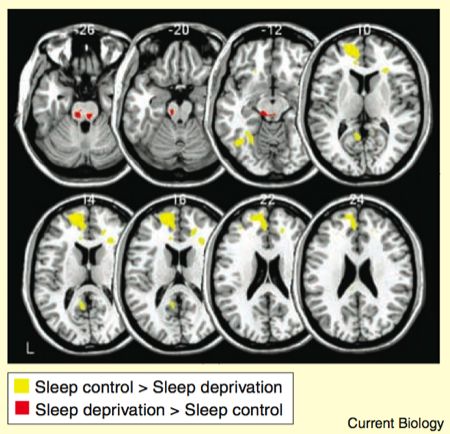
As the yellow bits in the figure show, the sleep control group displayed stronger amygdala-prefrontal connectivity than the sleep-deprived group. Conversely, the amygdala had stronger connectivity with various regions of the brainstem in the sleep deprived group compared to the sleep control group.
So to re-cap: sleep-deprived participants showed larger amygdala responses, and their amygdalas showed weaker functional connectivity with medial prefrontal cortex. This finding does not prove that the greater amygdala response in the sleep-deprived group was caused by the weakened connectivity with medial prefrontal cortex, but it is certainly consistent with that notion. Yoo et al suggest that sleep acts as a kind of reset of brain reactivity, to ensure that emotional challenges can be met appropriately. But why is such a reset necessary in the first place? Why is the regulatory influence of medial prefrontal cortex weakened by sleep deprivation? The role of sleep in affect is only beginning to be understood.
References
Yoo, S-S., Gujar, N., Hu, P., Jolesz, F.A., & Walker, M.P. (2007). The human emotional brain without sleep – a prefrontal amygdala disconnect. Current Biology, 17, 877-878.

![]() That image certainly piques your interest, doesn’t it? Sugita (2008) was interested in addressing one of the ancient debates in face perception: the role of early experience versus innate mechanisms. In a nutshell, some investigators hold that face perception is a hardwired process, others that every apparently special face perception result can be explained by invoking the massive expertise we all possess with faces, compared to other stimuli. Finally, there is some support for a critical period during infancy, where a lack of face exposure produces irreparable face recognition deficits (see for example Le Grand et al, 2004). Unfortunately, save for a few unfortunate children who are born with cataracts, there is no real way to address this question in humans.
That image certainly piques your interest, doesn’t it? Sugita (2008) was interested in addressing one of the ancient debates in face perception: the role of early experience versus innate mechanisms. In a nutshell, some investigators hold that face perception is a hardwired process, others that every apparently special face perception result can be explained by invoking the massive expertise we all possess with faces, compared to other stimuli. Finally, there is some support for a critical period during infancy, where a lack of face exposure produces irreparable face recognition deficits (see for example Le Grand et al, 2004). Unfortunately, save for a few unfortunate children who are born with cataracts, there is no real way to address this question in humans.
Enter the monkeys, and the masked man. Sugita (2008) isolated monkeys soon after birth, and raised them in a face-free environment for 6, 12 or 24 months. After this, the monkeys were exposed to strictly monkey or human faces for an additional month.
At various points during this time, Sugita (2008) tested the monkeys on two tasks that were originally pioneered in developmental psychology as means of studying pre-lingual infants. In the preferential looking paradigm, two items are presented, and the time spent looking at either item in the pair is recorded. The monkeys viewed human faces, monkey faces, and objects, in various combinations. It is assumed that the monkey (or infant) prefers whichever item it looks at more. In the paired-comparison procedure, the monkey is primed with the presentation of a face, after which it views a face pair, where one of the faces is the same as that viewed before. If the monkey views the novel face more, it is inferred that the monkey has recognised the other face as familiar. So the preferential looking paradigm measures preference between categories, while the paired-comparison procedure measures the ability to discriminate items within a category.
Immediately following deprivation, the monkeys showed equal preference for human and monkey faces. By contrast, a group of control monkeys who had not been deprived of face exposure showed a preference for monkey faces. This finding suggests that at the very least, the orthodox hard-wired face perception account is wrong, since the monkeys should then prefer monkey faces even without previous exposure to them.
In the paired-comparison procedure, the control monkeys could discriminate between monkey faces but not human faces. By contrast, the face-deprived monkeys could discriminate between both human and monkey faces. This suggests the possibility of perceptual narrowing (the Wikipedia article on it that I just linked is probably the worst I’ve read – if you know this stuff, please fix it!), that is, a tendency for infants to lose their ability to discriminate between categories which are not distinguished in their environment. The classic example occurs in speech sounds, where infants can initially discriminate phoneme boundaries (e.g., the difference between /bah/ and /pah/ in English) that aren’t used in their own language, although this ability is lost relatively early on in the absence of exposure to those boundaries (Aslin et al, 1981). But if this is what happens, surely the face-deprived monkeys should lose their ability to discriminate non-exposed faces, after exposure to faces of the other species?
Indeed, this is what Sugita (2008) found. When monkeys were tested after one month of exposure to either monkey or human faces, they now preferred the face type that they had been exposed to over the other face type and non-face objects. Likewise, they could now only discriminate between faces from the category they had been exposed to.
Sugita (2008) didn’t stop there. The monkeys were now placed in a general monkey population for a year, where they had plenty of exposure to both monkey and human faces. Even after a year of this, the results were essentially identical as immediately following the month of face experience. This implies that once the monkeys had been tuned to one face type, that developmental door was shut, and no re-tuning occurred. Note that in this case, one month of exposure to one type trumped one year of exposure to both types, which shows that as far as face recognition goes, what comes first seems to matter more than what you get the most of.
Note a little quirk in Sugita’s (2008) results – although the monkeys were face-deprived for durations ranging from 6 to 24 months, these groups did not differ significantly on any measures. In other words, however the perceptual narrowing system works for faces, it seems to be flexible about when it kicks in – it’s not a strictly maturational process that kicks in at a genetically-specified time. This conflicts quite harshly with the cataract studies I discussed above, where human infants seem to lose face processing ability quite permanently when they miss out on face exposure in their first year. One can’t help but wonder if Sugita’s (2008) results could be replicated with cars, houses, or any other object category instead of faces, although this is veering into the old ‘are faces special’ debate… It’s possible that the perceptual narrowing observed here is a general object recognition process, unlike the (supposedly) special mechanism with which human infants learn to recognise faces particularly well.
On the applied side, Sugita (2008) suggests that his study indicates a mechanism for how the other-race effect occurs – that is, the advantage that most people display in recognising people of their own ethnicity. If you’ve only viewed faces of one ethnicity during infancy (e.g., your family), perhaps this effect has less to do with racism or living in a segregated society, and more to do with perceptual narrowing.
References
Sugita, Y. (2008). Face perception in monkeys reared with no exposure to faces. Proceedings of the National Academy of Sciences (USA), 105, 394-398.

![]() How do we recognise faces? The vast majority of research into face perception has attempted to answer this question by restricting their investigations to a small section of the fusiform gyrus, which Kanwisher and colleagues named the Fusiform Face Area (FFA) in 1997. It is commonly proposed that the FFA handles not only the detection but also the recognition of individual faces. A recent paper by Kriegeskorte et al (2007) suggests that instead, a region in the right anterior inferotemporal cortex (aIT – ahead of and above the FFA) encodes information about different faces, while the FFA does not. In order to understand the finer points of this finding, it is necessary to explain the basic assumptions of univariate neuroimaging analysis, and how it is used to identify the FFA. Skip ahead a paragraph if this is familiar territory.
How do we recognise faces? The vast majority of research into face perception has attempted to answer this question by restricting their investigations to a small section of the fusiform gyrus, which Kanwisher and colleagues named the Fusiform Face Area (FFA) in 1997. It is commonly proposed that the FFA handles not only the detection but also the recognition of individual faces. A recent paper by Kriegeskorte et al (2007) suggests that instead, a region in the right anterior inferotemporal cortex (aIT – ahead of and above the FFA) encodes information about different faces, while the FFA does not. In order to understand the finer points of this finding, it is necessary to explain the basic assumptions of univariate neuroimaging analysis, and how it is used to identify the FFA. Skip ahead a paragraph if this is familiar territory.
The classic fMRI or PET analysis consists of taking an experimental condition and a control condition, and asking “which areas respond significantly more to the experimental condition than the control?” The resulting activations can be said to constitute areas that are specifically implicated in the experimental condition. For example, the FFA is usually defined as the part of the fusiform gyrus that responds more to faces than to houses. Note that there is an element of inference or assumption involved in then concluding that this bit of brain is the bit that does faces, since other areas might also respond to faces without being detected in a relatively insensitive univariate whole-brain analysis. The common acceptance of this type of contrast analysis stems in part from its practical utility. For example, the FFA corresponds closely to the critical lesion site that causes prosopagnosia (an inability to recognise faces), and activation in this area can be correlated with behavioural performance at various face recognition tasks.
In this study, contrasts were used to identify the FFA in each participant, in addition to a region in the aIT that also responded more to faces than to objects. To do this, Kriegeskorte et al (2007) used only four stimuli, as shown below.

Although contrasting faces and houses revealed the previously mentioned activations in the FFA and aIT, contrasting the two different faces produced no activations.
Kriegeskorte et al (2007) next used a type of pattern analysis, where the FFA and aIT voxels were used as input. The specifics of this type of analysis are too complex to discuss in detail here (see this review by Norman et al, 2006 which concerns a related technique, and a previous post), but essentially, this analysis uses multivariate statistics to assess whether the overall pattern of activation in an area differs significantly between conditions. If it does, it can be inferred that the area processes information about the categories. Pattern analyses are far more sensitive than traditional contrasts when it comes to differences within a region, but they achieve this sensitivity by sacrificing spatial localisation. Kriegeskorte et al (2007) used a range of pattern analyses, but their results are nicely summarised by the analysis depicted in this figure.

In this analysis, Kriegeskorte et al (2007) attempted to discriminate between the two faces based on an increasing number of voxels, expanding from the FFA and aIT regions that were revealed by the contrast. The lines on the y-axis show whether the patterns evoked by the two faces are significantly different in the voxels. Only the voxels in the right aIT respond significantly differently to the two faces, and this difference becomes significant early, when around 200 voxels are included. By contrast, even when 4000 voxels around the FFA are included, encompassing much of the temporal and occipital lobes, the activation here cannot discriminate between the two faces.
So to summarise, both the FFA and the aIT (among other areas) respond more to faces than to houses, but only the aITS responds differentially to specific faces. Although these results lend themselves to the conclusion that the FFA does some type of face detection while the aITS is involved in encoding the identity of faces, Kriegeskorte et al (2007) suggest that it probably isn’t that simple. Previous studies have found identity-specific activations in the FFA using other paradigms (e.g., Rotshtein et al, 2005), so Kriegeskorte et al (2007) go for the classic neuroimaging cop-out of suggesting that identity information nevertheless exists in the FFA, but at a resolution beyond that of current scanners. However, note that the fact that the identity effects in the aIT were detectable suggests that this area might play a larger role in this task than the FFA does, at least. Kriegeskorte et al (2007) note that prosopagnosia may be caused by lesions to the FFA region, but also by aIT lesions, and suggest that face recognition depends on interactions between (among others) these two areas.
From a more methodological standpoint, it is interesting to note that although a contrast between the two faces yielded no significant effects, differences appeared in a pattern analysis. This is a nice example of how pattern analysis may be a more sensitive measure.
The aIT has not received a great deal of attention previously as a face recognition region, so Kriegeskorte et al (2007) are probably going to face close scrutiny, as they have essentially posited that the region plays a leading role in the holy grail of face perception – the recognition of individual faces. It is interesting to note, however, that these findings do offer a means of reconciling fMRI results from humans with data from single-cell recording studies in monkeys, which have revealed identity-specific face responses primarily in anterior temporal regions. Such monkey regions correspond far better to the aIT than the FFA, which has been somewhat of a problem for the conventional account of the FFA as a Swiss army knife of face perception (but see Tsao et al, 2006 for evidence of a better monkey homologue of the FFA).
Really though, the most striking thing about this study is that current neuroimaging technique enables us to discriminate between the neural representation of these two faces. When you look at the faces above, it is clear that physically, they are quite similar. It is quite inspiring to think that it is nevertheless possible to pick out these undoubtedly subtle differences in the evoked neural response pattern.
References
Kriegeskorte, N., Formisano, E., Sorger, B., and Goebel, R. (2007). Individual faces elicit distinct response patterns in human anterior temporal cortex. Proceedings of the National Academy of Sciences (USA), 104, 20600-20605.

This rat doesn’t get sucrose, but is probably happier than Stalnaker et al’s rats
![]() Today’s title may be the least accessible yet, but bear with me; this is an interesting paper. Stalnaker et al (2007) investigated the neural basis of what they call cognitive flexibility – this is a very fancy term for a rat’s ability to handle a conditioning paradigm known as reversal learning. The method that Stalnaker et al used serves as a good example of the paradigm.
Today’s title may be the least accessible yet, but bear with me; this is an interesting paper. Stalnaker et al (2007) investigated the neural basis of what they call cognitive flexibility – this is a very fancy term for a rat’s ability to handle a conditioning paradigm known as reversal learning. The method that Stalnaker et al used serves as a good example of the paradigm.
Rats were first trained on an odour discrimination task. Poking at one little door that is laced with odour A produces delivery of a tasty sucrose solution. Poking at another little door that is laced with odour B produces delivery of an unpleasant quinine solution (incidentally, quinine is a component in Vermouth, but we’ll assume that these particular rats like their martinis very dry). The actual door that is associated with each odour is varied, so that the rats have to rely on the odour cues alone to learn how to get their treat. Once the rats have achieved a criterion level of accuracy at this task, the contingency reverses, so that odour B now produces a treat while odour A produces quinine. The model finding is that the rats will be slower to learn the reversal than they were to learn the original task.
Stalnaker et al were interested in investigating the role of orbitofrontal cortex (OFC) and the basolateral amygdala (ABL) in bringing about this reversal. There are two basic ideas on how this might work: the OFC might directly encode the preferred stimulus, or the OFC might play an indirect role where it facilitates changes in downstream areas, such as the ABL. So in other words, downstream areas bring about the actual behaviour, while the OFC plays more of a modulatory role in telling the downstream areas when contingencies change.
To test these notions, Stalnaker et al lesioned the OFC in one group of rats, the ABL in another group, and both the OFC and the ABL in a third group. After this, the rats learned the odour discrimination task. The three groups did not differ significantly at this point. In other words, neither area or the combination of them was necessary to learn the task. Next, the rats went through two serial reversals – odour A switched places with odour B, and then back again. The effect of the brain lesions was measured by the number of trials taken to learn the reversals to the same accuracy level as the initial odour task.
Rats with OFC damage were slower to learn the reversals than the other groups. However, rats with ABL lesions and rats with combined OFC and ABL lesions did not significantly. So in other words, although OFC lesions in isolation cause impairments, this effect is abolished when the ABL is sectioned as well.
Stalnaker et al interpret these findings as support for an indirect role for the OFC in reversal learning. The ABL is stubborn, simply put. Without the modulatory influence of the OFC, the ABL persists in responding as though the contingency had not reversed, which produces slower reversal learning. By removing the ABL as well, this persistent influence is gone and reversal learning can occur normally. It is somewhat counter-intuitive that lesioning more of the brain helps, but there you go.
This is a nice study because it answers one question, but asks a number of new questions. If the rats can carry out reversal learning normally without either the OFC or the ABL, why is this circuit even involved in the paradigm, that is, why should OFC lesions have an effect, if the pathway as a whole is not needed? Also, if the ABL produces such deficient behaviour when the OFC is lesioned, why don’t lesions to the ABL affect behaviour? And most importantly, if behaviour is normal after ABL and OFC lesions, which other area must be lesioned to impair behaviour yet again. And what happens if this area is lesioned in isolation?
Enough questions to make your head spin, but the take-home message for those studying humans is that there is an entire range of complex interactions in the brain that fMRI, with its blurry temporal resolution and lack of experimental manipulation, can only hint at. We know much about functional localisation in the human brain, but the issue of how these areas connect and interact is largely uncharted territory.
References
Stalnaker, T.A., Franz, T.M., Singh, T., and Schoenbaum, G. (2007). Basolateral Amygdala Lesions Abolish Orbitofrontal-Dependent Reversal Impairments. Neuron, 54, 51-58.

Picture by Brandt Luke Zorn, Wikimedia Commons
![]() Iacoboni has gotten in trouble recently for some bizarre, non-peer reviewed and much publicised studies investigating voters’ neural reactions to the different presidential candidates. Vaughan noted that it is a little surprising that Iacoboni, who has done some fantastic work, would put his name on such weak research. I couldn’t help but be reminded of a post over at Dr Petra Boynton’s blog on the shameless proposals she has received from marketing companies. Essentially, the business model is that you as a researcher either gather some junk data yourself for handsome compensation, or alternatively, you simply sign off on a ready-made article. It is a credibility-for-cash transaction.
Iacoboni has gotten in trouble recently for some bizarre, non-peer reviewed and much publicised studies investigating voters’ neural reactions to the different presidential candidates. Vaughan noted that it is a little surprising that Iacoboni, who has done some fantastic work, would put his name on such weak research. I couldn’t help but be reminded of a post over at Dr Petra Boynton’s blog on the shameless proposals she has received from marketing companies. Essentially, the business model is that you as a researcher either gather some junk data yourself for handsome compensation, or alternatively, you simply sign off on a ready-made article. It is a credibility-for-cash transaction.
Unfortunately, such spin doctor stories might get in the way of real research on voter behaviour. In the latest issue of PNAS, Ballew and Todorov (2007) report that election outcomes can be predicted from fast face judgements in participants who know neither of the candidates. In other words, to some extent voting behaviour is influenced by quick judgments of appearance – maybe the guy with the better hair really does win. Although this study is very interesting, there are a few shortcomings that will be discussed at the end of this post.
Ballew and Todorov gathered pictures of the winner and the runner-up from 89 gubernatorial races. The pairs were shown to participants, who picked the candidate that seemed more competent (other measures were also used, but I’ll spare you the details). In order to avoid familiarity effects, Ballew and Todorov also included a check for whether the participants recognised any of the candidates. Trials in which the participant did recognise a candidate were excluded. The paper contains three experiments, of which I will cover the first two.
In experiment 1, participants were specifically instructed to base their decision on their gut feeling of which candidate would be more competent. The stimuli were presented for 100 ms, 250 ms, or until the participants responded.
Across all conditions, the competence judgements were significantly above chance (50 percent) in predicting the elected candidate. The three conditions did not differ significantly amongst themselves. Looking across all races, the participants’ averaged “vote” achieved an accuracy of 64 percent in predicting the election outcome. This may seem like a trivial increase over chance, but keep in mind that the participants based this decision on only a very brief exposure to an unfamiliar face. The fact that they could predict the winner suggests that voter behaviour is to some extent determined by the same type of fast, automatic evaluations.
In experiment two, Ballew and Todorov sought to investigate whether this effect could be modulated by the instructions that the participants received. Since Ballew and Todorov are advocating the notion that these judgments are automatic and fast, it becomes important to show that participants gain nothing when they have more time to plan their response. Thus, one group was instructed to deliberate carefully over their decision, and were given no time limits for viewing or responding. A response deadline group viewed the stimulus until they responded, which they had to do within 2 seconds. Finally, the 250 ms condition from experiment 1 was replicated for comparison.
In addition to this, Ballew and Todorov restricted the candidate photos to pairs in which the candidates shared the same gender and ethniticity. This was done since results in experiment 1 indicated that predictions were stronger for such pairs.
As in experiment 1, participants in all conditions were significantly more likely to pick a winning candidate. However, when investigating how each group’s “vote” predicted the election outcome, the deliberation group was not significantly above chance, while the two short-exposure non-deliberation groups were above chance, achieving an average accuracy of 70.9 percent between the two. In other words, careful deliberation and slow responding actually hindered performance.
I think these results are nice, since they offer an explanation for why candidates are so well-groomed (particularly the winners), even though no voter would ever admit to basing their choice on the candidate’s appearance. However, I see two issues with this research. First, although Ballew and Todorov asked their participants to rate competence, was this really what the participants were responding to? Given the fast processing that was necessary in the conditions where the participants performed well, it is perhaps unlikely that they were able to incorporate the instructions. Ballow and Todorov compared the ‘gut feeling’ instructions to a condition where participants were asked deliberate, but unfortunately they confounded the ‘instructions’ variable by giving the participants in the deliberation group unlimited time, in addition to different instructions effectively. It would also have been nice to see a control condition where participants indicated which face was more attractive rather than more competent, to show that participants were responding to something more abstract than attractiveness.
The second problem is more fundamental. Ballew and Todorov used participants from the US who viewed US gubernatorial candidates. In other words, it is likely that participants had been exposed to some of the candidates beforehand. We know from a phenomenon called the mere exposure effect that we tend to like things that we know better. It is not unlikely that winning candidates received more media exposure, so the participants may simply have responded to their increased familiarity with the winning candidate.
Ballew and Todorov tried to control for this by removing trials where the participants reported that they recognised the candidate, but this may be insufficient. Research on the mere exposure effect shows that even subliminal exposure to an object can increase self-rated liking for it. So even if the participants didn’t recognise the face, they may still have been exposed to it, and this may have biased their ratings. You might also think that winning candidates may have gained more exposure simply by acting as governor following the election. However, this account can be ruled out by the third experiment, which I haven’t reported here. Essentially, Ballew and Todorov replicated their findings with voters before an election.
To rule out mere exposure effects more conclusively, Ballew and Todorov would have done well to use candidates from local elections in other countries, where any kind of prior exposure would be more unlikely. You can’t help but feel that in using US voters and US guvernatorial candidates, Ballew and Todorov are sacrificing accuracy of measurement for face validity and impact. It is quite powerful to show that US voters respond this way to US candidates – it drives home the point that this is an effect that likely operates outside of the lab too. That being said, I’m not sure if this is a reasonable trade-off to make.
Finally, it’s worth noting that even if Ballew and Todorov’s results really do measure mere exposure (we would need to carry out more research to confirm that), that doesn’t render the findings invalid. It merely means that the mechanism that brings about the behaviour isn’t fast, automatic judgment of facial features, but fast, unconscious biasing based on prior exposure.
References
Ballew, C.C., and Todorov, A. (2007). Predicting political elections from rapid and unreflective face judgments. Proceedings of the National Academy of Sciences (USA), 104, 17948-17953.