When something breaks on your WordPress site, pinpointing the issue can feel daunting. Thankfully, WordPress debugging can be a big help. Whether it’s a faulty plugin, theme conflict, or database query issue, debugging tools uncover the problem fast.
In this guide, you’ll learn how to enable WordPress debug mode. We’ll also discuss log errors, and discuss advanced WordPress debugging options. Use these to identify and resolve a wider range of issues. Then, we’ll cover tips to keep your site secure and optimized while troubleshooting.
Table of contents
What’s the purpose of WordPress debug?
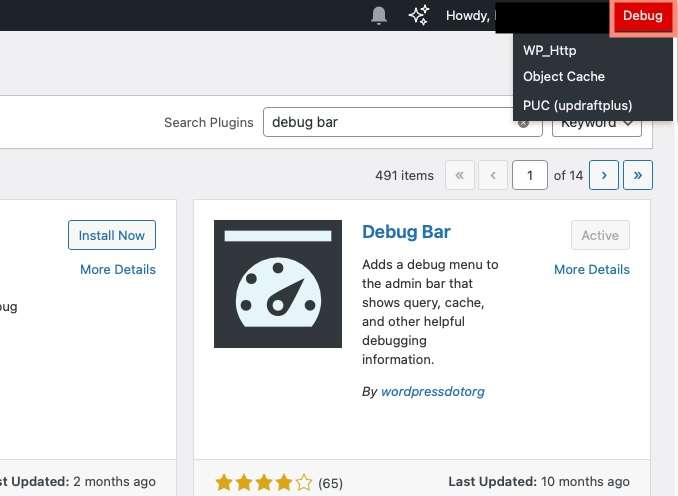
WordPress debug mode helps identify what’s causing issues on your website. It works by reporting all PHP errors, warnings, and notices. This gives a clearer view of what’s going wrong behind the scenes. By default, these messages appear in the user interface (front end or admin panel). For instance, the Debug Bar plugin adds a red button to the dashboard for easy access:
But you can also redirect them to a log file for easier analysis. Debugging is turned off by default in WordPress to maintain performance and security. You should only enable it temporarily when troubleshooting issues. For instance, when features on your site break or there are plugin conflicts.
Keeping debug mode active on a live site can negatively impact performance. It can also expose sensitive site information and pose security risks. That’s why it’s crucial to disable debugging once you’ve identified and fixed the problem.
Enabling WordPress debugging
Enabling the WordPress debug mode and logging errors to a file can help identify the root cause of an issue. Follow the steps below to enable WordPress debugging and capture issues effectively:
Remember to back up your site before following these steps!
1. Access your WordPress configuration file

Use FTP, SFTP, or your hosting file manager to locate and open the wp-config.php file. This file is typically found in the root directory of your WordPress installation.
2. Enable WordPress debug mode
Add or edit the following line in your wp-config.php file to turn on debug mode:
define( 'WP_DEBUG', true );This line makes WordPress display PHP errors, warnings, and notices.

3. Enable the debug log file
To log all error messages to a file, add the following line directly below the WP_DEBUG setting:
define( 'WP_DEBUG_LOG', true );This creates a debug log file named debug.log in the /wp-content/ directory of your WordPress installation.

4. Reproduce the issue
Once debugging is enabled, trigger the specific error by performing the problematic action. This will ensure the error details are captured and logged to the debug.log file.
Review the debug log file
Navigate to the wp-content/debug.log file to view the logged errors. You can access the file using:
Your hosting file manager
FTP/SFTP client (like FileZilla)
A text editor or code editor
The file will display any errors, helping you pinpoint the issue. In the following example, the site had an issue related to the Contact Form 7 plugin, which was logged immediately:

Disable debugging after troubleshooting
Once you’ve completed debugging and identified the issue, disable debugging. Doing so ensures it doesn’t affect your site performance or display errors to visitors. Update the WP_DEBUG and WP_DEBUG_LOG settings in wp-config.php to false:
define( 'WP_DEBUG', false );define( 'WP_DEBUG_LOG', false );Additional WordPress debugging options
While the main debugging methods are typically sufficient, there are additional options. These extend WordPress debugging capabilities. They are rarely required but can be helpful in specific scenarios.
Here’s a quick reference of what we’ll discuss:
| Constant | Purpose | Default Value | When to Use |
|---|---|---|---|
| WP_DEBUG_DISPLAY | Displays debug messages on-screen | true | Development/testing (not on live sites) |
| SCRIPT_DEBUG | Loads uncompressed CSS and JavaScript files | false | Debugging scripts and styles |
| WP_DEBUG_LOG | Saves debug messages to a log file | false | Logging errors for later review |
| SAVEQUERIES | Tracks and logs SQL queries for analysis | false | Identifying slow database queries |
Here’s a breakdown of these advanced debugging methods:
WP_DEBUG_DISPLAY
When used alongside the WP_DEBUG constant, the WP_DEBUG_DISPLAY option determines whether debug messages are displayed directly on the front end of your website (HTML pages).
By default, WP_DEBUG_DISPLAY is set to true when WP_DEBUG is enabled. This causes WordPress to display error messages on-screen as they occur. Use this option during development or troubleshooting in a staging environment where errors need to be visible.
Enabling this option on a live site can expose sensitive information about your website. This information could be exploited by bad actors, so be mindful.
How to enable WP_DEBUG_DISPLAY
Add the following line to your wp-config.php file:
define( 'WP_DEBUG_DISPLAY', true );If you want to hide error messages from visitors while keeping WP_DEBUG enabled, set it to false:
define( 'WP_DEBUG_DISPLAY', false );SCRIPT_DEBUG
When enabled, the SCRIPT_DEBUG constant forces WordPress to load the non-minified (development) versions of its core CSS and JavaScript files instead of the default minified versions.
WordPress usually loads compressed versions of these files like .min.js and .min.css to improve performance. When SCRIPT_DEBUG is enabled, it loads the uncompressed files instead. These are easier to debug.
This option is particularly useful for:
Debugging custom CSS or JavaScript changes
Identifying issues with core scripts
Testing plugins or themes that manipulate JavaScript or CSS files
How to enable SCRIPT_DEBUG
Add the following line to your wp-config.php file:
define( 'SCRIPT_DEBUG', true );Logging of WordPress database queries
In WordPress, you can log all database queries to help identify performance issues. This can also help you spot inefficient queries or potential database issues. This helps when troubleshooting many circumstances. For instance, slow-loading pages, optimizing database usage, or debugging plugin and theme queries.
When enabled, WordPress saves all executed SQL queries, their execution times, and the functions or files that initiated them into an array within the $wpdb->queries global variable.
How to enable database query logging
To enable query logging, you need to modify the wp-config.php file. To do this, access your WordPress files using FTP, SFTP, or your hosting file manager.
Locate and open the wp-config.php file in the root directory. Then add the following line just above the line that says /* That’s all, stop editing! Happy blogging. */:
define( 'SAVEQUERIES', true );Once enabled, WordPress logs:
The exact SQL query executed.
The time taken to execute each query (in seconds).
The function or file responsible for initiating the query.
All this information is stored in the $wpdb->queries global variable as an array.
How to view the logged queries
To display the queries on a page, you can print the $wpdb->queries array using the following code snippet:
global $wpdb;
echo '<pre>';
print_r( $wpdb->queries );
echo '</pre>';
Place this snippet in your theme’s template file (like footer.php or functions.php) or use a plugin to temporarily run it. The output will list all queries executed during the page load, along with their execution time and source.
Using WP Activity Log to keep tabs on WordPress activity and debug

WP Activity Log is a comprehensive WordPress plugin designed to monitor and record user and system activities in real time. It offers many features that aid in debugging and troubleshooting your WordPress site.
Key features include:
Comprehensive activity logging: The plugin tracks a broad spectrum of activities, including content changes, plugin and theme updates, user role modifications, and system settings adjustments. Each event is logged with details such as date and time, user role, IP address, and the specific change made, enabling you to trace back issues to their origin.
Real-time alerts: WP Activity Log sends instant email and SMS notifications for critical site changes, allowing you to respond promptly to potential issues.
User session management: The plugin provides real-time monitoring of user sessions, allowing you to see who is logged in and what they are doing. You can also terminate sessions remotely, which is useful if unauthorized changes are detected.
Detailed reports: Generate comprehensive reports on user and system activities, which assist with identifying patterns or recurring issues that affect site performance.
Search and filtering: The plugin includes advanced search and filtering options, making it easier to locate specific events or activities within the log. This feature is particularly helpful when diagnosing issues that are not immediately apparent.
You can use WP Activity Log to assist directly with debugging activities. Specific debugging actions you can take include:
Identifying error sources: It’s through reviewing the activity logs you can pinpoint the exact changes that preceded an error, like a plugin update or a configuration change.
Monitoring user actions: In multi-user environments, tracking who made specific changes helps in understanding how certain issues arose, especially if they result from user errors or unauthorized access.
Detecting configuration changes: The plugin logs all changes to site configurations, so you can identify any alterations that may have led to site issues.
Real-time issue detection: With real-time alerts, you can be immediately informed of critical changes or potential security breaches, allowing for swift action to mitigate any negative impact.
Using WordPress debugging plugins
If you’re not comfortable editing files directly or you want a more direct debugging experience, WordPress debugging plugins are useful. These tools allow you to troubleshoot issues without diving into your site’s code. This provides easy-to-read reports, logs, and insights right within the WordPress dashboard.
Here are some of the best debugging plugins you can use:
Query Monitor: This is one of the most powerful and popular debugging plugins for WordPress. It helps you identify issues with database queries, PHP errors, hooks, and even API requests. It displays slow and duplicate database queries, highlights PHP warnings, notices, and errors, and tracks enqueued scripts, styles, and HTTP requests. This plugin works well for debugging slow page performance, plugin conflicts, and database inefficiencies.
Debug Bar: This tool adds a simple, easy-to-access debug menu to your WordPress admin bar. It provides a clean interface to view PHP errors, database queries, and other debug information. It tracks database queries and execution times and also displays PHP warnings and notices. Use Debug Bar for basic debugging, especially when you need quick insights without overwhelming data.
WP Debugging: Now this is a lightweight plugin that simplifies enabling WordPress debug constants without editing the wp-config.php file manually. It’s perfect for users who want to toggle debug mode quickly. It also logs errors to the debug.log file in the /wp-content/ directory and prevents accidental exposure of debug data on live websites. WP Debugging is useful for quick troubleshooting sessions where manual file edits aren’t feasible.
Health Check & Troubleshooting: Another option is the Health Check & Troubleshooting plugin, which helps you identify site issues by isolating plugins and themes. It temporarily disables them for your session only, allowing you to troubleshoot without affecting your visitors. It logs errors, slow responses, and other performance issues as well and is ideal for isolating plugin or theme conflicts while keeping your live site running smoothly for visitors.
Frequently asked questions
If you’re new to WordPress debugging or just want to troubleshoot issues more effectively, these frequently asked questions will help you understand the process, tools, and best practices for debugging your website safely.
Yes. Some debugging options can have an impact on the performance of your website. Therefore, unless it’s a test or staging website, don’t enable debugging on live websites.
WordPress debug mode is a built-in troubleshooting tool that helps identify PHP errors, warnings, and notices within your WordPress site. It’s commonly used by developers to troubleshoot issues during development or testing.
WP_DEBUG_LOG enables error logging by saving debug messages to a log file (wp-content/debug.log). This is helpful for reviewing errors without displaying them on the front end. WP_DEBUG_DISPLAY controls whether error messages appear on your website. Setting this to false hides messages from visitors.
SCRIPT_DEBUG forces WordPress to load the non-minified versions of core JavaScript and CSS files. This is useful for developers when debugging JavaScript or CSS issues.