| CARVIEW |
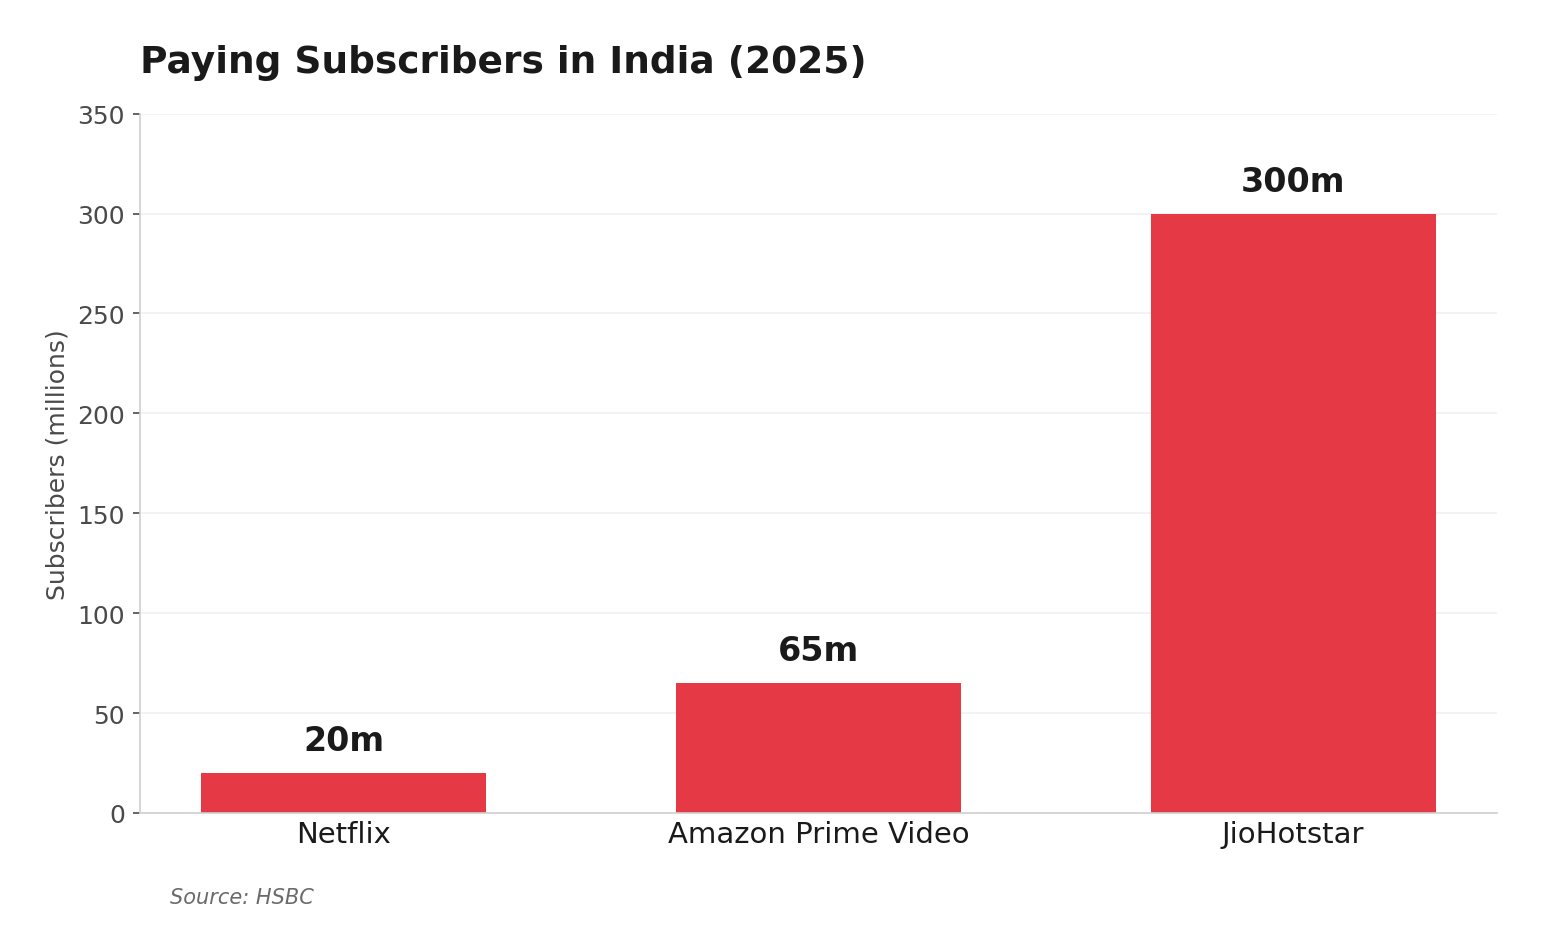
Prime Video, which also comes bundled with Amazon's e-commerce Prime subscription, has roughly 65 million paying subscribers in India, compared to Netflix's roughly 20 million, the bank wrote in a note to clients.
JioHotstar, the market leader formed as a result of the merger between Disney and Mukesh Ambani-controlled Viacom18, leads the Indian market with over 300 million subscribers.
Only 24% of OTT users in India pay for their content, HSBC estimates. To win customers in the country, all major streaming services have lowered their prices drastically. Netflix, which entered India in 2016, charges as little as $19.5 a year for an entry-level subscription tier in the country. Amazon Prime and JioHotstar both charge $16.40 annually. Up to 90% of video consumption in India happens on mobile devices.
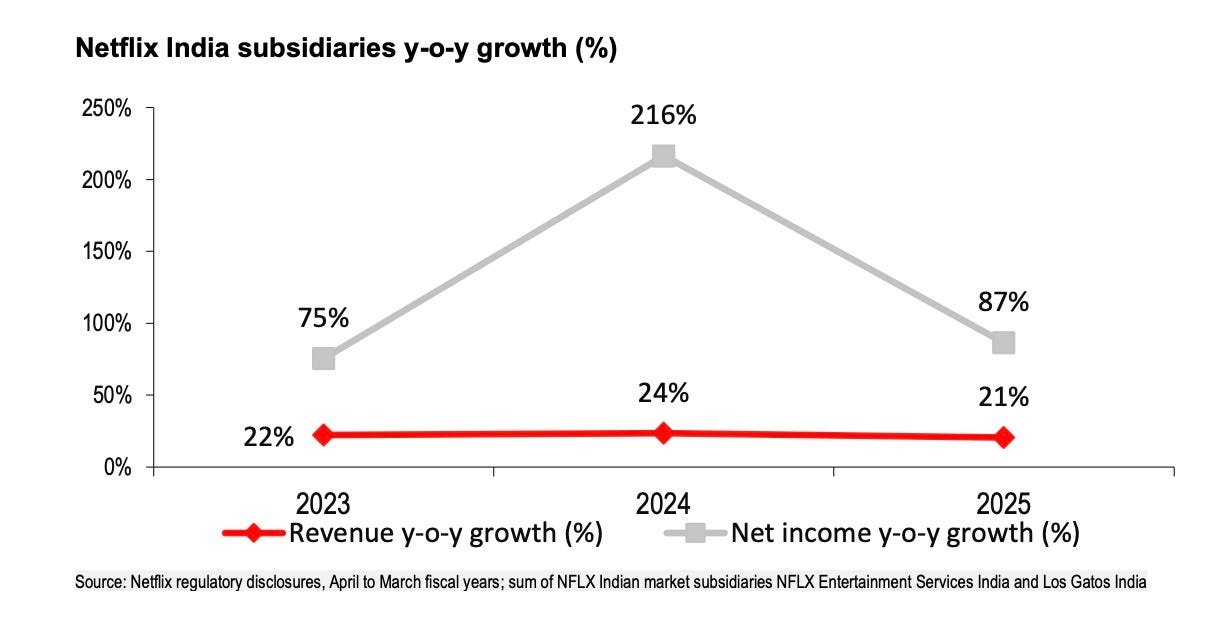
Netflix India's revenue reached $905 million in 2025, HSBC projects, representing about 2% of the company's global total. Its India subsidiaries posted a 22% revenue CAGR from 2022 to 2025 and a 118% net profit CAGR over the same period. Pretax margin sits in the low single digits.
JioHotstar's local content library spans 320,000 hours, roughly six times the size of Netflix's Indian catalogue. JioHotstar holds exclusive streaming rights for IPL cricket and for Warner Bros./HBO and Disney content in India. When JioHotstar shifted IPL viewers from a freemium model to paid subscriptions in early 2025, its subscriber base jumped from around 50 million to nearly 300 million within four months.
India's OTT market has topped 600 million users and is projected to grow revenues at a 16% CAGR through 2029. Netflix management has said the company is on the "right track" in India while acknowledging there is "a long way to go."
]]>Reliance, the most valuable company in India, said on Friday that daily orders on its hyper-local commerce service hit 1.6 million at peak during the quarter ending December. This is a peak figure, not a daily average. Compared to Blinkit’s 2.4 million daily orders in the quarter ending September, it’s still something. The company, management said on an earnings call, aims to become the second largest quick commerce player in the category.
These are tall claims from the country’s largest retail chain that raised capital at $100 billion valuation in 2023. But curiously, public market institutional investors, analysts and leadership at the current top three quick commerce players are not worried about Reliance or its claims. It’s not arrogance. They are simply not seeing much of Reliance on the battleground.
Reliance Retail, whose quarterly revenue is larger than the annual GMV of all Indian quick commerce players combined, prefers to avoid the “quick commerce” label. It goes with “hyper-local commerce” instead. Its version of quick commerce promises delivery in 30 minutes, or thereabouts. The Big Three (Blinkit, Zepto, Instamart), in comparison, focus on delivering most orders within 15 minutes.
Quick commerce is important to Reliance. Growth has been slow at Reliance Retail and the unit has struggled to make inroads with traditional e-commerce despite many gimmicky partnerships.
Reliance wants to own the narrative that it is beginning to move the needle meaningfully in quick commerce. This would help, the company believes, puncture the prospects of traditional e-commerce giants that have barely scratched the overall retail surface and are suddenly nowhere to be found in the quick commerce race.
So why is nobody taking Reliance’s claims at face value? In tier 1 India, JioMart, Reliance’s digital commerce app, is rarely ever part of any conversation. But that’s fine, a majority of people in tier 1 are also not customers of Meesho. But unlike Meesho’s value commerce play, quick commerce is not yet a tier 2 and beyond story, so who precisely is using JioMart and placing quick commerce orders there?
The thing with Meesho is that even those who are not Meesho customers know for a fact that Meesho has many customers.
JioMart, in comparison, is far behind Blinkit and Zepto.
I don’t doubt Reliance’s figures. But either its metrics measure something different from what the Big Three report, or the market is wrong to discount it. Either way, some correction is due.
]]>The Indian startup market is the third largest in the world by participant count. But unlike the U.S. and China, the two largest markets, India has historically performed poorly in delivering returns. “Returns on capital in India have sucked historically. If you look at the market-leading internet companies, whether it is Google, Facebook, Alibaba or Tencent, revenue for them got bigger than cost more than a decade ago. You had a great legacy of last 17-18 years of materially profitable internet companies. So returns on equity in the internet got really high and the returns for investors have been really high. But that did not happen in India,” Scott Shleifer, former venture lead partner at Tiger Global, told a group of entrepreneurs in early 2023.
For the longest time, the criticism Indian venture investors faced was whether India would ever deliver enough exits, whether Indian companies would ever go public, and whether Indian public markets had the appetite for new-age startups. The Indian market started to answer some of these questions in 2021. A wave of new-age firms, including Zomato, Policybazaar, Paytm and Nykaa, went public that year, delivering great returns for their early backers.
But Indian markets have been brutal in many ways. Paytm and Freshworks are still trading considerably below their debut listing prices. Zomato, the top public Indian internet firm, has created more than 70% of its value after the IPO, much of it after the majority of venture firms exited the company.
In this way, 2025 was a great year for the ecosystem. Groww and Meesho delivered stellar returns and months into their debuts are still trading significantly higher than their listing prices. Pine Labs, Urban Company, Lenskart and Physicswallah were other notable successful debuts. These have all been amazing lagging indicators for how the ecosystem finally stood tall. A group of other impressive companies, including Razorpay, PhonePe, Zetwerk, and Zepto, are all expected to go public in the next four quarters. So good times are set to continue, in a way.
The concerning factors are those that will not be publicly apparent for a few years to come. The pipeline of potential big hitters from the last four to six years looks very thin. Many of the impressive SaaS startups that the investors backed between 2018 and 2022 are looking increasingly less relevant and appealing. The ecosystem is also yet to publicly confront the reset in valuations and erasure of paper gains from so many startups that raised at very high valuations between 2021 and 2023, but are suddenly nowhere to be heard.
Venture partners in the U.S. market have been able to wrestle with this global reality because they had enough other portfolio winners, crypto-things, and some AI investments they made in exuberant times that suddenly made everything more than worthwhile.
Indian venture firms don’t have that privilege. You can count on two hands all the impressive, might-probably-make-it deeptech and AI startups from India founded in the last decade.
VCs in India have been increasingly scrambling to back such deeptech and AI startups. Over the last two years, the majority of VCs, including all the tier-one firms, have shown reluctance to back most non-AI ventures, but the universe of startups they can back hasn’t meaningfully grown. SoftBank, which has been focusing on AI deals in recent years and has deployed billions in India, has made zero new investment in the South Asian nation in the last three years.
There is general pessimism among many investors about anything fintech because of the many regulatory changes – or clarities – pushed by the Indian central bank. Jupiter and Fi, two startups that raised significant capital for building neobanks, are nowhere to be found. Byju’s and Unacademy killed much of the appetite for edtech in the country. The largest Indian e-commerce startup is always listing that particular year, reportedly, but its finances are always a few years away. Some global investors who were still willing to underwrite all the regulatory pains in India were hit with a slap when Dream11’s business overnight evaporated.
So it shouldn’t come as a surprise that Peak XV is increasingly focusing its attention on the U.S. market. Let that sink in: The largest venture capital firm operating in India has to look elsewhere for dealmaking. Lightspeed is looking to raise a smaller fund than the $500 million it raised for India earlier because, at the end of the day, the Indian market doesn’t offer the kind of opportunity to deploy that much capital anymore.
Other venture firms have taken the opposite approach, continuing to raise larger funds and developing, for the first time in their existence in India, the conviction and expertise to invest in late-stage startups – because, in part, why risk less management fee.
These shifts in strategy are making many partners uneasy, some of whom have left their firms in the last year or so to start their own. The failure to have succession plans at many of these venture firms has meant that many mid-level executives departed last year because they don’t see any promotions or room for growth coming for years.
The Indian venture ecosystem enters 2026 caught between two realities: the celebratory exits of bets made a decade ago and the quiet anxiety over what the next decade’s returns will look like. Sadly, the former will dominate the headlines.
]]>But the Indian IT industry has spent this year pushing back. It cut margins, restructured workforces, built platforms, and told clients that AI has not transformed their enterprises because their enterprises are a 30-year accumulation of SAP, Oracle, Workday and middleware that was never designed to talk to anything. And finally, Indian IT is who you call when systems need to talk to each other.
Despite all the hype, generative AI is moving slowly. Less than 15% of organizations are meaningfully deploying the new technology at their firms, according to investment bank UBS. And the narrative about the Indian IT dying is beginning to recede. Investment group CLSA titled a note this month, “Discussion moving beyond AI,” a sign that the existential panic has subsided enough for analysts to return to debating deal pipelines and vertical demand.
Enterprise AI has underwhelmed, though of course not from lack of enthusiasm or capital. Industry players say the tech remains inadequate for regulated industries where someone has to sign off on the output. They cite “workslop,” weak governance and high error rate as reasons the gap between AI as boardroom theatre and AI as functioning software remains so wide.
In the meantime, the Indian IT companies are reporting gains from the same force that was supposed to disrupt them.
Infosys now calls AI-led volume opportunities a bigger tailwind than the deflation threat, a reversal from 2024, and orderbooks held steady in the third quarter even as pricing pressure filtered through renewals. Infosys expects its own orderbook to grow more than 50% this quarter, anchored by an NHS deal worth $1.6 billion over 15 years.
The AI capex cycle has been concentrated among a handful of hyperscalers and labs, while the Fortune 500 is still figuring out what to do with what they have bought. Indian IT is betting that figuring out what to do is billable work. Channel checks suggest a two-to-three year window of preparatory work – data cleanup, cloud migration, system integration – before enterprise-wide AI becomes feasible, and that window is where Indian IT plans to earn its keep.
The IT industry has always been reactive to new technology, late to consulting and early-stage advisory but quick to capture implementation spend once the experiments end and the plumbing needs building. The firms believe AI will follow the same arc: a hype phase they mostly miss, followed by a deployment phase where scale, client relationships and tolerance for unglamorous work become valuable again.
TCS, which cut its headcount by 2%, is spending on the “less fashionable” layers – a 1GW data-centre network in India, an indigenous telecom stack, a sovereign cloud – alongside platforms called WisdomNext and MasterCraft. It acquired Coastal Cloud, a Salesforce advisory firm, for capability it did not want to build from scratch.
HCLTech cut margins by 100 basis points, redirected savings toward specialist hiring, and became one of first large systems integrators to partner with OpenAI. The firm announced this week that it had acquired Jaspersoft for $240 million and Belgium-based Wobby to boost agentic AI capabilities. Coforge said on Friday it had agreed to acquire Encora, which offers AI tools for product, cloud and data engineering, at an enterprise value of $2.35 billion.
Infosys has taken a different route, building an asset library rather than data centres. It runs 2,500 genAI projects, has deployed 300 AI agents in its own operations and claims productivity gains of 5-40% depending on service line. Its AI-suite, Topaz, holds 12,000 assets, 150 pre-trained models and 200 agents for code generation, IT operations and billing; Cobalt holds 35,000 cloud assets and 300 industry blueprints.
Leadership now describes the systems integrator as an “orchestrator” – not building models but making them function inside client businesses, where function means plugging into SAP, Oracle and Salesforce without hallucinating key details. Forward deployed engineers sit inside key accounts to identify use cases and move pilots toward production.
Wipro has built vertical platforms including AutoCortex, WealthAI and PayerAI and signed a sovereign AI deal with Nvidia, though the company faces stiff competition in vendor consolidation where productivity baselines already run at 15% before AI shows up. Tech Mahindra has invested in sovereign LLMs and a one-trillion-parameter domain-specific model, hoping India’s national AI push provides differentiation.
Among smaller IT firms, Persistent is reporting what it claims is early evidence of AI-driven productivity, with revenue growing at double digits while headcount stays flat. LTIMindtree has assembled an AI team of over 1,000 to build what it calls a “learning transfer” model to carry lessons from one deal to the next.
IT budgets have grown about 8% annually for the past five to six years for the industry, and the expectation is that the trend continues, with AI taking a larger share alongside cybersecurity and cloud migration.
Large customers want productivity passed through when they adopt genAI, and vendors concede the hit arrives at renewal rather than all at once, which means revenue growth may not return to mid-to-high single digits until FY28 or FY29. IT services are forecast to shrink from 38% of enterprise tech spending in 2018 to 25% by 2029, even as the absolute market grows to $1.3 trillion.
Valuations have not collapsed: the Nifty IT still trades at over 6% premium to the Nifty versus a 10-year average of 10%, and at an over 15% discount to the Nasdaq, close to historical norms. One risk for 2026 is that if the AI-led global tech rally fades, Indian IT would likely suffer rather than benefit, because relative performance has tracked broader tech sentiment even as the underlying business case has diverged.
The IT companies are not claiming victory. The argument is narrower: that the preparatory work AI requires – data cleanup, integration, compliance, tuning – creates enough billable hours to offset what automation takes away, that the middleman remains necessary for different reasons than before.
The bear case assumed AI would work out of the box, that enterprises would deploy it themselves, that Indian IT would have nothing left to sell. Two years in, AI does not work out of the box, enterprises have found it difficult to deploy it themselves, and the firms that were supposed to be dead are still hiring specialists and winning deals.
]]>Everyone in consumer finance insists distribution is the hard part, the expensive grind that breaks young firms before they can find product-market fit. Retail broking in India in many ways inverts this logic because distribution is the product. If you own the app people open by default, you own the funnel, the brand, the habit, and monetisation should follow.
Groww’s problem — and at large, the Indian broking business’ problem — is that a large chunk of what it distributes doesn’t pay: about 50-55% of client assets don’t earn any revenue. Even if you try to monetise mutual funds “properly,” the pool itself is structurally constrained, as roughly 48% of mutual-fund flows are already “direct,” leaving only about half the market where a platform can earn distribution economics. The MF-heavy mix is not just a temporary revenue gap but a smaller monetisable surface area than the headline AUM implies.
Groww’s growth has been extreme — roughly 85% CAGR over FY23-25, higher than most public companies and nearly all new-age startups — but the monetisation gap shows up where it always does in broking: ARPU (average revenue per user) and activity. Market share in accounts is not the same thing as market share in wallet, because AUM per client might look comparable to peers, but the mix matters enormously.
The industry’s secret is that accounts are not the same thing as durable engagement: an industry executive told me that only about 5-20% of new traders remain meaningfully active over time, and the rest wash out after the market teaches them a lesson. ‘Distribution wins’ can be mirages unless they translate into persistent activity and wallet share, and distribution-as-destiny only works if it converts into revenue density without poisoning the UX that enabled distribution in the first place.
Groww built a funnel through mutual fund distribution, amassing roughly 1 million customers via MFs before it even launched broking, and those users fed into brokerage adoption later. The UI/UX advantage was reinforced by an in-house tech team of 500-600 employees, and customer acquisition leaned heavily on word of mouth, as about 80% of customers were directly acquired.
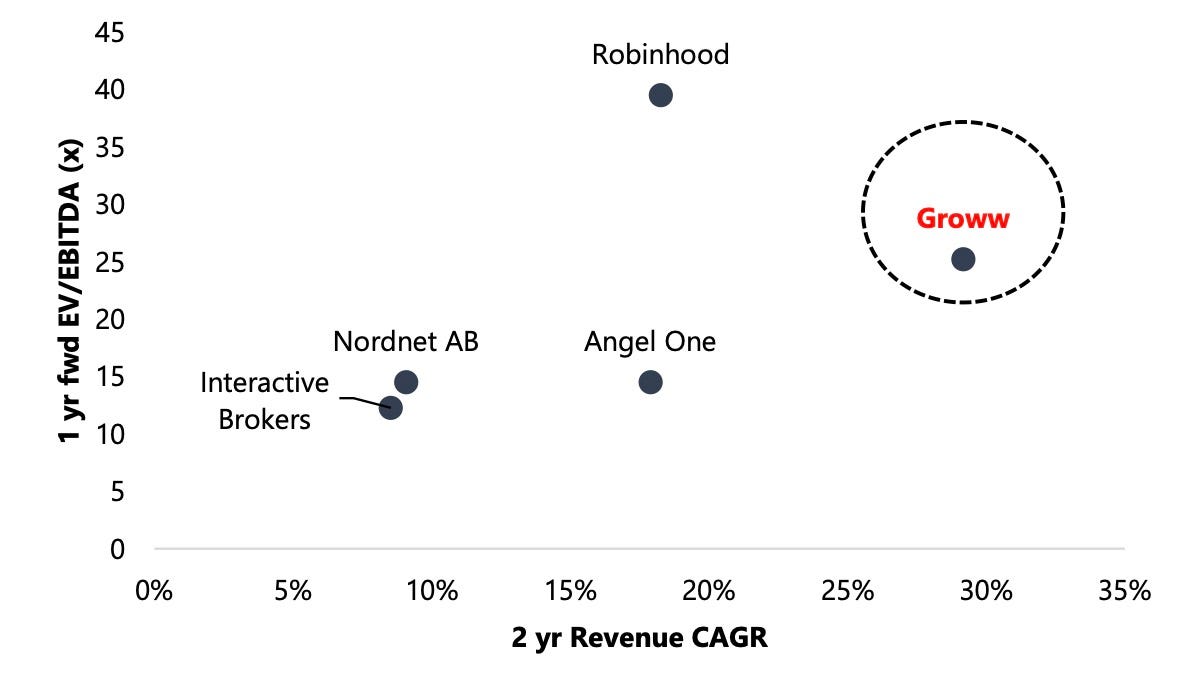
Jefferies on Friday framed Groww as pulling a Robinhood, launching products and features until the revenue mix diversifies and ARPU climbs. The brokerage’s model runs on three assumptions: clients age and assets grow, as about 45% of Groww’s clients are below 30 and clients on the platform for 3-4 years have seen their assets rise 4-5x; there’s headroom for cross-sell, since nearly half of users are “only one product” users; and revenue mix becomes less dependent on basic broking over time, as Jefferies expects “new initiatives” — MTF (margin trading facility), wealth, and others — to become meaningful contributors by FY28.
MTF is where economics get real because it transforms activity into a spread-like revenue stream. Groww’s MTF market share currently sits at roughly 2%, below its retail cash market share, which is the runway argument. The MTF book stood at nearly ₹17 billion ($190 million) in 2QFY26, and projections put it at ₹90 billion ($1 billion) by FY28, implying about 6% market share — still below the cash equity share Jefferies expects by then. Even if cash-equity broking is commoditised, lending against portfolios isn’t, and MTF is a way to monetise “serious” users without explicitly raising brokerage fees.
Groww bought its way into wealth management through Fisdom, a deal that closed recently for ₹9.61 billion ($107 million) at a trailing EV/revenue of 5.9x. Fisdom brought ₹100 billion ($1.1 billion) in AUM, a client base of 350,000 including 6,000 HNIs holding more than ₹2.5 million ($28,000) in assets, and 180 relationship managers.
Jefferies expects Groww to “platform” this into a more scalable, robo-led model for mass affluent users, forecasting wealth AUM rising to roughly ₹750 billion ($8.4 billion) by FY30 and revenues of ₹6.6 billion ($74 million), about 6% of operating revenues.
The top 1% of households control roughly 60% of household assets and about 70% of household financial assets, meaning the paying wallet in India — and many other countries, for that matter — is concentrated. The platform that graduates users into that segment gets paid very differently from the platform that simply onboards them. One of the ideal situations for Groww would be building a one-stop wealth solution that stacks distribution fees, advisory fees, net interest income from loans against assets, and transaction-linked revenues.
Groww’s Adj. EBITDA margin rose from 36% in FY23 to 59% in FY25. Marketing spend sits at ₹4-5 billion ($45-56 million), about 12% of FY25 revenue, and in-house tech lowers vendor costs while protecting UX control. Groww is spending heavily on technology at roughly 11% of operating revenues, higher than many fintech and consumer-tech peers at around 5%.
If this is “Groww means Robinhood,” the Indian version will rhyme rather than repeat. Jefferies lists possible white spaces including unlisted shares, insurance, credit cards, and subscriptions, referencing Robinhood’s “Gold subscriptions” at roughly 15% of revenues as a conceptual pointer for subscription monetisation.
Achieving any of these meaningfully may be difficult at Groww’s current state. Industry participants estimate that Zerodha has cornered a material portion of more tech-savvy and sophisticated customers.
Regulation adds another layer of complexity: if Groww’s monetisation plan leans too hard on high-frequency retail derivatives, that’s a skyscraper on policy sand. Credit carries its own risks, as Groww’s in-house NBFC has a ₹13 billion ($145 million) loan book, primarily personal loans, and incurred credit costs of 7.4% in FY25 due to write-offs. Wealth will take time, because Fisdom’s current economics are human-heavy, and turning that into scalable advice without becoming a mis-selling machine will require a delicate skill.
Jefferies argues Groww trades at a discount to Robinhood despite better growth and margins on its numbers, and that the discount narrows if MTF and wealth scale. Even the IPO proceeds “use of funds” list reads like a monetisation roadmap: cloud infrastructure, brand and performance marketing, NBFC funding, MTF investment, and acquisitions.
Groww’s distribution win is real, but broking market share is a vanity metric unless it turns into ARPU, and ARPU requires monetised products that users accept, regulators tolerate, and risk teams can survive.
]]>Geography, income levels and infrastructure suggest these places should have produced radically different answers to how to sell goods online to the masses. They have instead produced nearly identical answers three times.
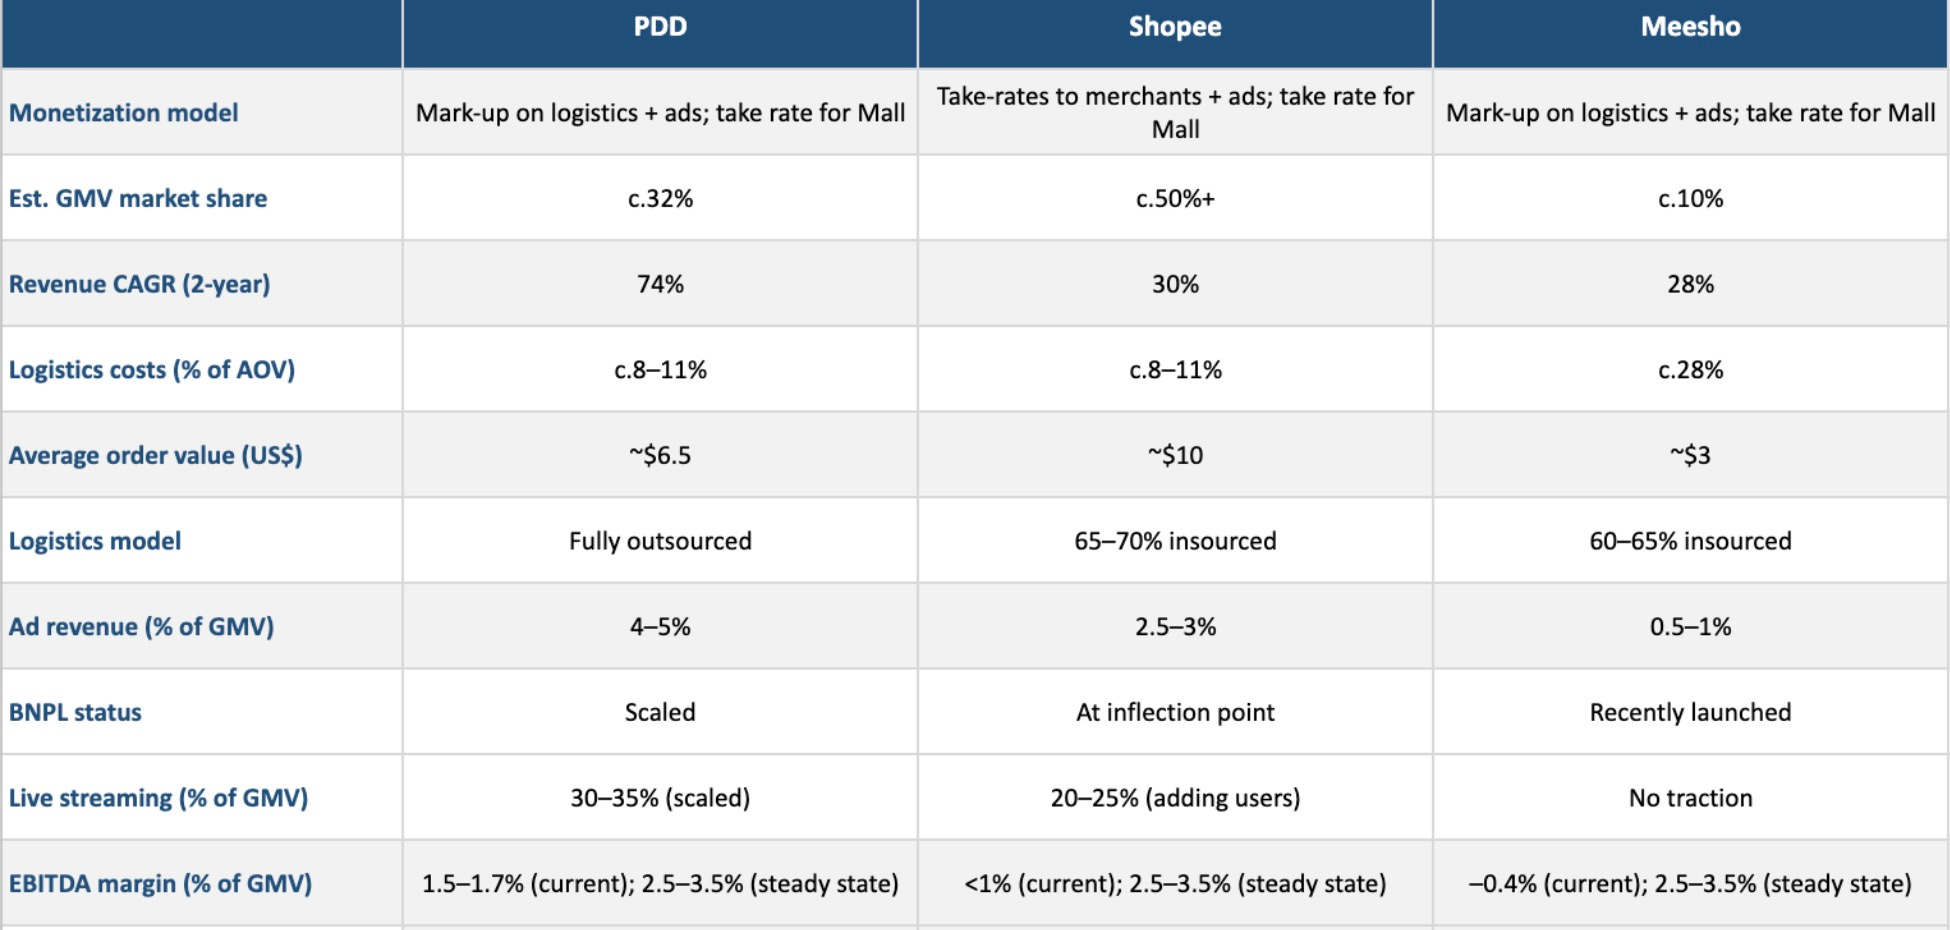
Pinduoduo in China, Shopee in Southeast Asia and Meesho in India run the same business: asset-light marketplaces specializing in cheap goods, slow delivery and monetization through logistics mark-ups, advertising and installment credit rather than retail margins. Temu and Shein, expanding in the U.S. and Europe, are further variations on the same theme.
E-commerce has historically produced radically different business models even within the same country. Amazon and JD.com hold inventory and run their own fleets. Alibaba and eBay operate pure marketplaces. Tmall charges transaction fees; Taobao lets merchants pay for search prominence. Yet when it comes to serving the price-obsessed mass market through an asset-light structure, geography has produced convergence: the same thin-margin, ad-and-credit model discovered independently in Hangzhou, Singapore and Bangalore.
Once a platform makes that choice, the business model is no longer a choice. Physics and capital markets are fitting every player into the same corridor.
Reconstructions of Chinese platforms’ accounts suggest commissions plus advertising amount to roughly 4-5% of gross merchandise value for Alibaba and Pinduoduo, close to 10% for short-video marketplaces like Douyin. Pinduoduo’s EBITDA margins on GMV sit in a 0-4% band. Meesho’s prospectus puts its marketplace contribution margin at just under 5% of net merchandise value; group-wide EBITDA hovers around break-even.
Pinduoduo is further along than Shopee, and Shopee is further along than Meesho. Watching them is like watching the same company at different stages of its life. If three platforms operating under radically different regulatory regimes and competitive pressures all land on low-single-digit operating margins and a reliance on advertising and credit, a fourth is unlikely to find 15% margins through clever execution.
The feature consumers prize most is not brand or speed but low prices. Years of inflation since the pandemic have left lower-income households feeling worse off even where incomes held up. Analysts report a structural shift towards value platforms and unglamorous categories like groceries and pet supplies.
Meesho describes itself as built around “everyday low prices,” serving customers whose typical order is barely a few dollars. Average order values fell from 337 rupees ($3.75) in FY23 to 265 rupees ($2.95) in the first half of FY26. Shopee is the place for promotions across Southeast Asia. Pinduoduo built its franchise inland via group-buy gimmicks. Temu undercuts Western marketplaces by double-digit percentages.
Serving this market imposes constraints, starting with the physics of moving parcels. A basket worth tens of dollars can support fast delivery; a basket worth three dollars cannot.
Logistics accounts for roughly a tenth of order value in China and ASEAN. In India, an executive said it consumes close to a third – around a dollar per shipment where average orders are worth barely three or four.
Value-platform customers tolerate week-long deliveries, allowing networks to reorganize around long-haul batching and fewer fulfillment nodes. Meesho’s logistics arm prioritizes cost over speed. Logistics is a quasi-fixed tax on each tiny basket that ingenious routing can shrink but not eliminate.
Capital markets throws its own constraint wrench to the mix. E-commerce has passed its pandemic peak; sector valuations sit near long-run averages. China’s quick-commerce arms race is instructive: GMV could reach 1.4 trillion yuan ($198 billion) by mid-decade, nearly a tenth of physical retail. The subsidy battle dented earnings; aggregate profits at major platforms fell by more than a fifth. JD.com is modelled on net margins of 2-3% and GMV yields below 1%.
Investors have stopped paying for stories and hopes about 10-15% margins on mass-market GMV. Platforms clip a low-single-digit percentage on throughput and rely on side businesses for real profits.
Pinduoduo charges no commission on most sales, Meesho goes a step further and completely avoids commissions on sales, both instead earning via logistics mark-ups and advertising. Shopee is drifting the same way. Meesho holds no inventory, owns no brands and monetizes through logistics enablement and sponsored listings.
The structure of offline retail reinforces this. Three-quarters of Indian retail is unorganized; two-thirds of Indonesian sales are unbranded; China splits roughly half and half. In the U.S., branded chains dominate. All three platforms have grown by turning informal suppliers into formal marketplace sellers. Their core marketplaces skew to unbranded goods; their “mall” sections for brands are side-cars. Meesho’s average order values fell 20% in two years as low-ticket goods came online. About 88% of its users are outside India’s top eight cities.
Platforms aren’t able to differentiate through supply. An executive described how competitors hunt “Pareto sellers” — systematically identifying rivals’ best-selling products and onboarding those vendors. Shopsy, a Meesho-rival built by Flipkart, scouts Meesho’s top listings; Meesho does the same; Chinese platforms pick through each other’s leaderboards. Supply differentiation lasts as long as it takes to call a vendor in Surat or Guangzhou.
Algorithms offer superficial variety, to be sure, but no escape. One platform pushes new vendors to the top; another favors proven products. Both lead to identical economics. In Meesho’s case, three-quarters of orders originate from algorithmic recommendations. What matters is that the feed exists as a canvas on which suppliers pay for prominence.
Underneath sits industrial “value engineering.” An executive described how platforms achieve rock-bottom prices through systematic corner-cutting. A 200-rupee ($2.22) dress uses cheaper fabric than a 250-rupee competitor, skips the neck patch, uses single-thread hemlines; bags are glued not sewn; embroidery removed.
Consumers are noticing. Tier-two shoppers rate Meesho quality higher than Shopsy despite identical prices and suppliers, according to industry executives. But this doesn’t translate to pricing power. A platform charging 10% more for “better quality” would hemorrhage users overnight. No branded retailer can offer 200 rupees dresses while maintaining standards on stitching and compliance. A brand competing at those prices would cease to be a brand.
Advertising is the first side business that makes this viable. Sponsored listings account for 1-3% of GMV for Indian marketplaces, 4-5% for Alibaba and Pinduoduo, close to 10% for short-video platforms. The 2-3% operating margin on commerce sits atop a separate advertising business converging on mid-single-digit GMV shares.
Cheap goods and subsidized shipping attract users; recommendation engines turn browsing into an endless feed; merchants pay for placement. Goods sell at two or three points above cost. The profit comes from selling attention back to suppliers.
Credit is the second, more consequential side business. Card penetration in emerging markets is low and skewed rich. Broker reports forecast high-double-digit annualised yields on short-tenor BNPL loans after funding costs and losses.
China’s super-apps are the mature version: hundreds of millions run up BNPL balances in the commerce interface, funded by money-market funds and bank credit lines. Shopee operates growing lending books to consumers and merchants.
India is more improvised – formal BNPL is expanding cautiously, but cash on delivery functions as unofficial credit. Meesho co-founder and chief executive Vidit Aatrey told The Arc that customers prefer cash on delivery, or CoD, for its “built-in delay,” which effectively turns it into “a five-day loan.”
These platforms are ad and credit machines fronted by a marketplace. The marketplace gets users to show up; the economics live in monetising attention and balance sheets. Chinese players run embedded wallets and BNPL products. Southeast Asian platforms mix in-house lending with local partners. Meesho leans on CoD and short-tenor loans. Price-sensitive users are acquired through cheap goods; their purchases and borrowing capacity are sold to merchants and financiers.
Food delivery and instant commerce in China carry high frequency and low order values; platforms treat them as marketing, not profit centers. By 2030, food delivery could reach 2 trillion yuan; instant delivery another 1.5 trillion. Platforms lost tens of billions on these at the subsidy wars’ height — framed as customer-acquisition costs justified if they drive traffic to travel and hotels, where EBIT margins hit the high teens or low 30s.
China’s regulators balance platform profits against support for small firms. Temu faces tariff fights and de-minimis tweaks. India’s infrastructure and cash dependence make logistics unusually heavy. These matter for execution. They don’t change the maths of tiny baskets.
Indian strategists talk about a “king consumer” awakening as rates fall and wages rise. The same research caps long-run operating margins in the low single digits and assumes most profit comes from advertising and adjacencies, not retail.
Geography, income and regulation were supposed to produce three different answers. Instead they produced variations on one theme: the 3% endgame in which e-commerce becomes a thin utility layer, clipping a few points of GMV and relying on attention and credit for real profits.
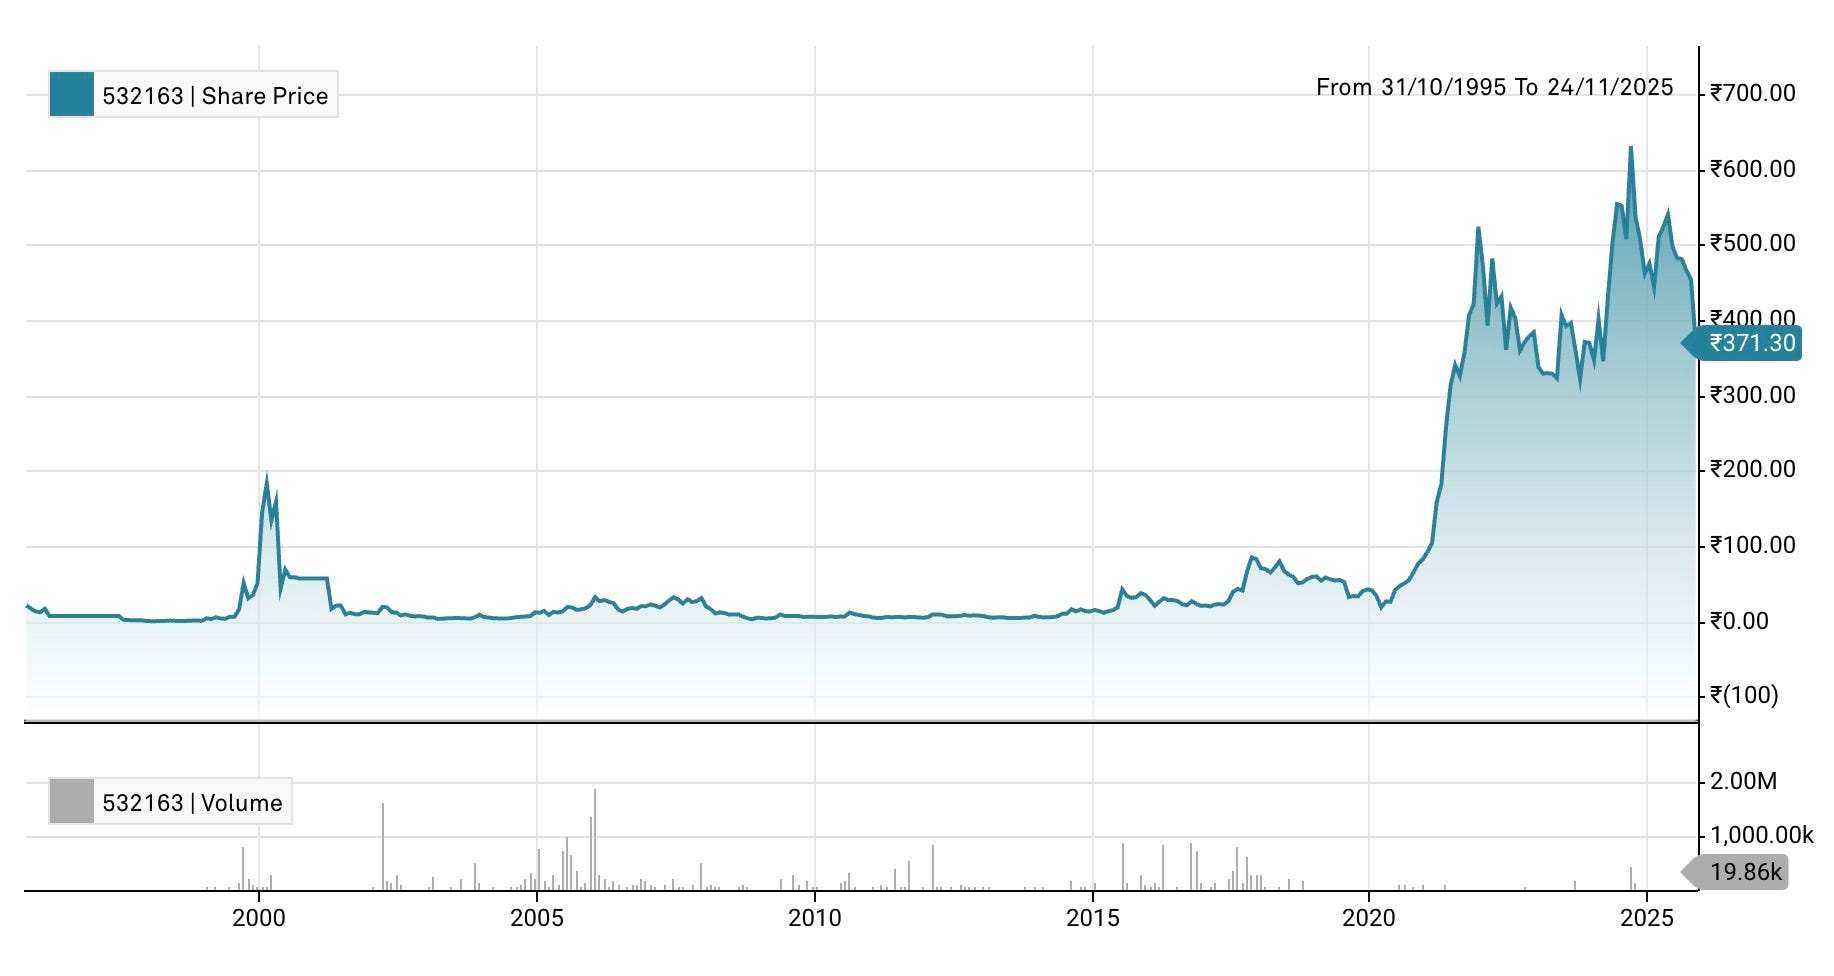
]]>The problem is that most of that IP comes from the wrong generations. Saregama owns one of the most storied music catalogues in the world – but very few songs that Indians actually stream.
The firm’s catalogue runs deep into the 1940s, 50s, 60s, 70s, and 80s – decades when HMV was the only serious music label in India and captured virtually everything worth capturing. But the catalogue thins out dramatically in the 1990s and 2000s, the precise decades when Bollywood music became the streaming-era gold that platforms and listeners actually want. Saregama drifted away from content acquisition during those years, distracted by other ventures, and let T-Series and Tips and Venus hoover up the film music that a generation of Indians now in their twenties and thirties grew up on.
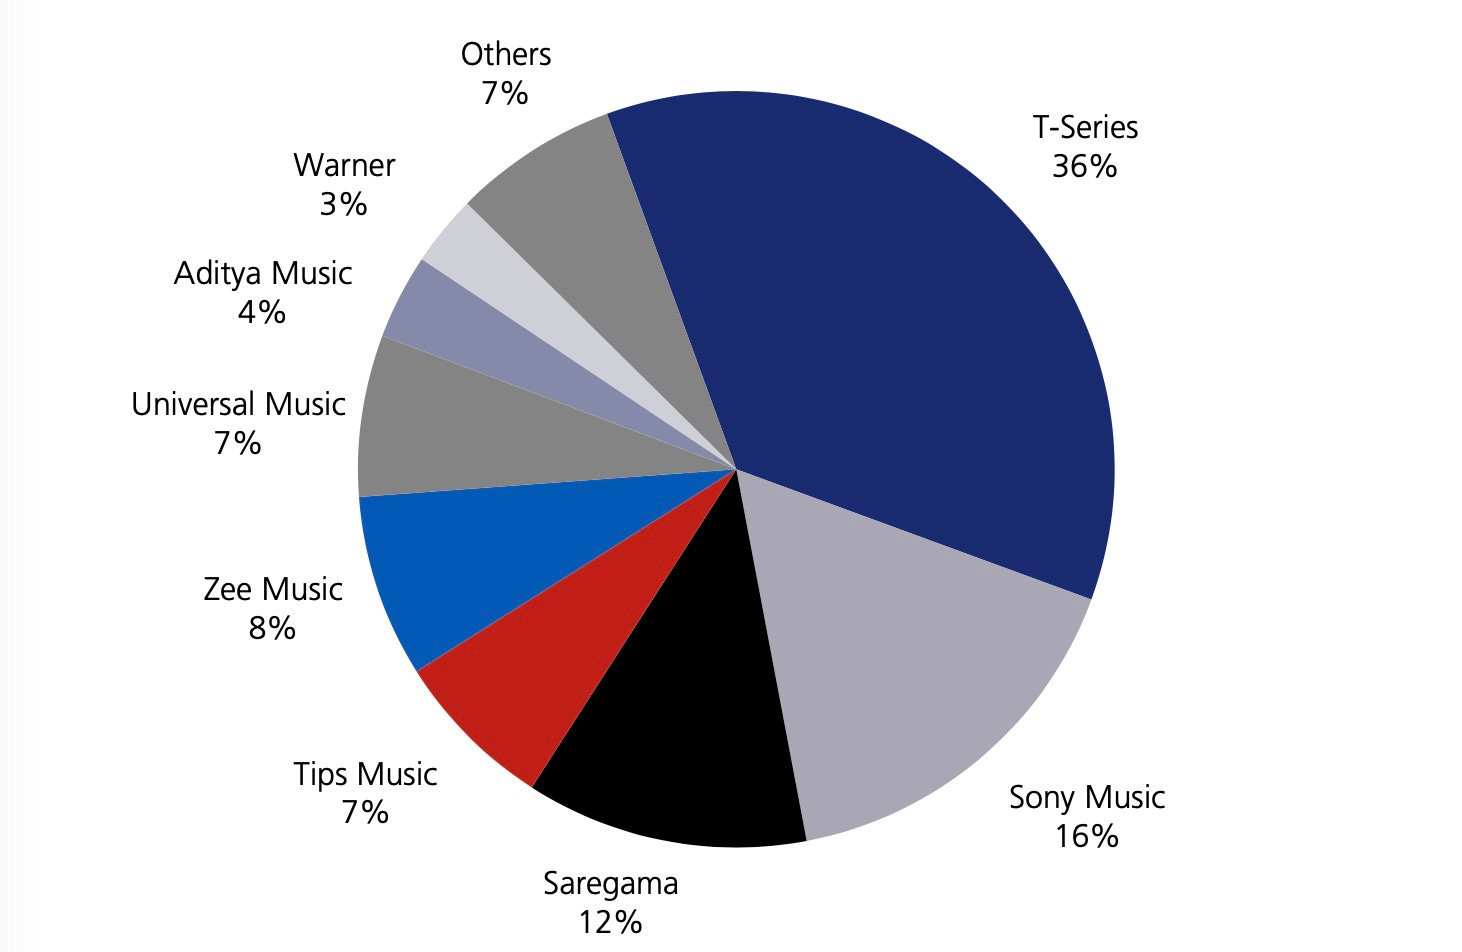
T-Series won that battle decisively. The label now controls 36% of India’s organized music market with a 200,000-song catalogue built largely on 1990s and 2000s Bollywood hits. Saregama manages just 12%.
Now Saregama is trying to fix that gap, but the market itself is cracking. The Indian music streaming market contracted 2% in 2024 after years of growth, shaken by the shutdown of Wynk and Resso and the decision by Spotify and JioSaavn to stop offering minimum guarantee deals to labels. Music companies that relied on upfront payments now face variable payouts tied to streaming performance. For Saregama, trying to build a new catalogue just as the revenue model shifts, the margin for error has narrowed considerably.
About 60 to 70% of streaming revenue for Indian music labels comes from catalogue, and the catalogue that streams is the 1990s, according to industry executives. One executive estimated his label earns 75% of revenue from recent-ish releases and only 25% from back catalogue.
The vintage stuff doesn’t stream the way you’d think. Saregama has monetised it cleverly through Carvaan, a retro portable speaker loaded with old Hindi songs that sells in appliance stores and has become a genuine hit product. Sync licensing for period films brings in serious money – over $200,000 for a 30-second clip is not unusual. But these are niche revenue streams when the main event is streaming, and streaming rewards the songs people put on repeat while commuting or cooking or working out.
The problem runs deeper than just missing the right decades. Saregama doesn’t own video rights for most of its pre-2000 catalogue, which matters enormously when YouTube accounts for half of all streaming revenue in India. T-Series runs one of the largest YouTube channels in the world. Competitors like Tips Music, which own video rights for their entire catalogue, pull in roughly 50% of their digital revenue from YouTube alone. Saregama manages only about 35%.
So the company is spending aggressively to build a new catalogue from scratch – or rather, to buy one. In recent years, Saregama has signed exclusive deals with film production houses, acquired a new-age storyteller, bought regional labels like NAV Records (thousands of Haryanvi tracks backed by the legendary Sonotek), locked up independent artists on 360-degree contracts and pushed hard into Telugu, Tamil, Punjabi and Bhojpuri.
The catch is that content acquisition in Indian music is a miserable business. If you buy the music rights to ten Bollywood films, one or two tend to recoup within a year. Another two or three break even in three to five years. The rest take six years or longer, bleeding slowly into profitability through the “long tail” of catalogue streaming that never quite stops, people familiar with the situation say. Labels try to hedge by pre-selling 50 to 60% of the acquisition cost through licensing deals before they even buy, but that still leaves 30 to 40% riding on whether the songs become hits.
Saregama depends almost entirely on third-party producers for new film music – the most valuable and hardest to acquire content in India. Tips Music, by contrast, has guaranteed access to roughly 35% of its content pipeline through Tips Films, a promoter-linked entity, another 30% through direct collaboration with independent artists, leaving only 35% exposed to the brutal auction dynamics of the open market, according to JM Financial. When content costs are rising and quality content is scarce, guaranteed access matters. Tips Music committed to investing 25-30% of annual revenue in new content acquisition precisely to avoid losing relevance in a market that moves quickly.
Then there is the issue with accounting. Saregama capitalizes content costs and amortizes them over ten years, which smooths reported earnings but masks the underlying cash drain. The approach creates a balance sheet weighed down by unamortized content that may or may not pay off. Tips Music expenses content costs immediately – 100% in the quarter of release. The more conservative approach produces cleaner books but demands stronger cash generation to keep the content engine running.
Revenue concentration makes the stakes even more punishing. A single chartbuster can add 5 to 7% to a label’s annual revenue. A chartbuster album — multiple hits from one movie — can swing revenue by 15 to 20%. So if you miss a year of hits, the whole P&L tends to suffer, and hit-making is getting harder. Five years ago there were more chartbusters; today the industry produces fewer breakout songs even as it releases more music than ever.
Saregama has tried to build moats beyond just owning songs. The company now manages artists directly, signing them to contracts that cover recordings, live performances, brand endorsements and career development. The pitch to talent is access to film placements — still the ultimate aspiration for Indian musicians — and the infrastructure to handle everything from legal work to PR to tour logistics. Other labels outsource live events to agencies; Saregama keeps it all in-house on the logic that whoever controls show bookings controls artist loyalty.
Live events themselves run on 6 to 9% margins, barely worth doing as a standalone business. Saregama does them anyway because working with an artist like Diljit Dosanjh on a national tour cements the relationship, generates PR and creates slots for up-and-coming Saregama artists to open. Diljit tours internationally in markets where Universal and Warner dominate, but he works with Saregama because of relationships built over years.
None of this changes the underlying streaming economics in India, of course, which remain stubbornly ad-supported. Insiders estimate that 80% of label revenue from digital platforms comes from advertising, only 15 to 20% from subscriptions. YouTube alone accounts for 50 to 60% of total streaming revenue; Spotify, Apple Music, Amazon, Saavn and Gaana split the rest. YouTube Music and Spotify have about 8 to 10 million paid subscribers each, according to industry insiders.
To be sure, labels have protected themselves through minimum guarantees. When Saregama licenses its catalogue to Spotify or YouTube, the platform pays upfront for two or three years of streaming, covering both free and paid tiers. If actual streaming exceeds the guarantee, Saregama gets more; if it falls short, the guarantee holds. India’s failure to convert listeners into subscribers becomes mostly Spotify’s problem, not Saregama’s. But even these deals are disappearing as platforms reassert leverage.
What Saregama cannot escape is the long payback on its acquisition spree. The company is buying content now that won’t generate meaningful catalogue revenue until the early 2030s at best. The bet is that Indians in 2032 will stream the hits of 2025 the way Indians today stream the hits of 1995-2010. Saregama missed one catalogue cycle and is spending heavily to catch the next one. Whether it works depends on hit rates that nobody can forecast, on artist relationships that must be maintained for years, on regional markets that are growing but remain fragmented, and on an Indian consumer who has never shown much willingness to pay for music.
The company’s famous old catalogue — Rafi, Lata, Kishore, R.D. Burman — is a heritage asset that earns its keep through hardware products and sync deals. The streaming future appears to belong to whoever owns the right songs from the right decades. Saregama is still buying its ticket, and the seats are getting expensive.
]]>The aggregate statistics in pitch decks and policy keynotes describe the reality of a thin upper crust rather than the typical household. India is not a single unified marketplace, or even two marketplaces, but a stack of as many as nine distinct consumer economies separated by gaps wide enough to make national averages practically useless. Getting this right matters for anyone trying to understand where Indian consumption is actually headed.
A recent CLSA report, ostensibly about stock picking, includes a methodology that maps this fragmented population in unusual detail. It stitches together income-tax filings, rural wage data and employment records from the EPFO and NABARD’s All India Rural Financial Inclusion Survey, then cross-references these against census and MoSPI figures, MGNREGA rolls and asset-ownership indicators such as cars, two-wheelers, ACs, washing machines and smartphones.
It then swaps rupees for time, arguing that the true measure of affordability is the number of hours one must work to buy anything from a bar of soap to a holiday. India, hence, becomes a collection of distinct groups whose economic realities bear almost no relation to one another, where a quick-service meal or a streaming subscription costs minutes of work for some households and hours of toil for others.
At the urban apex sit the “wealthy” — large business owners, senior professionals, senior government officials and top executives with gross household incomes above ₹10 million (~$113,000) — flanked by the urban affluent on ₹1.2–10 million, a group that includes midsize business owners, professionals, corporate executives, senior government employees (Group A), senior IT services staff and college professors.
The ladder descends through the urban emerging cohort of mid-level professionals, regular salary earners, small business owners and Group B government employees on ₹0.5–1.2 million, down to the urban mass of regular wage earners, Groups C and D government staff, entry-level IT workers and microbusiness owners on ₹0.2–0.5 million ($2,250-$5,650), and then to the urban blue-collar cohort of daily wage labourers, part-time factory workers, gig workers, migrants and other non-skilled workers on under ₹0.4 million.
On CLSA’s FY25 numbers, that translates into average annual household incomes of about $3.4 million for the tiny urban wealthy cluster, roughly $50,000 for the urban affluent, $13,600 for the urban emerging, $5,400 for the urban mass and $4,400 for the urban blue-collar group.
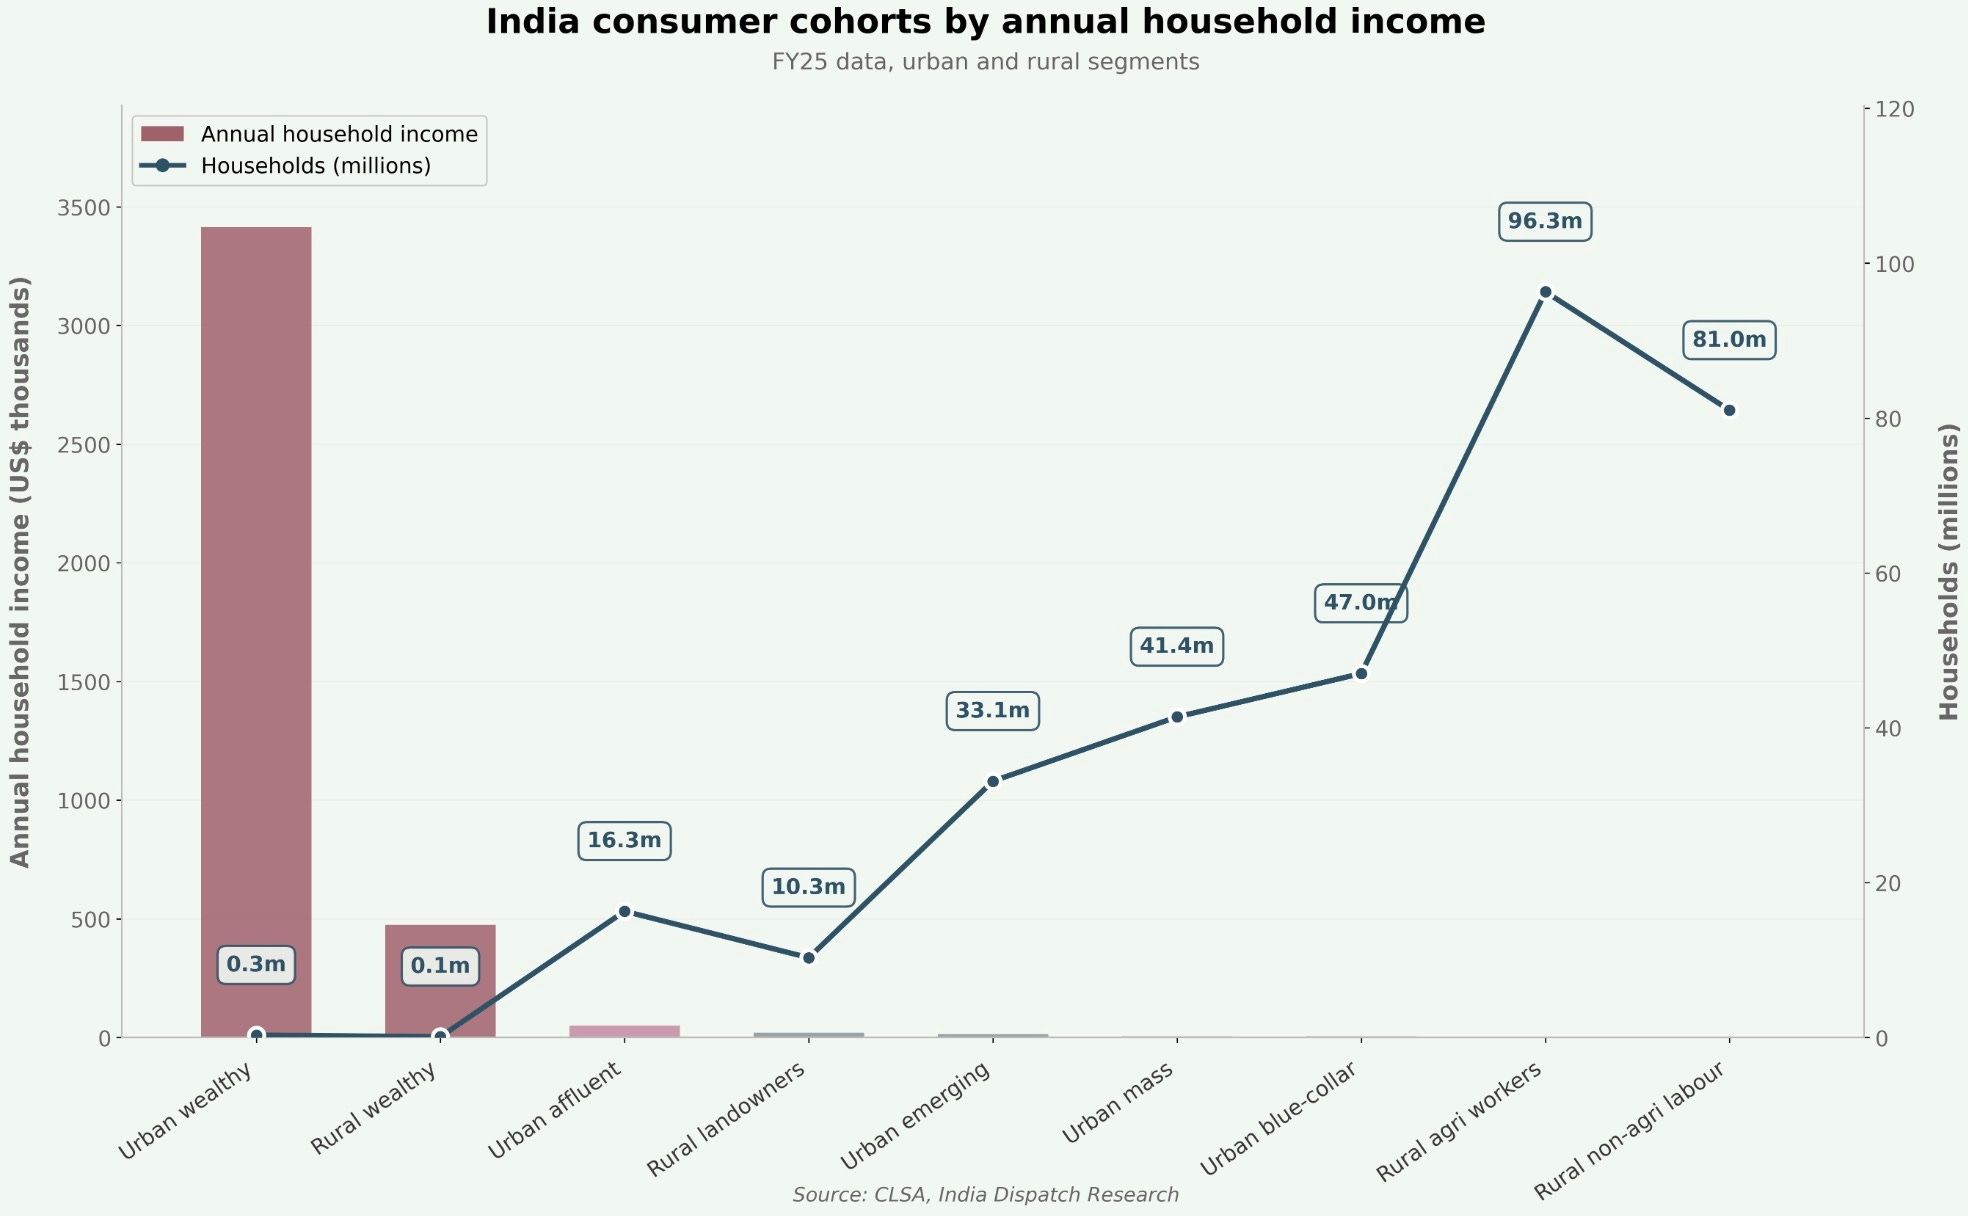
India’s 325.8 million households earned an average of about $10,600 in fiscal 2025, but that blended figure masks a sharp urban-rural split: the 138.1 million urban households already earn around $20,100 on average, while rural households manage on roughly $3,600. CLSA projects that by fiscal 2035 the number of households will rise to 381.6 million and average income to about $18,400, with urban households reaching roughly $30,500 and rural ones about $5,700, so the absolute gap in living standards remains wide even as incomes rise at both ends.
Today, the three highest-earning urban cohorts — wealthy, affluent and emerging — make up only about 15% of Indian households but already command roughly 68% of the total income pool; by fiscal 2035 CLSA expects them to represent close to a quarter of households and about 77% of national income. For rural agricultural and non-agricultural workers, incomes also rise but from a much lower base and without a comparable shift in economic status.
States such as Maharashtra, Karnataka, Tamil Nadu, Delhi and Gujarat have far higher levels of organised employment and asset ownership, so the more prosperous urban cohorts cluster disproportionately in a handful of city-regions rather than spreading evenly across the country.
The behaviour and expansion of these cohorts have a direct implication for India’s consumption story. For consumer brands, the practical addressable market over the next decade is less “1 billion Indians” than a set of dense urban corridors whose income pools, in CLSA’s mapping, already resemble entire economies such as Brazil, South Korea, Switzerland or Sweden rather than the national average.
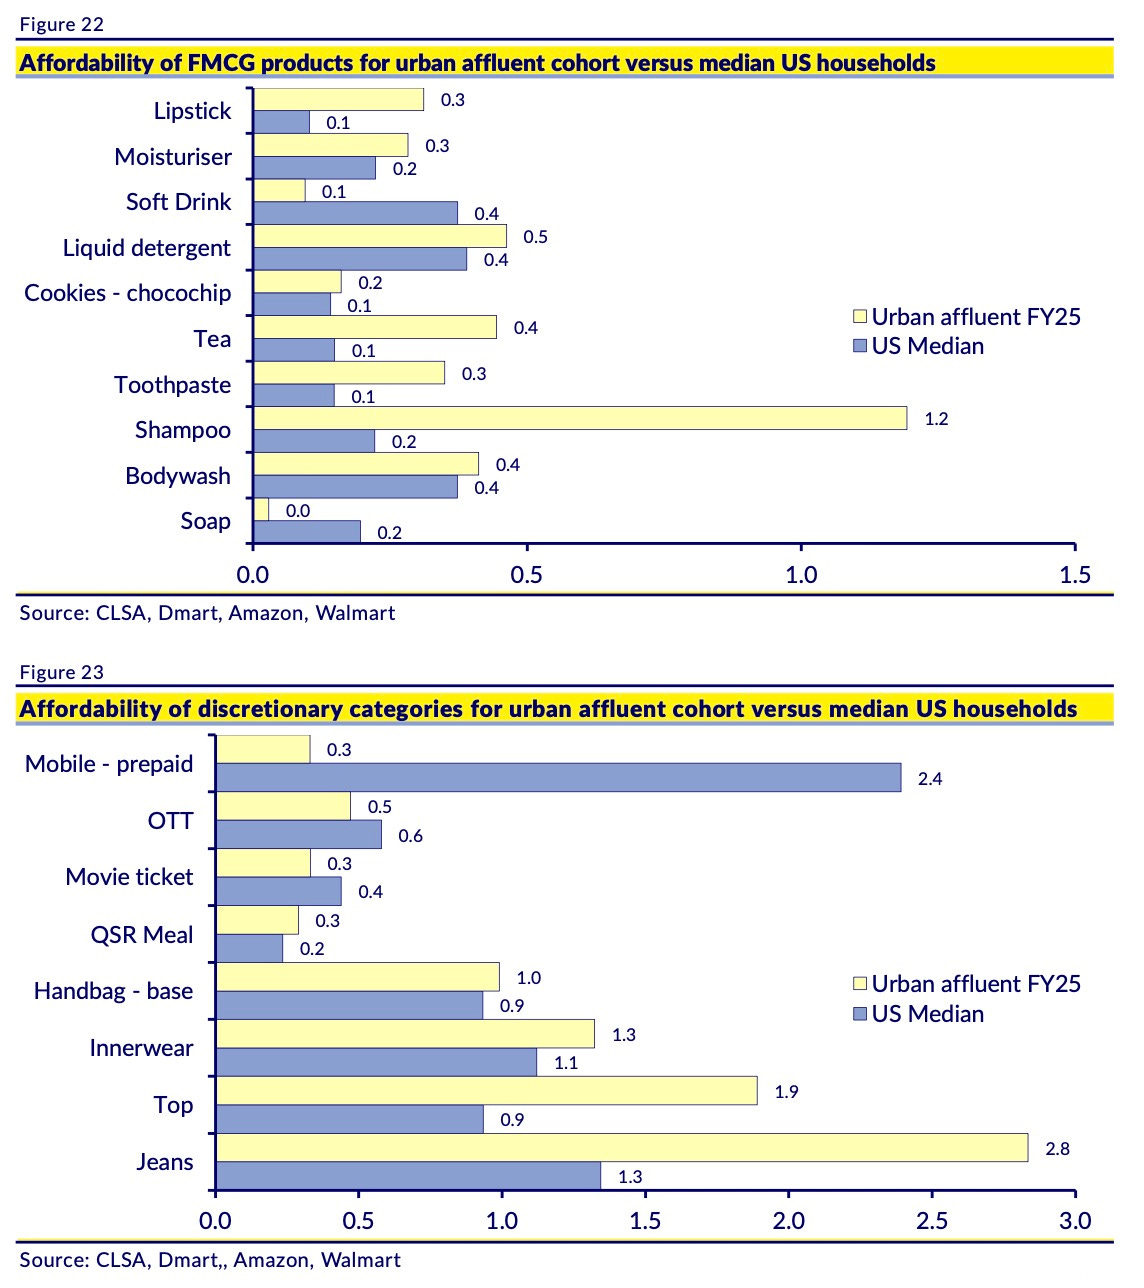
When you measure prices in hours worked, CLSA’s affordability analysis shows each cohort inhabits a different universe. For urban affluent households, staples such as soap, shampoo, tea and biscuits consume only small fractions of a working day, comparable to households at similar income levels in developed markets, while apparel, electronics and cars still demand far more time because of local pricing structures and duties. For the urban emerging and mass cohorts, the hours-worked burden across categories looks closer to that of middle-income Asian economies, and for the rural worker cohorts spending remains heavily skewed toward basic food and essentials. The barrier to shifting from a one-time trial of a product to a weekly habit is not just the sticker price but the amount of working life that has to be traded to acquire it.
India has the world’s largest Gen Z population — digitally native cohorts whose consumption habits differ sharply from those of their parents — but the demographic promise is running into a labour market too narrow to absorb them. Excluding the pandemic year of fiscal 2021, EPFO records suggest only about 3.6 million new formal jobs have been created annually over the past five years, a trickle compared with the flow of graduates entering the workforce. Indian colleges produced an average of 6.8 million undergraduates a year between fiscal 2018 and 2022, including 3.6 million women, plus around 1.6 million postgraduates, while another 16–17 million students finished secondary school and 12–13 million completed high school. This creates a clear gap in the funnel between organised employment and qualified manpower, with a rising share of young workers pushed toward lower-paying informal or gig roles.
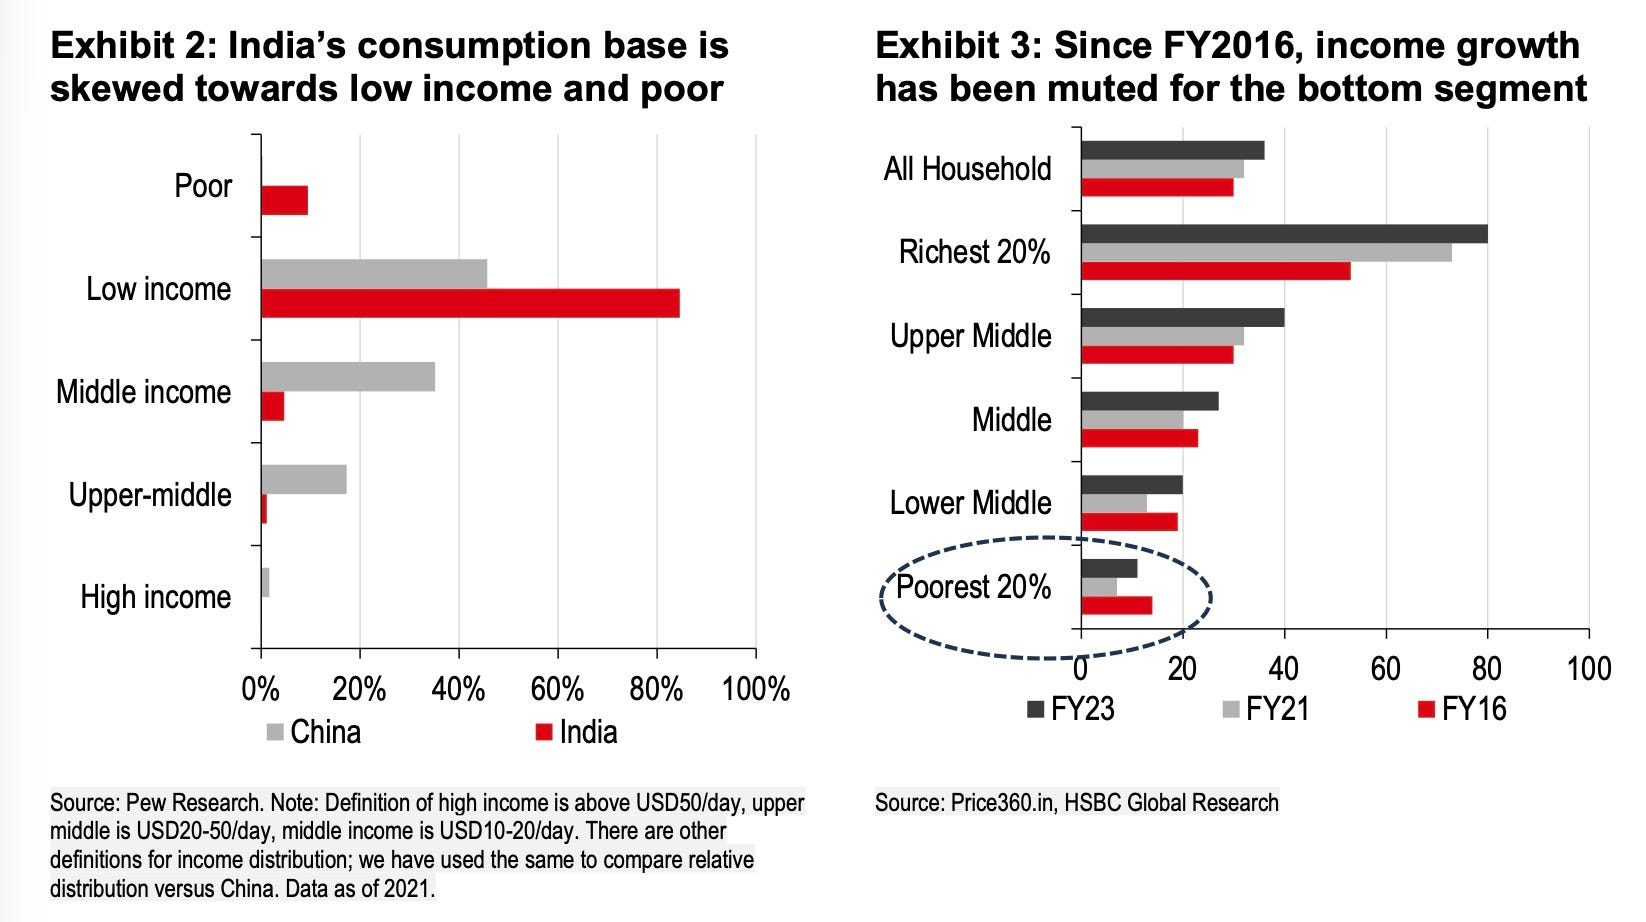
Separate analysis by HSBC shows that real rural wages have been broadly flat since the mid-2010s and that income growth for the bottom bands has lagged the higher cohorts, which is exactly what you would expect in an economy creating too few good jobs relative to its supply of educated workers.
The bottleneck places a hard ceiling on wage growth for the lower tiers, where annual income growth for the urban mass and urban blue-collar cohorts is projected at a tepid 3.5-4.0% between fiscal 2025 and 2030 before tapering to about 3% through 2035. Rural workers may see slightly faster growth of 5.0-5.5% annually for agricultural and non-agricultural labour households, but the size of these cohorts is expected to stay flat as urbanisation drains the countryside. Any corporate strategy betting on high-teens volume growth from low-income segments is, implicitly, a wager on the job machine suddenly accelerating — a bet the current employment data does not support.
That tension is already visible in the sales lines. HSBC notes that blended FMCG volume growth has been unusually muted since fiscal 2021, and that rural demand in particular has been patchy despite repeated price cuts and promotions, because household budgets never received the wage lift implied by headline GDP.
To keep the wheel turning, policy has started leaning more directly on household balance sheets. Bank of America estimates that recent changes in personal income tax, GST and deposit rates together free up on the order of ₹2.5–3.0 trillion (~$30 billion) of spending power over a couple of years, while HSBC reckons that the combined effect of income-tax tweaks, GST cuts and repo-rate reductions amounts to roughly 2-3% of private consumption and up to 8% of the addressable market for listed discretionary and staples companies. In practice, that fiscal and monetary push flows mainly through the same relatively narrow band of solvent, urban taxpayers.
Households that do manage to climb into the middle and upper brackets follow a predictable pattern, where food and non-alcoholic beverages, which currently devour about 30% of the average Indian household budget, get steadily displaced by transport, insurance, beauty, personal care, healthcare, housing, hotels, catering and leisure. Historical data from China and the US confirms this, and the analysis treats these shifts as the “genetic” architecture of future profit pools, assuming that where richer peers spend most as they move up the income ladder is where India is likely to follow.
Compare India’s current per-capita consumption to China, Vietnam and the Philippines and the categories with room to grow become obvious. Alcoholic beverages, energy drinks, baby food, flavoured milk drinks, liquid detergents, colour cosmetics and pet food are all so far below regional peers that catching up would require double-digit compound annual growth for a decade or more, while staple categories like edible oils, tea, sweet biscuits, milk and simple soaps already look mature, with convergence implying flat or even negative volume growth as consumers trade up to healthier oils, premium snacks and more specialised cleaning products.
The fast-growing urban affluent cohort already lives this future, with disposable incomes around $50,000 today and budgets heavily allocated to categories such as education, health, housing, transport, leisure and recreation. On CLSA’s comparative charts, their income and spending mix resembles the middle classes of richer economies such as South Korea or Brazil, and for them the hours-worked affordability curves suggest that most FMCG goods already cost trivial fractions of a working day. The question is no longer whether they can afford a shampoo upgrade but whether a brand can capture their attention and persuade them to adopt a particular format or habit often enough to matter.
The urban emerging and mass cohorts face a more delicate calculation. Their affordability for many everyday categories looks similar to middle-income Asian peers in CLSA’s dataset, but discretionary items such as electronics, vehicles and travel still demand many more working hours than they do for richer cohorts, and for poorer rural segments affordability rarely extends beyond staples. Households graduating into the urban mass and emerging bands will gradually adopt the consumption patterns of middle-income Asia, but only as fast as job creation and wage growth allow, which means mass-market brands that depend on constant uptrading and high-frequency purchases across these cohorts are ultimately hostage to the formal employment cycle.
The next decade of Indian consumption therefore centres on a relatively small but rapidly expanding set of urban consumers reallocating their budgets from basic staples toward non-alcoholic drinks, beauty and personal care, healthcare, appliances, hotels and catering, leisure and recreation. For the urban affluent and wealthy, these categories grow fastest as income rises; urban emerging households move more slowly but in the same direction. Even in 2035, urban emerging and affluent households will still be a minority of India’s roughly 380 million households, but together with the urban wealthy they will dominate the incremental income pool, which is what ultimately determines where profit growth comes from, while the mass and blue-collar cohorts face a slower climb because the formal job engine is not keeping pace with the educational pipeline.
India is simultaneously a poor country and a collection of mid-income economies, the boundary between them shifting in measurable ways. The shorthand of 1 billion people at $2,400 per head is misleading because a small, wealthy cluster pulls the average up, while for 90% of Indians incomes hover closer to $900, held down by the slow pace of formal job creation and modest wage growth in the mass and rural cohorts. For a smaller, rapidly expanding urban cluster, incomes and tastes are converging toward those of rich countries as budgets shift from sustenance to services, comfort and self-expression.
India contains Switzerlands, South Koreas and Brazils nested within a much poorer nation, their locations, age profiles and hours-worked affordability now mapped in far more detail than any headline GDP figure can offer. Arguments about everything from tax policy to infrastructure to urban planning can, in principle, be judged on which cohorts they help and how many people they move from one band to another.
]]>India houses about 101 million diabetics and approximately 350 million people living with obesity. Anti-obesity drugs have become the fastest-growing therapy in the Indian pharmaceutical market, and GLP-1 revenues are projected to surge from roughly $147 million in fiscal year 2026 in India to approximately $1.42 billion by fiscal year 2031, according to Goldman Sachs, driven by a 40-fold increase in volumes.
Patent expiry for semaglutide, the active ingredient in both Wegovy and Ozempic, in March 2026 is expected to trigger India’s familiar generic manufacturing cycle. At least ten local producers are expected to enter the GLP-1 supply chain by next year, Novo Nordisk executives said at a recent conference. Between 10 and 15 million Indians will likely be taking GLP-1 drugs by fiscal year 2029, UBS projects, including 4 to 6 million using them specifically for weight loss rather than diabetes management. Indian generic versions will cost 90 to 95% less than American prices, industry executives say.
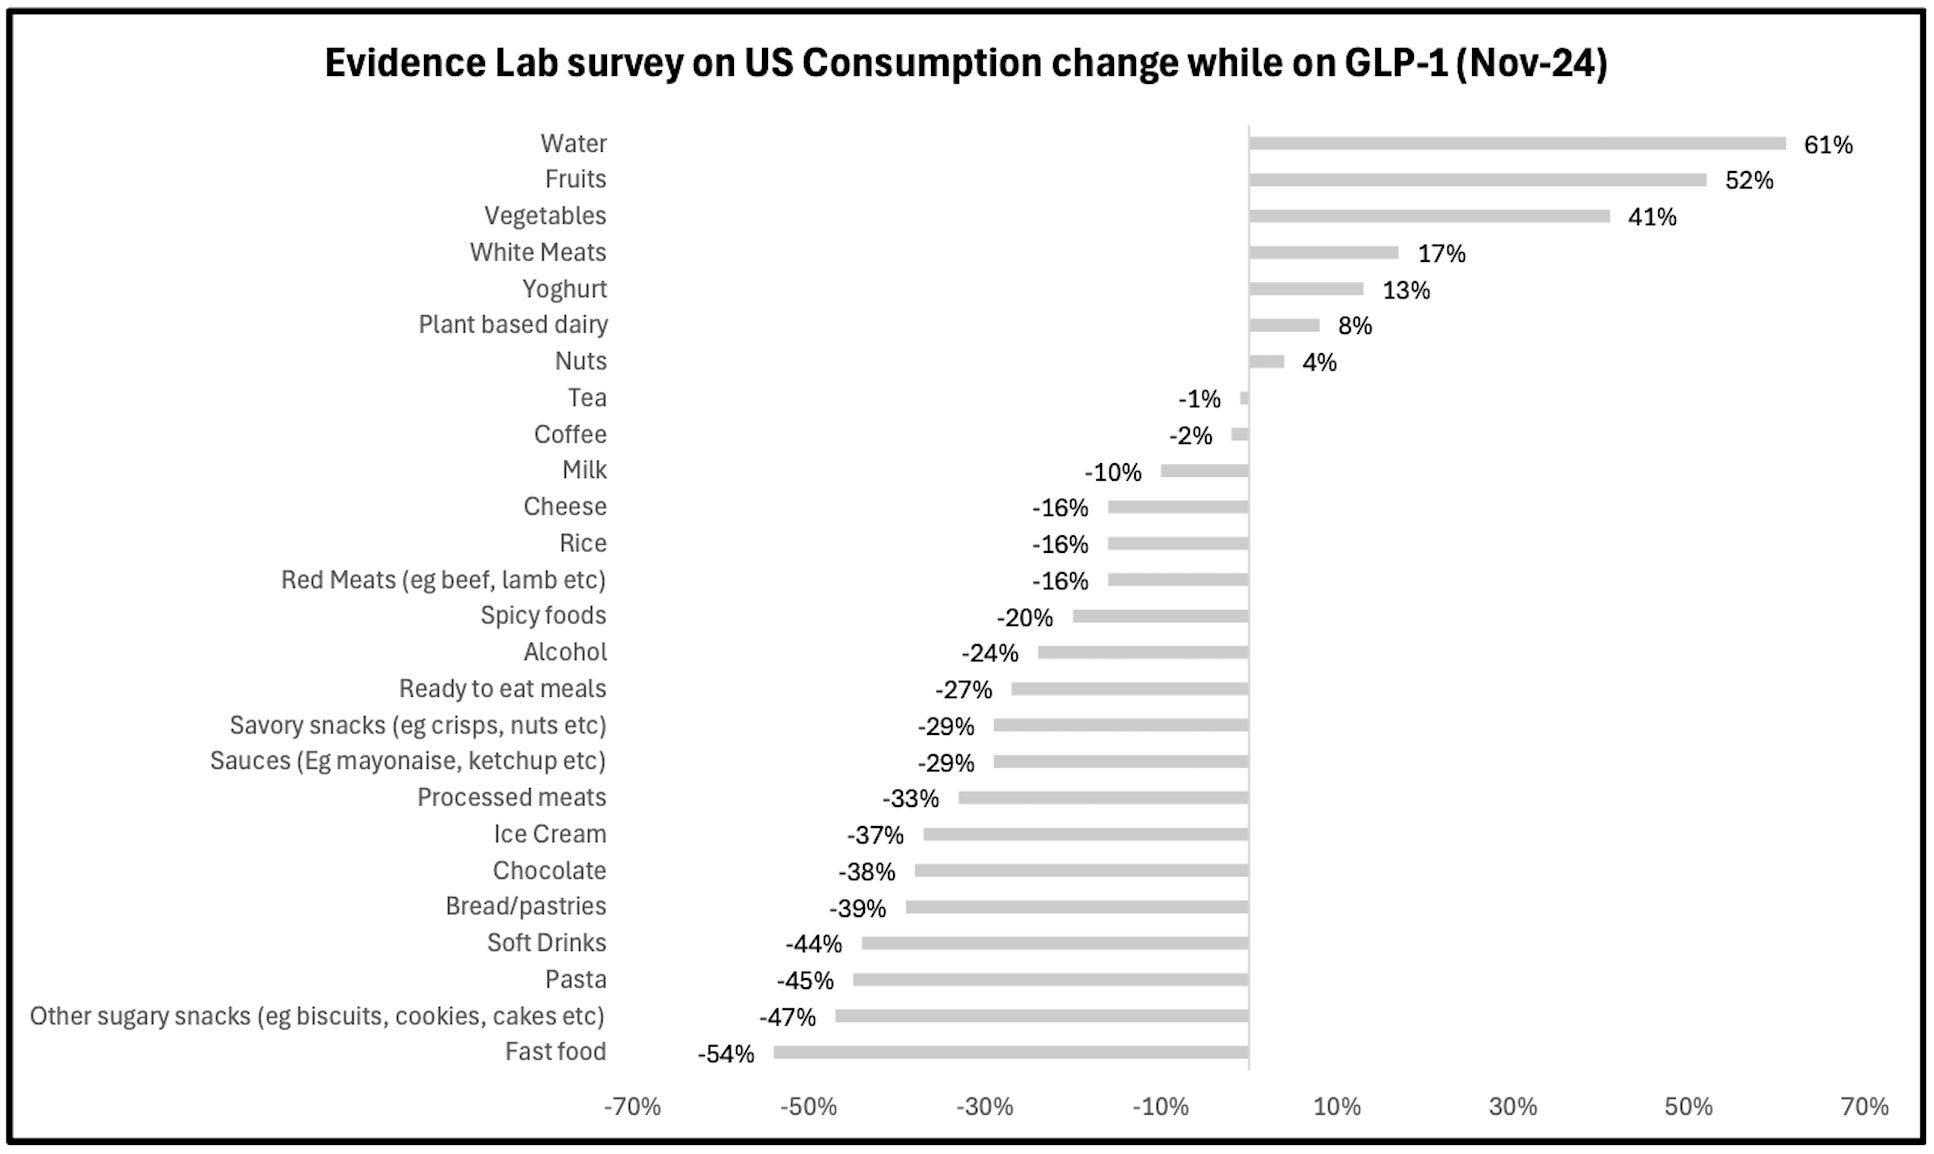
American GLP-1 users cut daily intake between 250 to 800 calories, or a tenth to a third of average adult consumption, concentrating reductions on fast food, sugary snacks, fizzy drinks and alcohol. Households with at least one GLP-1 user reduced grocery spending by 6% within six months of starting the medication, according to research from Cornell University and consumer insights firm Numerator covering 150,000 American households. Higher-income households reduced spending by 8.2%.
Dining patterns have also shifted measurably. Fast-food restaurant visits dropped 8.6% while breakfast declined 4% and dinner fell 6%. Purchases of baked goods dropped between 6.7 and 11.1%. Savory snacks declined 11%. Snacking frequency among GLP-1 users fell 58%. Over 60% of users reported visiting restaurants less (PDF) or much less frequently since starting the medications.
Analysis of US packaged food companies estimates that widespread GLP-1 adoption would reduce annual industry growth by 20 to 30 basis points overall and 30 to 35 basis points in high-sugar and high-carbohydrate categories, accumulating to roughly 145 basis points of cumulative drag by 2028.
India’s consumer internet model amplifies this risk because digital platforms sit atop the exact consumption categories most vulnerable to GLP-1 disruption. American exposure spreads across restaurant chains and beverage manufacturers, but Indian exposure clusters in Zomato, Swiggy and quick-commerce operators. The typical GLP-1 patient is affluent, urban and digitally savvy, a profile that closely matches the heaviest users of food delivery platforms who generate the highest frequency, largest tickets and best margins through premium categories and branded snacks purchased via quick commerce.
GLP-1 drugs could reduce long-term volume growth by 1 to 2% for companies including Jubilant FoodWorks, Varun Beverages, Nestlé India and Britannia due to their calorie-dense product portfolios, UBS recently warned clients in a note. Each percentage point of volume at risk translates to 7 to 10% of market value for quick-service restaurants, while food delivery platforms face even steeper decline because they amplify consumption patterns in these categories. A 1% change in long-term volume growth can shift platform valuations by 2 to 3%.
In the US, Nestlé has become the first major consumer packaged goods company to launch products specifically designed for GLP-1 users through its Vital Pursuit frozen meals and Boost Pre-Meal Hunger Support drinks. The moves came after companies began reporting measurable impacts. Walmart chief executive Doug McMillon told investors late last year that the retailer was experiencing margin pressure from GLP-1 growth. Around the same time, Kraft Heinz projected organic sales would decline between 1.5 and 3.5% during fiscal year 2025, something it partially attributed to reduced consumption among GLP-1 users.
Food delivery growth has already decelerated below 20% in India as app-based ordering matures, leaving platforms dependent on geographic expansion, premiumization and grocery sales for momentum. Gross order growth is projected around 17 to 18% going forward, and once GLP-1 generics arrive, sustained growth above 20% will become difficult. Affluent urban Indians reducing consumption will disproportionately withdraw demand from digital channels rather than physical kirana shops because their discretionary calories flow through apps rather than neighborhood stores.
Top executives at Indian firms say they have not seen any discernible impact on orders or basket composition yet and consider the topic too early to judge. The immediate headwinds they discuss remain conventional: weak rural demand, election disruptions, an unusually wet monsoon and ongoing negotiations over discounts and take rates.
To be sure, behavioral constraints may limit adoption speed more than chemistry or pricing in India. Doctors in the country rarely treat obesity as a disease, cultural norms discourage patients from seeking treatment and medical education around GLP-1 drugs remains inconsistent across the country. That’s why only low single-digit penetration of the addressable population is expected by the early 2030s despite dramatic price reductions and India’s massive disease burden.
American adoption provides some reference case, nonetheless. Usage doubled from 5.8% of adults in February 2024 to 12.4% by mid-2025, according to Gallup surveys, corresponding to a decline in the national obesity rate from 39.9% in 2022 to 37% in 2025. Morgan Stanley projects approximately 24 million Americans will use GLP-1 drugs by 2035.
In scenarios where GLP-1 adoption reaches only a few percent of the obese and diabetic population by the early 2030s, India’s per-capita calorie consumption could decline by approximately half a percent annually for several years, according to Bernstein, concentrated in restaurant food, packaged snacks and sugary beverages rather than home-cooked meals.
India’s decade of consumer internet growth transformed urban eating habits into platform profits through tens of millions of smartphone taps. Cheap weight-loss drugs won’t destroy that model but will thin it at the margins that matter most for valuations. The wealthiest users who order most frequently and spend most generously are the same demographic most likely to inject or swallow their way to smaller appetites.
The structural growth investors model for food delivery becomes incrementally thinner each year while profit pools in GLP-1 manufacturing and pharmaceutical exports become correspondingly fatter, turning India into both a major consumer and supplier of the drugs reshaping global food consumption.
]]>At 230 times earnings, investors are paying the equivalent of more than two centuries of today’s profits before accounting for any discount rate.
Under a 20-year scenario, and that’s saying something, Lenskart would need to grow earnings by 26% annually for the first decade and 18% for the second decade, producing roughly a 50-fold increase in profits. Most investors price in growth over 5-10 years at most. Even during periods of peak market enthusiasm, multiples above 100x are rare and typically signal speculative excess.
Investors buying Lenskart at this valuation are paying today for what the company might become two decades from now.
Lenskart reported profit after tax of $33.5 million for the fiscal year ended March 2025. This figure includes a one-time non-cash gain of $18.8 million from an acquisition liability adjustment. The operational profit stands at approximately $14.6 million on revenue of $750 million, producing a margin of 1.95%. The company turned profitable in FY25 after losses in the prior two years.
Under a (still very generous) scenario where profits grow 50-fold over 20 years, Lenskart would need to grow operational profit from $14.6 million to $730 million. Even under that heroic scenario, it would require revenue of $37.4 billion.
The Indian eyewear market stood at $8.88 billion in FY25, according to consulting firm Redseer, which was commissioned by Lenskart to prepare a market study for the IPO prospectus. Redseer projects the market will grow at 13% annually to reach $102 billion in 20 years. Lenskart currently holds between 4% and 6% of the market and would need to capture roughly 37% of the projected market to hit the required revenue target.
Titan, which also sells eyewear in India, said this week it pegs the Indian eyewear market at roughly $3.4 billion today, growing between 7% and 8% annually. The company expects the market to reach about $5 billion by 2030.
A $3.4 billion market growing at 7.5% annually would reach approximately $14.5 billion in 20 years. Lenskart needs $37.4 billion in revenue to justify its valuation at current margins.
Under Titan’s market size estimates, Lenskart would need to capture more than 250% of the total market. Under Redseer’s projections, Lenskart would need to command 37% of the Indian eyewear market two decades from now.

But Lenskart isn’t the real issue. Its valuation sits at the extreme end of a market where elevated multiples have become standard.
Lenskart will not be alone on the Indian stock exchanges if it commands that multiple. There are 58 companies listed on the National Stock Exchange of India with price-to-earnings ratios over 230, according to an analysis by India Dispatch. More than 180 companies trade at multiples higher than 100, compared to about 80 on the New York Stock Exchange.
Indian stocks aren’t cheap by any measure. Right now, they trade at 25.5 times their earnings. To put that in context, when you look at decades of data on Indian stock valuations, the current multiple is higher than 87% of all historical readings. The historical average is 19.5 times.
Against other developing economies, India trades at a significant premium. The MSCI Emerging Markets index — a collection of stocks from countries like China, Brazil, South Korea, and Taiwan — trades at much lower multiples. India’s stocks are priced roughly 50% to 60% higher than this broader emerging market basket, compared with a typical premium of about 30%.
India also trades rich compared with its own history. The price-to-book ratio, which measures what investors pay relative to a company’s net assets, stands at 3.6 times versus a historical average of 3.1 times.
But here’s the thing. India’s growing weight in global indexes suggests investors are willing to pay up. Indian stocks now represent over 2% of the MSCI All Country World Index, a benchmark tracking stocks across developed and developing nations. Two decades ago, India’s weight was less than 0.5%.
In private conversations, investors and analysts argue that the premium makes sense. India has achieved something rare in emerging markets: high growth combined with falling volatility in both inflation and economic expansion. The government has consolidated its finances while the economy has reduced its dependence on imported oil. Perhaps most significant, Indian households are moving bank deposits and savings from property into stocks, a structural shift that creates sustained demand even at elevated prices.
India also offers high long-term growth potential due to low household penetration of discretionary products. When per-capita income grows, most categories from automobiles to healthcare to insurance to consumer durables could see sustained growth for many years. High long-term growth in discounted cash flow models translates to high price-to-earnings multiples.
Return ratios in India exceed those of most other major markets across sectors like automobiles, consumer staples, insurance, hospitals and banks. For automobiles, reinvestment rates and working capital requirements are lower in India. For consumer companies, return on equity is higher due to pricing power and distribution strength.
Domestic demand for financial assets exceeds supply. Less than 8% of financial investments of an Indian household are in the stock markets. In the U.S., this figure has risen to 35% at peak periods. The limited participation means more money continues to flow into equities as household wealth grows. Even China A shares command higher valuations than H shares due to higher domestic ownership. The impact becomes more pronounced when considering the low free float of Indian stocks. Average free float in India stands at only 44% compared to 67% for peers.
The final factor relates to perceived risk. Valuations factor in the earnings potential of an asset and its cost of equity. Cost of equity depends in part on the sovereign rating of a country. For India, HSBC believes the perceived risk is lower than sovereign ratings suggest. India has rarely been impacted by a sharp macro crisis, unlike many other large economies. The regulatory regime in India has been proactive in preventing economic bubbles, excluding small cycles like ILFS in 2018 and unsecured lending issues in 2008-10.
India’s structural advantages are real, and they support a market premium. But a market trading at justified premiums can still host individual valuations that make no sense. Maybe India deserves to trade richer than other emerging markets. It can also be true that a 230x multiple on a company requiring 250% of a market is detached from any reasonable outcome.
]]>India’s e-retail market is projected to grow to $174-214 billion in gross merchandise value by fiscal 2030 from a current base of $70 billion in fiscal 2025, per consulting firm Redseer, driven by a shopper base of 250-270 million online citizens. The bulk of growth emanates from tier-two and beyond regions, which are projected to account for 51-52% of the e-commerce market by fiscal 2030, up from around 44% in fiscal 2025.
Flipkart and Amazon’s displacement is coming from two directions simultaneously.
In urban India, quick commerce firms like Eternal-owned Blinkit, Swiggy’s Instamart and Zepto are increasingly conquering consumption by promising deliveries within 10 to 15 minutes through neighbourhood “dark stores,” small depots optimised for hyperlocal fulfilment. These were not traditional e-commerce players but companies that grew from food delivery platforms or launched specifically for instant grocery delivery.
In smaller cities, towns and villages, Meesho, a 10-year-old marketplace backed by Peak XV, Meta and SoftBank, quietly built dominance while the giants fixated on metropolitan shoppers. The startup tapped into a pattern long established in Indian physical retail, where value-focused chains like DMart and Vishal Mart have thrived by serving price-conscious consumers in tier-two and tier-three cities.
DMart, founded in 2002, built a retail empire by offering everyday low prices and maintaining lean operations, a strategy that allowed it to profitably serve markets that organised retail had largely ignored. Meesho applied similar principles to e-commerce, recognising that India’s vast interior required a fundamentally different approach than the models designed for affluent urban consumers.
Meesho’s current success came only after multiple pivots. The platform started as an online shopfront for small sellers before pivoting to a reseller-based marketplace, the social commerce model that first brought it prominence. The Bengaluru-headquartered firm eventually transitioned to its current marketplace model only in 2021, after concluding that consumers were becoming more comfortable transacting directly online.
The result is a market that no longer resembles the concentrated duopoly that existed for over a decade until 2023. Amazon and Flipkart now find themselves squeezed between two models they cannot easily replicate because their expensive infrastructure, designed for catalogue breadth and next-day delivery, proves ill-suited for either 10-minute deliveries in dense urban areas or ultra-low-price commerce in India’s interior.
Amazon’s position in India has further weakened in recent years after regulators dismantled the arrangements that had allowed the Seattle company effective control over key sellers like Cloudtail and Appario through complex corporate structures. These entities accounted for a significant portion of sales on Amazon.in, and their removal has left the marketplace visibly thinner.
As an analyst told me, it’s highly unlikely that either of the companies will ever aggressively switch to a new model, because doing so would concede that nearly $30 billion that have been spent on them — and by them — was a strategic misstep.
Flipkart remains unprofitable fifteen years after founding despite ample opportunities to strengthen its position that were repeatedly missed, according to senior investors. The company could have acquired Delhivery to bolster its logistics network Ekart or purchased Ecom Express at a steep discount but declined both. It could have purchased Zepto, now valued at $7 billion, for less than $2 billion, but declined.
The company keeps verticals that are actually growing closely held because they help mask how poorly the core business has performed, one veteran investor said. PhonePe, its crown jewel, finally convinced Walmart to separate it from Flipkart and has filed to go public at roughly half of Flipkart’s private valuation.

Meesho’s ascent also reveals how profoundly different India’s retail economics are from those in other major markets. The startup announced its first-ever profit in July 2023 and generated positive last-twelve-months free cash flow of $67.4 million for fiscal 2025, becoming the first horizontal e-commerce platform in India to reach this milestone. By the 12 months ending June 30, 2025, the platform had served 213.17 million annual transacting users and processed 2.02 billion orders. Meesho now holds a 29-31% share of the e-commerce market by shipment volume, excluding hyperlocal, according to Redseer, making it India’s largest platform by that measure.
Yet its average order value hovers near $3.17, meaning the platform processes substantially more orders than Flipkart or Amazon while generating far less total transaction value. This is not a problem to be fixed but the fundamental design of the business — and the numbers show just how different Meesho’s customers are from those the two giants pursued.
Some 87.8% of Meesho’s 213 million annual transacting users live outside India’s top eight cities, places where low average order values can be profitably served. The startup unlocked this market by building for it specifically rather than trying to adapt models designed for wealthier urban consumers.
Meesho operates a zero-commission marketplace, eschewing the transaction fees that form the lifeblood of competitors’ businesses. Revenue comes instead from advertising, fulfilment services, and data insights offered to sellers, and as of September 2025, Meesho remained India’s only scaled e-commerce platform allowing sellers to register without mandatory Goods and Services Tax credentials. The approach complies with regulations while unlocking access for the countless small, informal businesses that form the backbone of India’s retail economy.
Over 575,000 sellers transact annually on Meesho’s platform and over 80% of its gross merchandise value comes from fragmented supply, regional and unbranded products that are the mainstay of local Indian markets. These are items priced around the platform’s average, where the zero-commission structure and low-cost logistics prove essential for maintaining everyday low pricing.
Meesho holds no inventory, develops no private-label brands and crucially owns no logistics infrastructure. The platform sustains engagement through sophisticated algorithms promoting “discovery-led shopping” over conventional search, and in fiscal 2025, this discovery engine was not just a feature but the core driver of the business. Some 73.18% of all placed orders originated from the platform’s feeds or recommendations, not a search bar, according to the startup’s IPO prospectus, a model mimicking offline window browsing that keeps users browsing longer and increases the likelihood of impulse purchases at low price points, crucial when average order values are so small.
Meesho’s most consequential innovation may be Valmo, its proprietary logistics platform launched in 2022. Valmo orchestrates deliveries using a network of third-party partners rather than owned fleets or warehouses, coordinating multi-stage logistics and allowing independent operators to handle first-mile pickup, linehaul transport, and last-mile delivery. By the quarter ending June, Valmo handled 61.98% of Meesho’s shipped orders, up from 19.55% in fiscal 2024, operating via 13,678 active logistics providers. Industry analysis suggests Valmo achieves delivery and return costs up to 12% lower than established logistics players, savings that flow directly to the ultra-low pricing that defines Meesho’s value proposition.
Valmo is also available to sellers who are not on the Meesho platform, a strategy that extends its reach beyond the startup’s core business while profoundly destabilising India’s third-party logistics sector. The impact contributed significantly to the collapse of Ecom Express, once the country’s second-largest e-commerce logistics firm after Delhivery. Ecom Express had relied on Meesho for about 52% of its revenue, so when Meesho shifted volume to Valmo, the consequences were swift and severe.
Meesho’s shipped orders via end-to-end partners dropped from 922.32 million in fiscal 2024 to 824.43 million in fiscal 2025, while Valmo’s surged from 224.06 million to 763.51 million in the same period, and Ecom Express’s shipment growth collapsed accordingly. After filing for an $800 million initial public offering in August last year, Ecom Express instead laid off staff and shuttered delivery centres before being acquired by rival Delhivery for $160 million in April 2025, an 80% markdown from peak valuation.
Delhivery itself is feeling the pressure as its CEO acknowledged operational adjustments due to Valmo’s growth, and other major logistics providers including XpressBees and Shadowfax are facing similar challenges. The pattern reveals a fundamental dynamic in India’s e-commerce evolution. Infrastructure optimised for one model struggles to adapt to another, and just as Amazon and Flipkart’s warehouses were poorly placed for quick commerce, established third-party logistics networks found their economics unsuited for the high-volume, low-margin demands of scaled value commerce.
That’s not to say that Meesho isn’t facing challenges of its own. Cash-on-delivery accounted for 75.09% of shipped orders in the three months ended June 30, 2025, a practice that introduces staggering operational friction. According to the company’s prospectus, these cash-on-delivery orders have a success rate of just 75.55%, meaning nearly one in four fail, compared to a 96.33% success rate for prepaid orders.
This high-failure model increases risks related to cash collection, especially with Valmo’s smaller and more fragmented logistics providers who have limited working capital and operational sophistication, the company itself disclosed in its updated initial public offering prospectus. The platform’s low average order value necessitates continued extraordinary growth in order volumes to scale overall gross merchandise value significantly, requiring the company to process more and more orders just to meaningfully increase total business scale.
(Though not disclosed publicly, or reported previously, I understand that one of the ways Meesho is trying to cut its reliance on cash is by offering buyers credit lines – a recent initiative that is scaling quickly.)
India’s online market now appears increasingly polarised. Value commerce, led by Meesho, serves price-sensitive shoppers accepting multi-day delivery windows, while convenience commerce, dominated by quick delivery firms, targets affluent urbanites demanding near-instant gratification. Traditional e-commerce finds itself squeezed between these poles because quick commerce offers superior speed and Meesho offers lower prices, leaving the middle ground increasingly contested.
Meesho has held its ground while others stumbled, but the ground itself continues to shift, and success in India may hinge less on replicating global templates and more on mastering the country’s unique internal complexities. The infrastructure built for yesterday’s model will not serve tomorrow’s.
Meesho has filed to go public seeking to raise $484 million via fresh issue and will most likely list next month. One of its chief rivals has spent eight years hyping its IPO plans via controlled media leaks without ever filing.
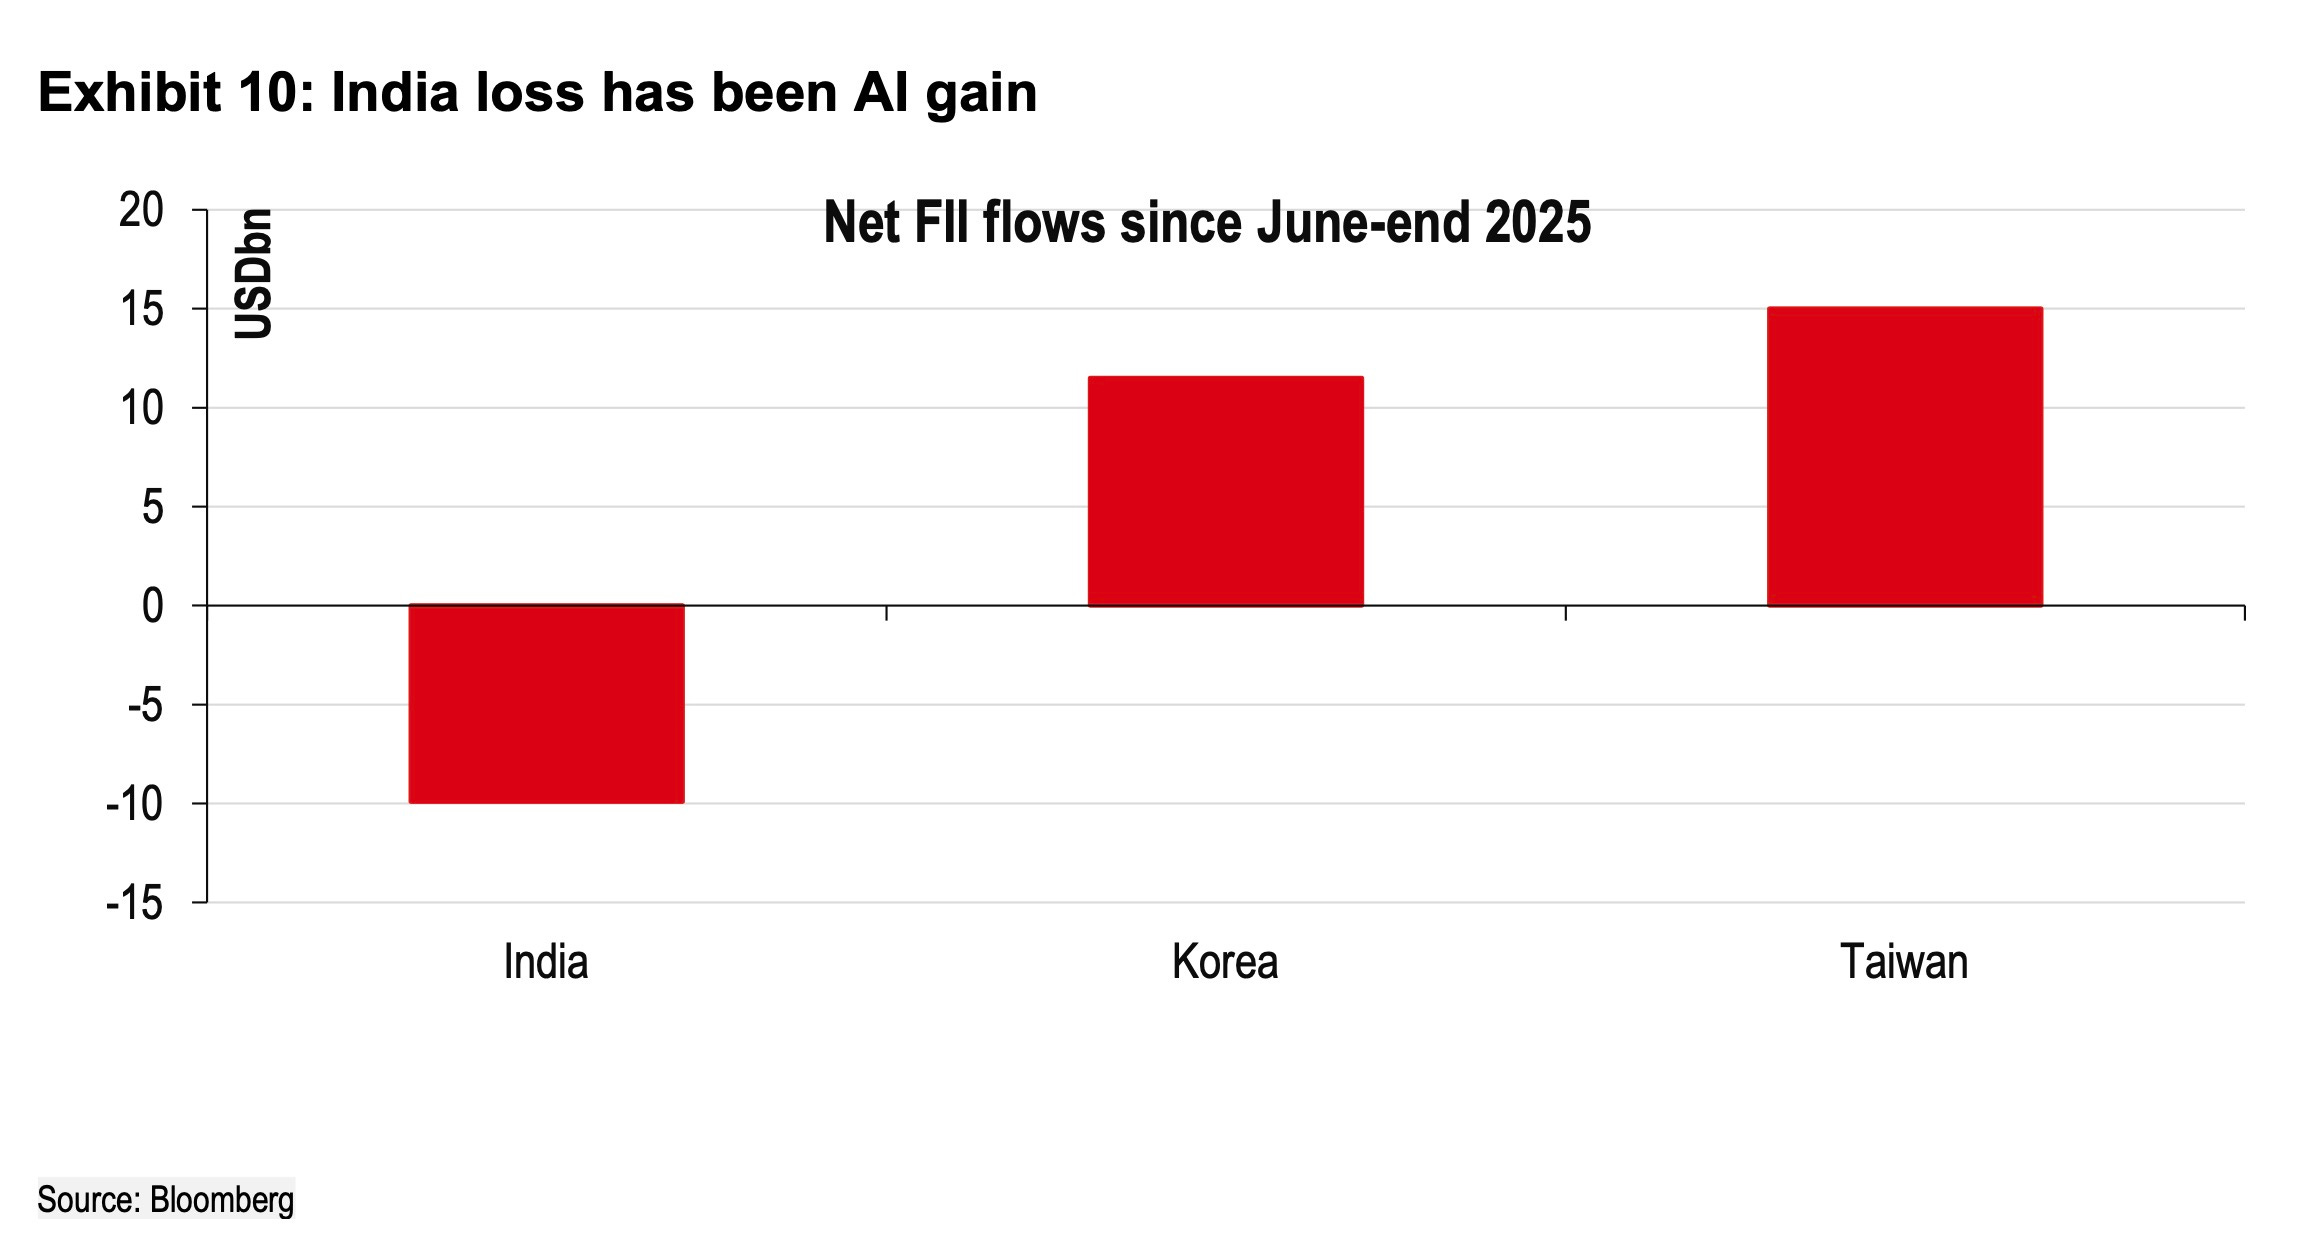
]]>Taiwan absorbed $15 billion of net foreign inflows in the third quarter of 2025 alone. It’s the largest quarterly inflow on record for Taiwanese equities. Fund positioning in Korean markets simultaneously reached levels not seen since 2015. The simultaneity of these movements suggests a deliberate reallocation rather than broad emerging market weakness. Money left India and arrived almost immediately in Northeast Asian technology markets.
HSBC has a strong thesis on what happened. Global investors, the bank wrote in a report this week, increasingly view India through the lens of AI economics. India is being positioned as a global anti-AI play, the bank’s analysts say, citing conversations they held with many global investors.
India’s equity markets face selling pressure not because of conventional valuation concerns or earnings disappointments but because investors are making structural bets on how AI transforms economic comparative advantage. India employs roughly 20 million people directly and indirectly in IT services. The sector represents the country’s largest white-collar employment category and contributes materially to export revenues.
Services account for 55% of Indian gross domestic product, compared to 18% for agriculture and 27% for industry. Financial services, real estate and professional services together represent 42% of GDP. The concentration in knowledge work creates exposure to AI-driven productivity improvements that potentially reduce demand for human labor.
HSBC estimates that digital AI agents cost approximately one-third as much as human agents for customer support and certain mid-office functions. Early deployments in collections, customer onboarding and basic financial services tasks have demonstrated both cost savings and volume increases.
Global tech giants will spend $2 trillion on AI infrastructure between 2025 and 2030, according to consensus estimates for Amazon, Microsoft, Google and Oracle compiled by Visible Alpha. Annual capital expenditure by these four companies is projected to rise from $300 billion in 2025 to $500 billion in 2030. Depreciation charges alone will reach $300 billion by 2030.
This spending creates an economic ecosystem centered on GPU computing, data center operations and enterprise AI implementation. India’s participation in this ecosystem remains minimal. The Indian government launched an AI Mission in March 2024 and committed $1.25 billion over five years. Private sector investment beyond two recent announcements by local conglomerate Reliance Industries and consultancy giant Tata Consultancy Services represents a negligible fraction of the global total.
The capital flows reveal the market pricing in this asymmetry ahead of visible economic damage. Indian IT services companies have reported slowing growth and reduced hiring but not yet material revenue declines or workforce reductions. The leadership at major Indian banks and financial institutions told HSBC they remain cautious about aggressive AI adoption. (They say they are concerned about customer data security, regulatory uncertainty and unclear costs for agentic AI systems.) Most Indian companies are currently using AI to improve service quality and increase transaction volumes rather than reduce headcount. HSBC analysts estimate Indian companies are 12 to 18 months away from significant AI adoption for mid-office and back-office functions including loan approvals, policy administration, supply chain management and financial accounting.
The market appears to be front-running a transition that has not fully materialized in employment or earnings data. Foreign investors have reduced their India holdings by nearly 500 basis points over eight months while domestic mutual funds and other institutional investors have absorbed most of the selling. Domestic buyers added roughly $40 billion to Indian equities in calendar year 2024 and have continued buying through 2025. The divergence between foreign and domestic investor behavior creates a natural question about who is correctly pricing India’s position in an AI-dominated global economy. Foreign capital has moved decisively toward markets that benefit from AI infrastructure spending. Domestic capital continues to accumulate shares in an economy where 55% of output comes from services that AI may partially automate.
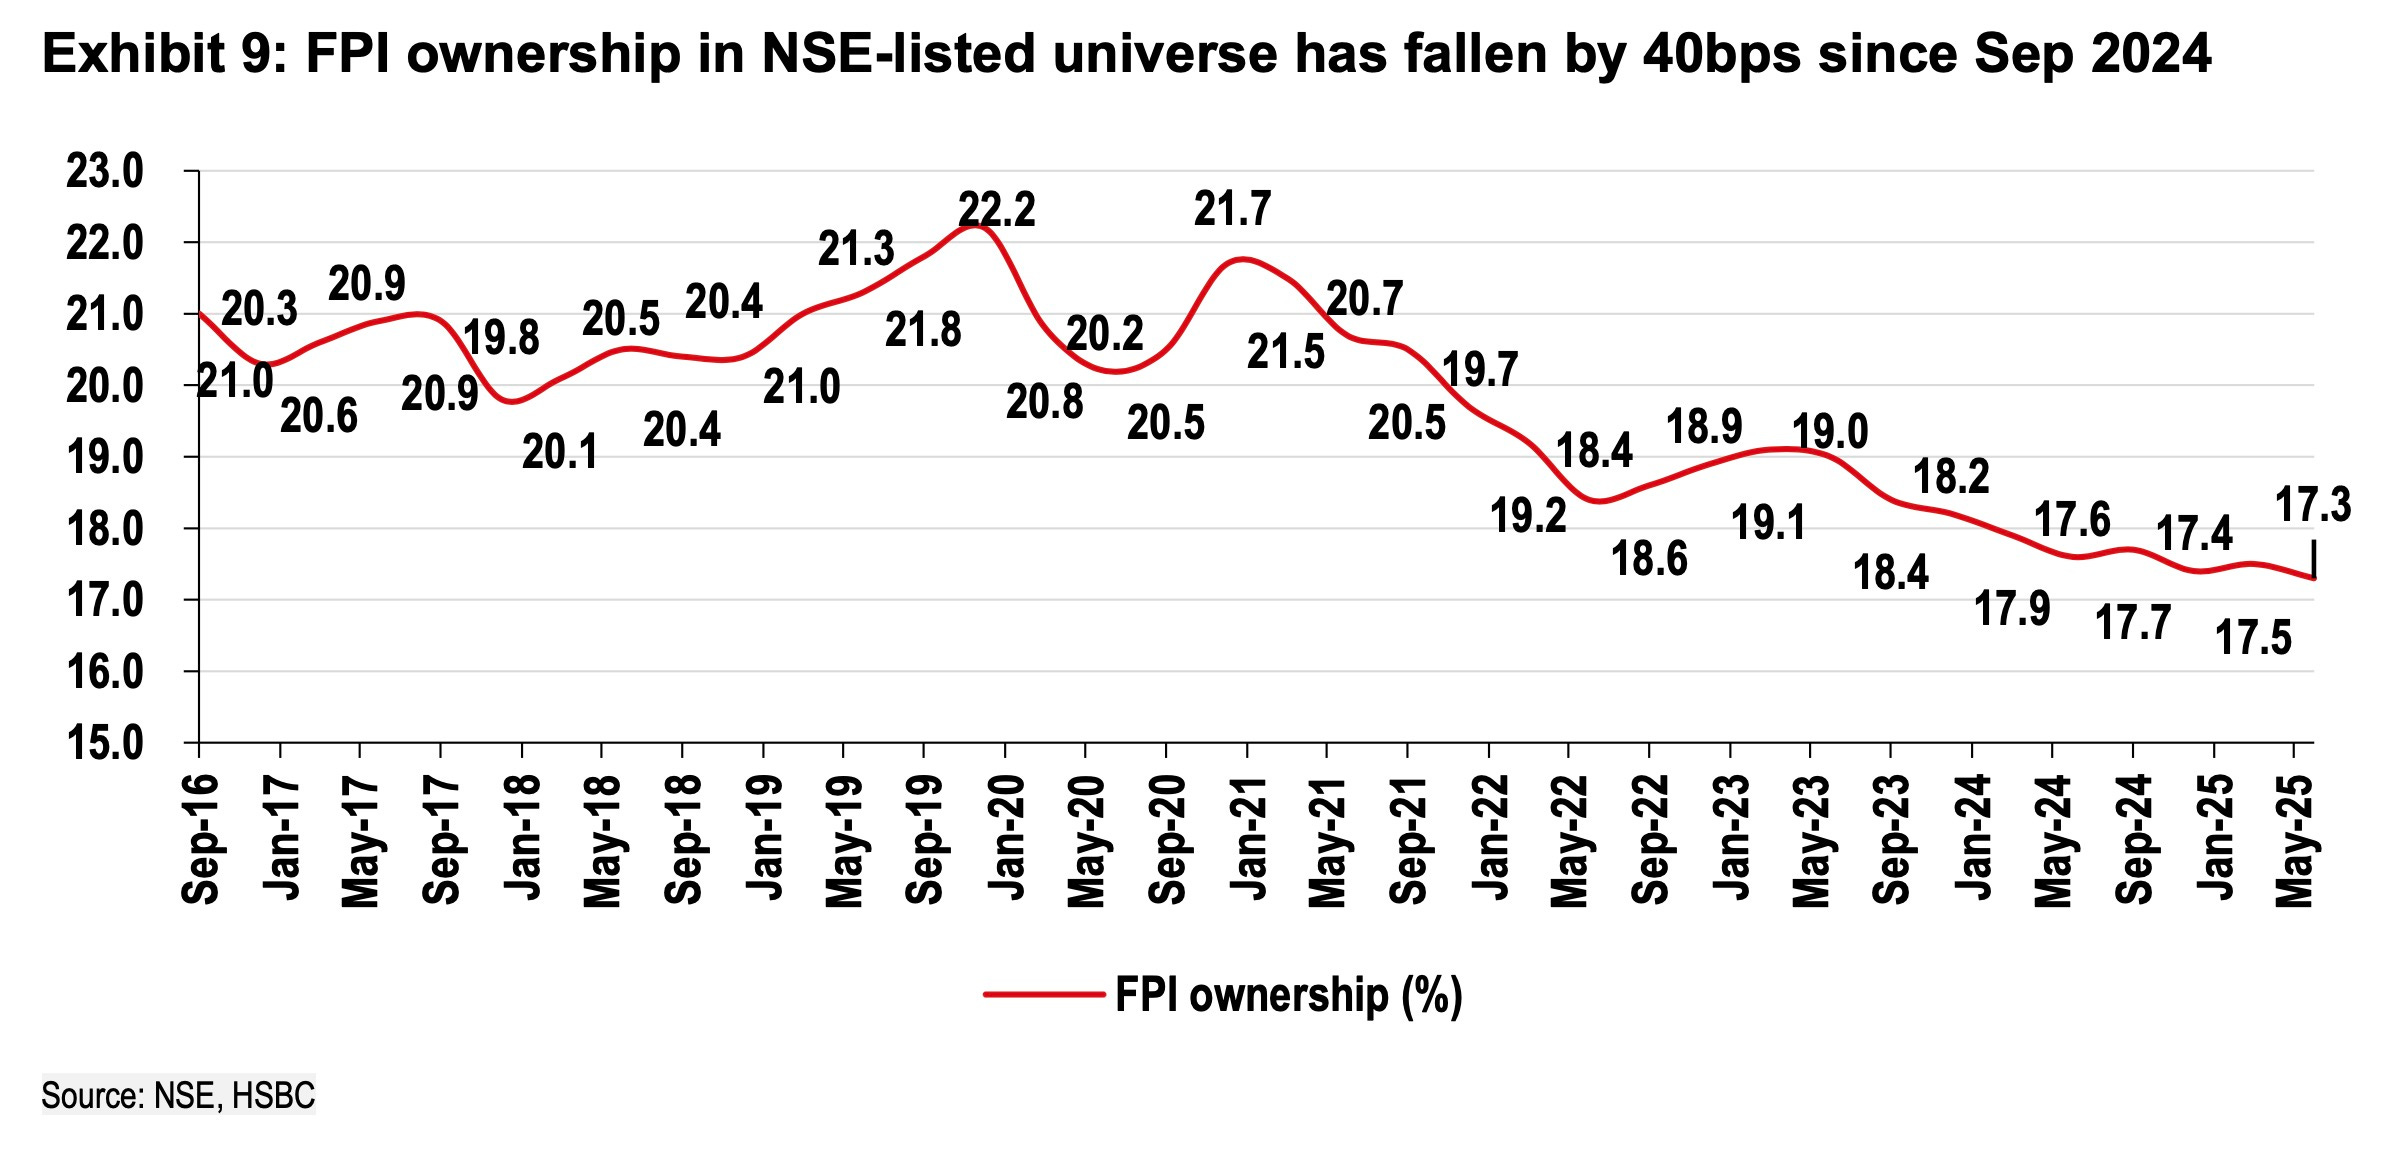
But! There’s a silver lining, maybe. HSBC says three potential catalysts could reverse foreign institutional selling and restore inflows to Indian markets. Fund positioning in Korea and Taiwan has become crowded. Any negative developments in AI investment sentiment or semiconductor demand could trigger rapid unwinding of these positions. Rotation into emerging markets has not occurred despite a weakening U.S. dollar and resumption of Federal Reserve rate cuts. India would likely capture disproportionate inflows if broader emerging market rotation begins. U.S. tariff policies will have limited direct impact on Indian corporate earnings but any positive trade developments could bring back investors who have moved to the sidelines rather than actively reallocating to other markets.
The positioning data suggests global investors are making a binary bet. Either India’s services-based economic model faces structural decline as AI automates knowledge work, or the market has overreacted to a technology transition that will take years to fully impact employment and create offsetting opportunities in AI implementation services.
]]>India and China are the only countries where quick commerce is working at scale. Both markets have reached multi-billion-dollar categories. But the business models employed by quick commerce players in either nation have almost nothing to do with each other. India’s version is maturing into a distribution layer that sells attention first and items second. China’s version is functioning as a weapon inside platform wars designed to win sessions rather than profits. In India, some key buyers are brand managers carrying budgets and conversion targets. In China, the buyers are super-app strategists trying to keep users and merchants inside the fortress.
India has built a dense grid of dark stores covering 2-3km catchments and promising 10-15 minute drops. China is leaning more on broad marketplace configurations operating within 30-60 minute windows and mixes dark stores with picking from offline retail locations. The difference in infrastructure is shaping everything that follows.
India’s leaders are compounding logistics scale and then monetising the customer journey upstream. Blinkit currently operates roughly 1,920 dark stores across 210 cities and is on track for a 2,000-store footprint this year. The Eternal-owned firm leads the market at roughly half of all quick commerce GMV in India and tends to price near market medians while leading on SKU availability. The expanding presence is bringing higher net average order value to the firms and letting them moderate headline subsidies.
Quick commerce in India started as a replenishment service with most orders arriving just before breakfast or lunch. Assortment expanded as convenience and instant gratification took hold. India’s QC leaders are now competing to expand assortment, reliability and inventory depth rather than undercutting price at any cost.
By 2030, India’s quick commerce could reach 47% of online retail against China’s 11%, Bank of America projects. This gap does not reflect a difference of taste but of network design, urban cost curves and state of economies.
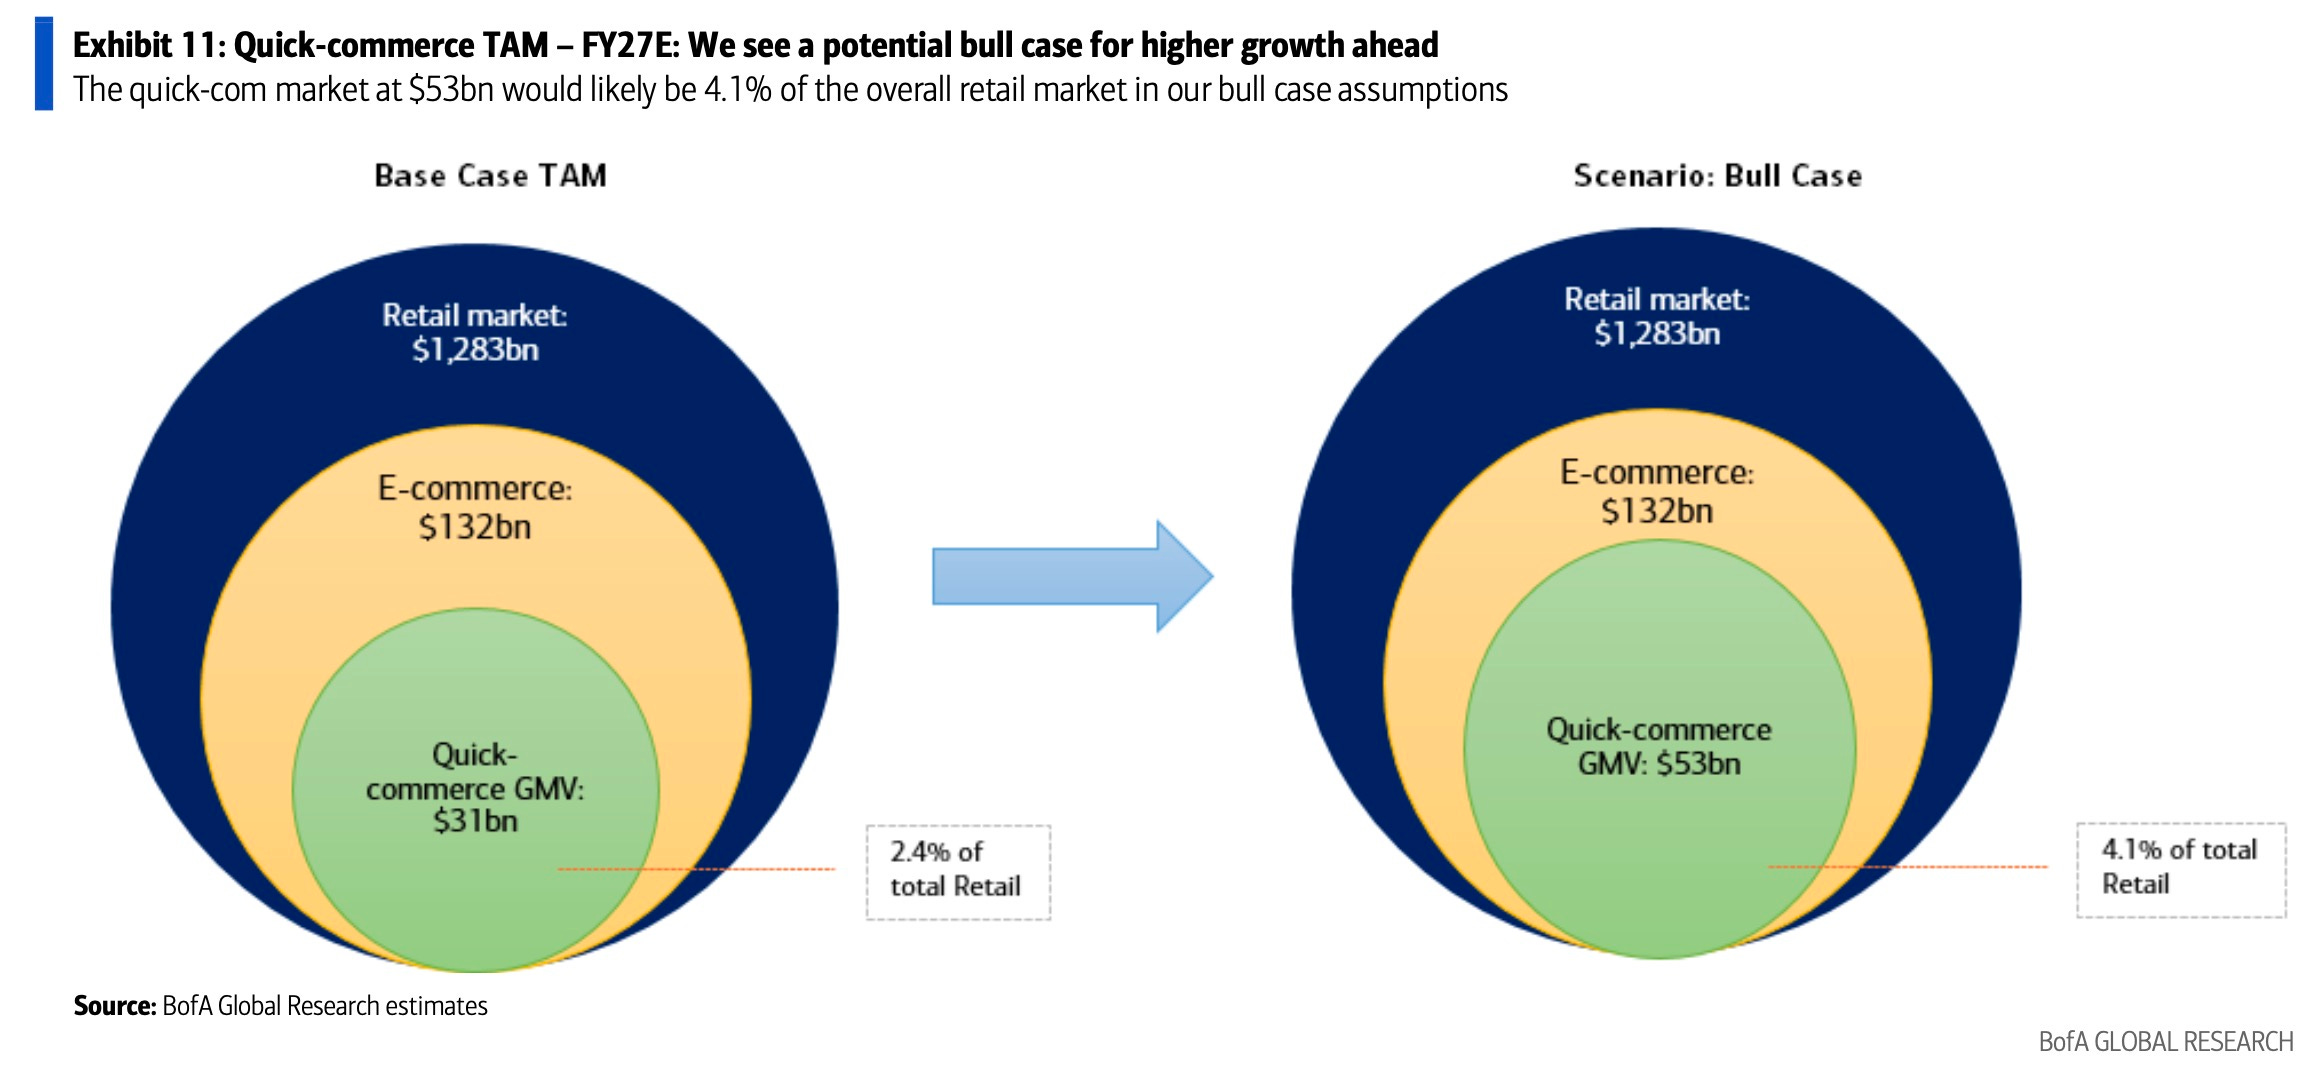
Take rates (the percentage of GMV that a platform keeps as revenue) run about 15-20% in India versus roughly 10-11% in China. Average order values sit at $6-7 in India against $10-12 in China, according to latest disclosures from the firms. Chinese customers spend nearly twice as much per order yet Chinese platforms still struggle with profitability under subsidy pressure.
India is expected to sustain around 5% steady-state EBITDA as the market rationalises. Platforms are shifting into higher-margin categories and private label. They are negotiating better sourcing terms as scale builds. Assortment expansion lifts basket sizes. Advertising yield adds another layer on top. None of this requires burning cash every quarter.
Analysts at BofA estimate retail-media and related advertising run at about 3-3.5% of GMV today and could rise to 5-5.5% of GMV carrying roughly 90% EBITDA margins. That margin characteristic is creating operating leverage without inviting a price war at checkout. Ad slots, retail-media tools and brand partnerships were impossible in the old kirana distribution stack. At 90% margins this is revenue that pays for reliability rather than just growth.
India’s densification is happening both in top metros and in tail cities, raising service levels without breaking delivery costs. Blinkit is leading the expansion while Zepto and Instamart have slowed store openings, allowing their older locations to mature and improve contribution margins. Competition has already cooled at the edges as Zepto and Instamart balance growth with EBITDA and as newcomers fail to find a wedge. BofA expects consolidation around two or three national winners. Capacity will still expand fast but the centre of gravity will drift toward procurement, private label and ad yield, a recipe for margin recovery as the category gets bigger.
Alibaba and JD currently appear to be treating food delivery and quick commerce in China as a traffic driver rather than a profit driver. The platforms use the channel as a lever to test cross-sell, ROI and ecosystem synergies. Alibaba, JD and Meituan together are ploughing around $21 billion into consumer, rider and merchant subsidies this year. BofA expects the market to reaccelerate to 40% plus growth in 2025 and remain brisk thereafter. Daily orders across food delivery and quick commerce peaked at about 250 million in July, up from roughly 80 million in January.
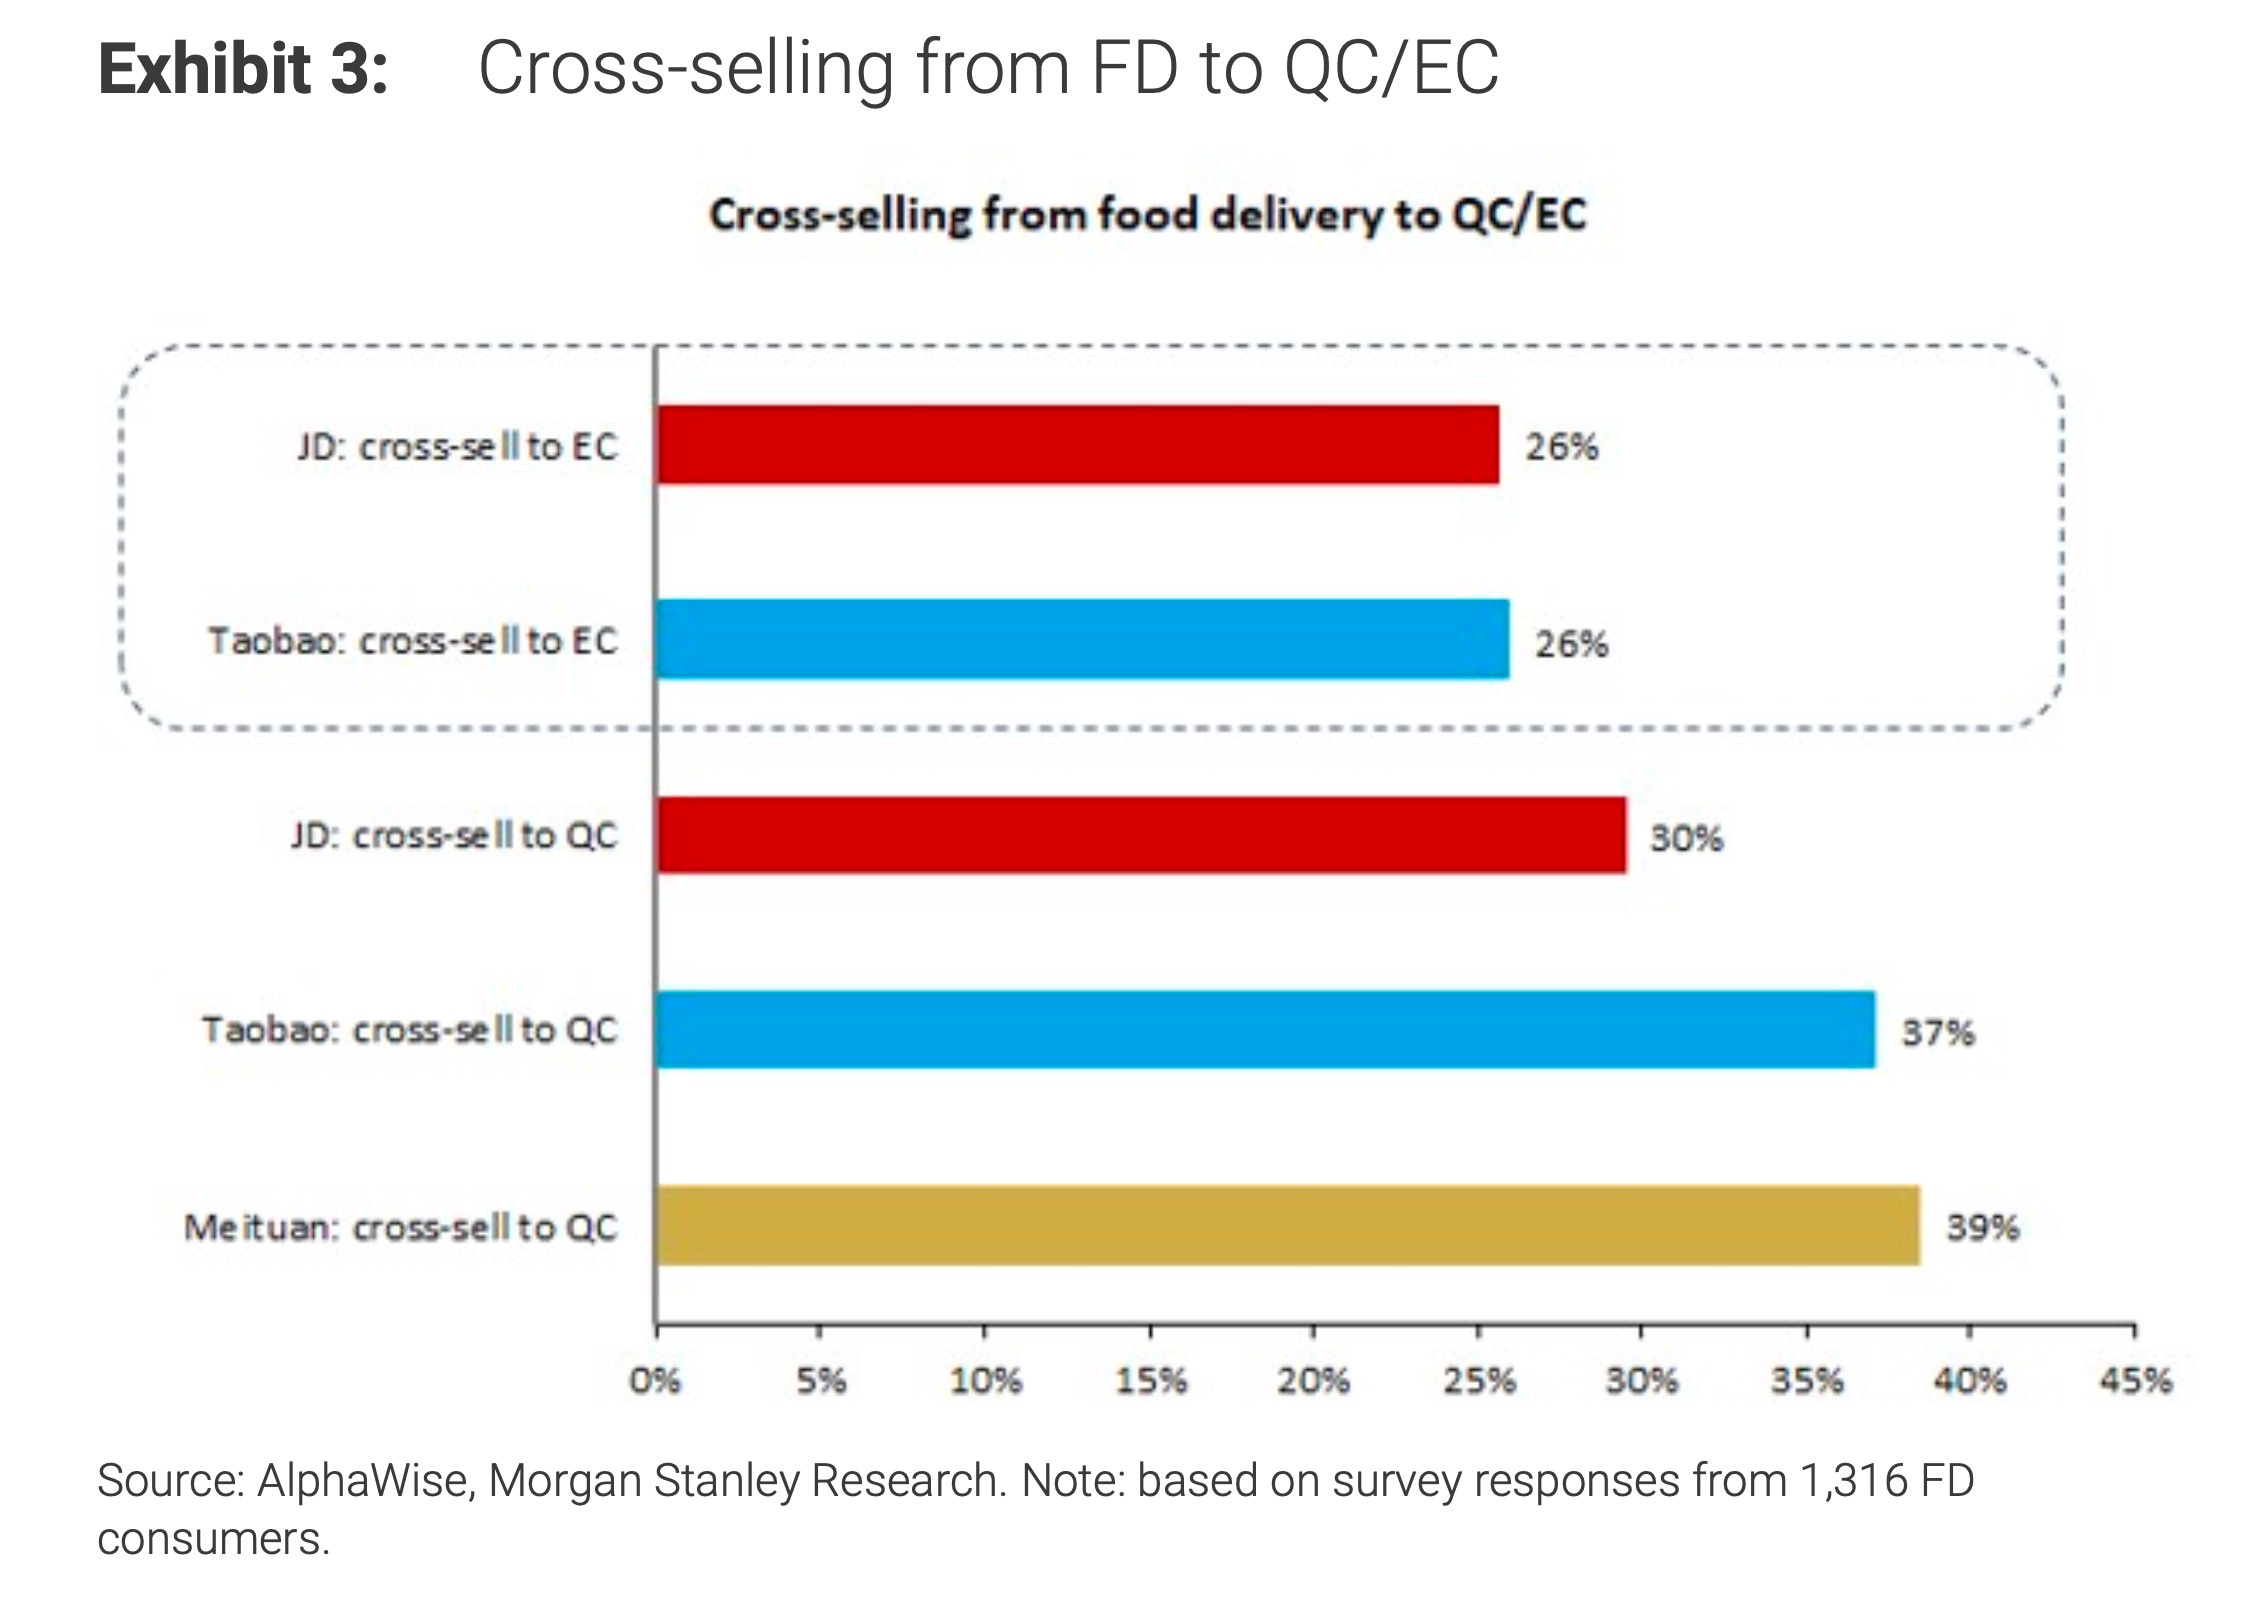
Regulators in China have pushed back against the subsidy war. Platforms were summoned on May 13 and again on July 18 to hear calls for rational competition and ecosystem health. The State Administration for Market Regulation released draft rules in September focused on fees, promotions, safety and fair competition.
Chinese leading players maintained operating margins of 5-10% in the first quarter of 2025. Meituan’s quick-commerce orders flipped to loss-making from the second quarter as take rates fell and delivery costs rose under subsidy pressure. Meituan’s special delivery and first-party online supermarket arm give it operational advantages. Those advantages are being neutralised at the P&L line by the subsidy war. Management has indicated the long-term target for food delivery and quick commerce is daily orders of 100 million at $0.14 profit per order. That unit profit target sits 30% below the company’s $0.18 operating profit per order in 2024.
About 41% of Chinese quick-commerce orders are incremental rather than cannibalised from existing e-commerce, according to Morgan Stanley. Another 51% substitute offline spend. In a market where user time spent is the currency of competition, that justifies ongoing spend even as unit margins compress. QC buys mindshare that can be monetised elsewhere across the platform, from broader e-commerce to payments and local services, which explains why the cheque books opened.
China’s long-run profit pool in quick commerce probably looks thinner per unit than India’s, though the volume and the ecosystem value can still be large. BofA reckons the segment could approach 10% of online retail over time. Morgan Stanley lifts its 2030 TAM to $352 billion, roughly 12% of online retail, as subsidies train users into the habit. The category will get bigger, probably much bigger, but the margin question will remain subordinate to the share question until the traffic battle resolves.
India’s new entrants to QC should study China’s brutal clarity about what QC is for inside a platform. Morgan Stanley calls the Chinese contest a “burn to earn” 30-minute battle: earn sessions now to earn economics later. That logic helps explain why Alibaba’s $7 billion push forced rivals into matching outlays and why analysts think competitive intensity will peak before it recedes. Indian firms do not need that scale of brinkmanship but they can borrow the idea of using QC to cross-sell into adjacencies where unit margins and cash conversion are better.
China’s platforms could borrow the discipline of pricing near medians rather than at extremes and winning on availability and assortment. That combination lifts net AOV without inviting counter-subsidies. Treating retail-media yield not as window dressing but as an explicit line of defence for contribution margins and a reason to invest in data plumbing and category depth offers another path to taper the subsidy treadmill without surrendering frequency.
India is building a retail-media infrastructure that happens to have logistics attached. China is running a strategic traffic lever that happens to have logistics attached. The former is designed to earn its margins. The latter is designed to earn the right to margins later. Both can be viable, but only one is likely to be peacefully profitable.
]]>Goldman Sachs estimates that power required from utilities now needs roughly 7.2% annual growth between fiscal years 2025 and 2035, up from a prior 5.6%. The ratio of power growth to economic growth has been revised to roughly 1.06, versus roughly 0.85 before. Rising appliance ownership, electric vehicle charging and green-hydrogen pilots are pushing demand higher across the economy.
The compute infrastructure supporting the digital economy is migrating from traditional IT rooms to industrial-scale data centres, creating a new and concentrated source of load that operates on a different scale than anything the grid has handled before. Hyperscalers say power is the first or second question in every investment decision when they evaluate potential data center locations.
India’s data-centre base is still in the low single-gigawatts today, but Bernstein forecasts cluster around 5 to 6 gigawatts by 2030, provided interconnects and land clear on time. Jefferies’ top-end view reaches roughly 8 gigawatts, which at typical costs of 4 to 5 million dollars per megawatt implies 32 to 40 billion dollars of capital expenditure by decade-end.
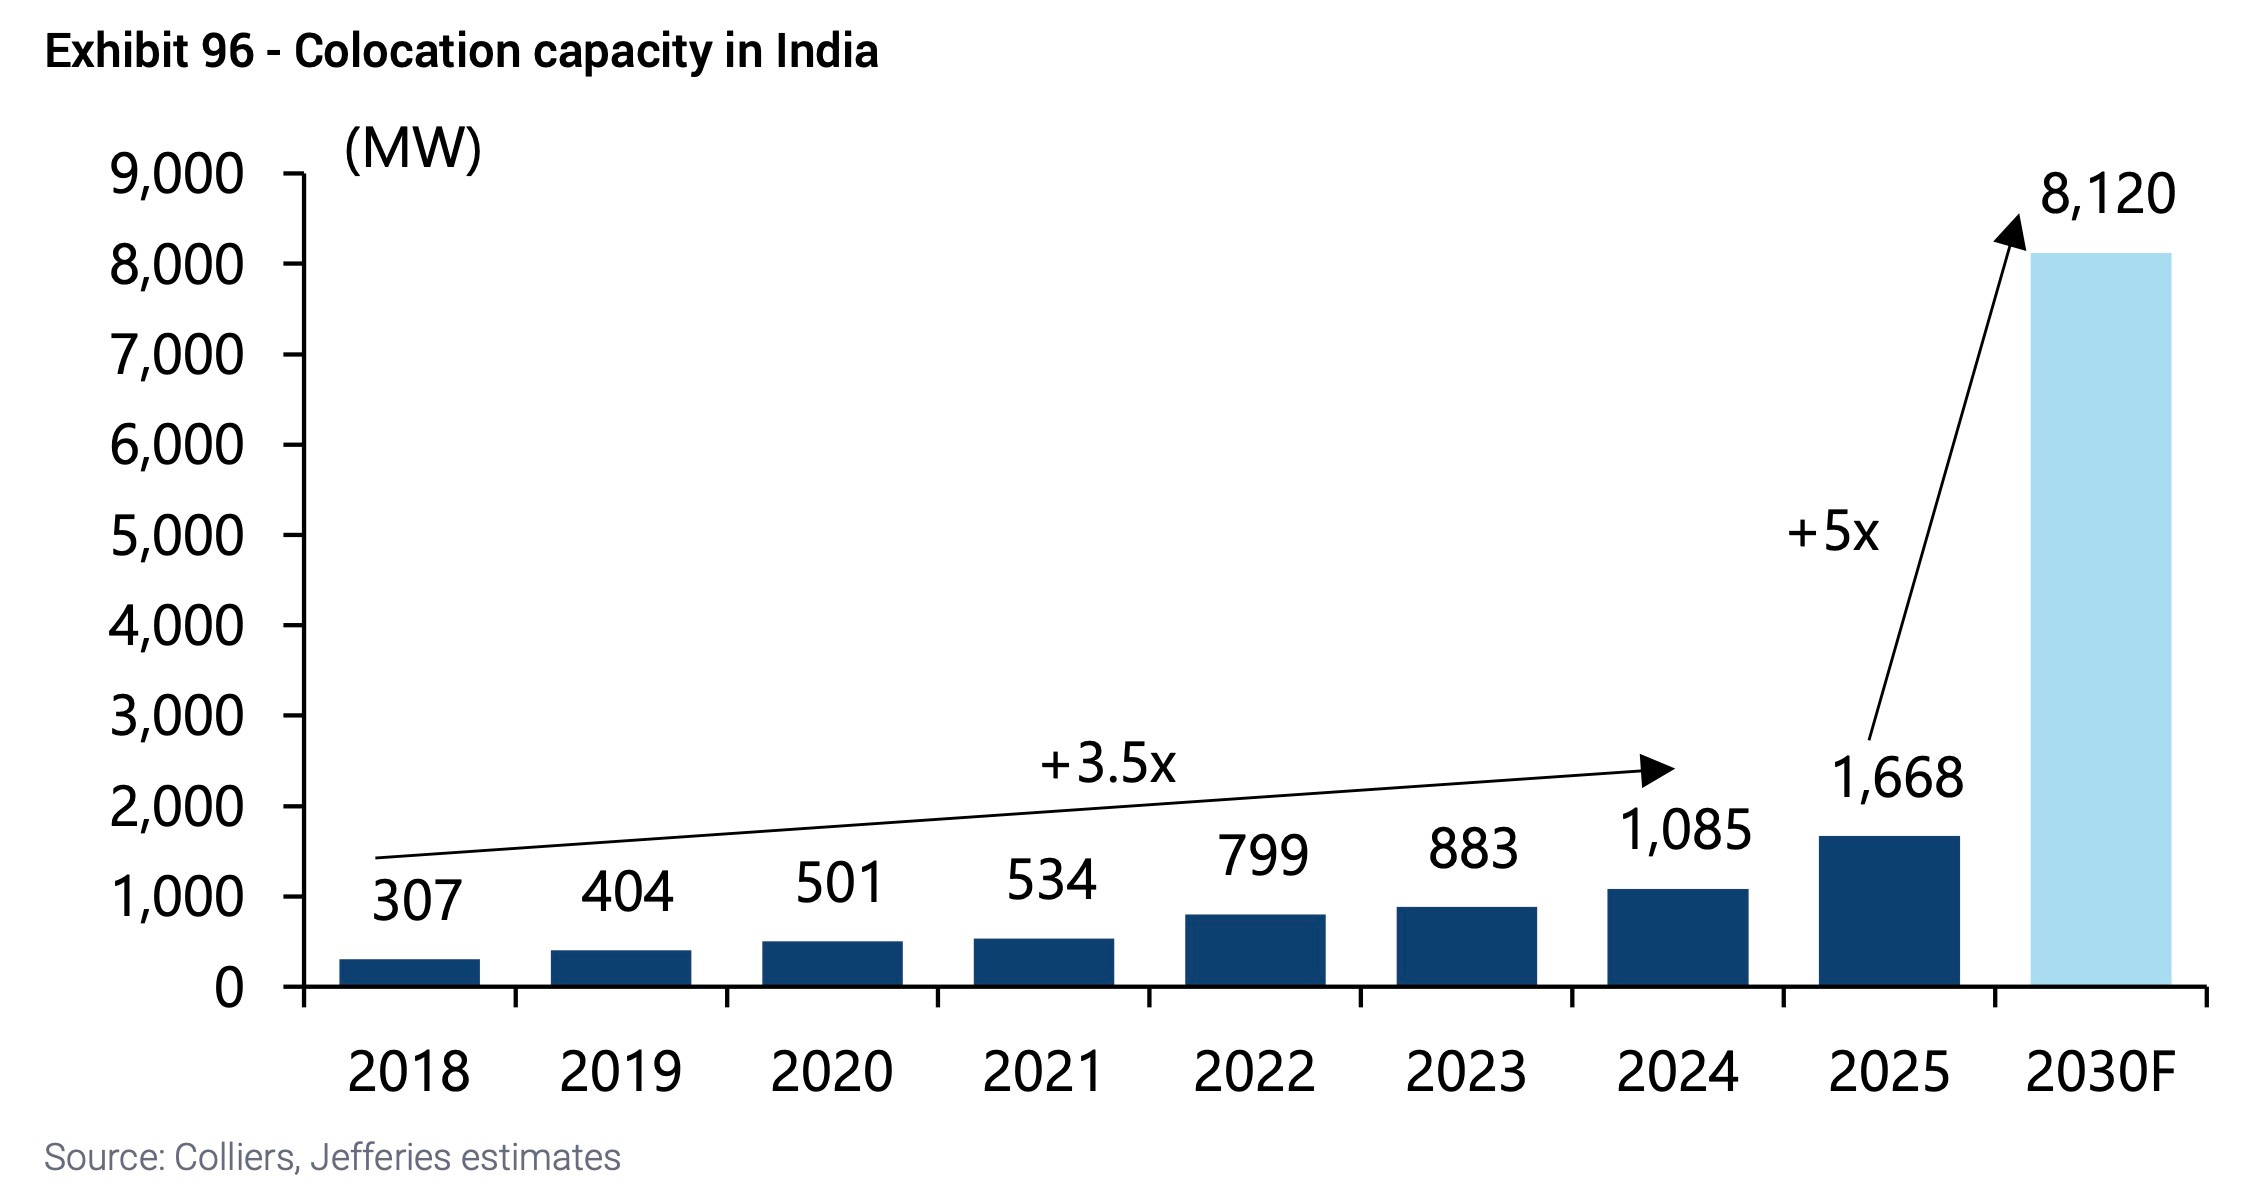
AI servers draw five to seven times the power of a legacy server rack, according to HSBC, creating disproportionate pressure on the grid. At scale, a 1 gigawatt campus needs roughly 1.3 to 1.5 gigawatts of constant supply depending on how efficiently the facility uses power, per Morgan Stanley. Power availability and connection queues now drive site selection as much as land price does, fundamentally altering the economics of where these facilities can be built.
Data centres use only a sliver of India’s power today, but their share plausibly rises into the low single digits by fiscal year 2030 even in Nomura’s base case scenario. In a more aggressive scenario, consumption reaches 80 terawatt-hours, creating demand that would rival entire industrial sectors. Silicon wants electrons on a firm schedule that the current grid cannot reliably provide.
India can construct utility-scale solar farms in 12 to 24 months (Mohit Bhargava, Senior Advisor to India Energy and Climate Center at UC Berkeley and former CEO of NTPC Green Energy said at a recent conference), which makes the renewable buildout look deceptively simple on paper. Reconciling that speed with the physics of electricity demand is proving harder in practice. Solar panels flood the grid when daytime demand is comparatively low, then fade precisely as households and commercial loads climb after 5 PM.
On Goldman’s full-year models, the system runs a 1% to 4% energy deficit by fiscal years 2034 through 2035. Five-minute modelling of the peak week under adverse weather produces a deficit nearer 9%. This is not a morality tale about dirty versus clean energy sources but a timing problem that no amount of solar capacity alone can solve, no matter how many panels are installed or how quickly they are brought online.
Coal plants can run around the clock and can ramp up production during the evening hours to meet surging demand. Legacy flexibility in the existing fleet complicates this seemingly straightforward solution in ways that limit how much solar the grid can absorb. Many Indian units struggle to operate at levels much below 60% to 70% of capacity, according to data shared by federal grid operator POSOCO.
Operating at these minimum levels is crucial to keep the grid’s frequency stable, yet this makes it harder to absorb midday solar or respond to clouds passing overhead. Flexibility retrofits and revised operating norms matter as much as new megawatts in addressing this constraint, but the scale of the upgrades required is substantial.
Assessments suggest India may need roughly 140 gigawatts of additional coal capacity by fiscal year 2035 versus 2023 levels. The government’s current target is roughly 87 gigawatts by fiscal year 2032. Some of this coal is bridge capacity to stabilise a faster-greening grid, not a repudiation of renewables, but the scale required exceeds what policymakers have publicly acknowledged or what most analysts expected even two years ago.
Transmission infrastructure is the rate-limiter on the entire system, constraining how quickly renewable capacity can be added even when the generation itself can be built rapidly. The National Electricity Plan allocates about $110 billion for transmission through 2032, expanding the network from roughly 485,000 to roughly 648,000 circuit-kilometres and adding nine long-haul high-voltage direct current links totalling roughly 33 gigawatts.
Typical interstate lines take 30 to 36 months to complete, and that timeline arrives before accounting for right-of-way fights and land acquisition disputes that routinely add years to the process. India’s present ability to move power through the system at high voltages is nowhere near what a continent-scale renewables-plus-data-centre system needs to function efficiently.
Moving bulk power efficiently across regions will demand more substations, more support for maintaining stable voltage and more high-voltage direct current backbones than are currently funded or planned. The investment exists on paper, but the physical infrastructure lags years behind where it needs to be to support the generation capacity that is either already built or under construction.
The constraints are already affecting major renewable developers in concrete ways. Reliance has land banks suitable for well over 100 gigawatts of solar capacity, but the ability to connect to the grid is the choke point affecting actual deployment of these projects. Its first 690 megawatt application at Khavda, a village in Bhuj Taluka of Kutch district, was granted connection capacity only by 2030, three years later than requested and larger blocks open from 2032 onward.
Data-centre developers cannot sit in a transmission queue for years waiting for grid connectivity to materialize. They will gravitate toward firm electrons and existing infrastructure, not promises of future capacity that may or may not arrive on schedule.
Energy storage is attempting to fill the gap between when solar generates and when demand peaks, but the scale required is enormous. Peak-week modelling suggests India could require roughly 530 gigawatt-hours of energy storage by fiscal year 2032, with about 420 gigawatt-hours plausibly delivered by batteries on current pipelines versus roughly 240 gigawatt-hours in government guidance.
Battery pack prices have fallen roughly a third over the last two years, making solar-plus-storage economically viable for shifting midday power to early evening hours and covering short peaks that were uneconomic before. At multi-hundred-gigawatt-hour scale, supply chains, financing and siting still constrain deployment speed in ways that make it difficult to build fast enough. Storage is a powerful complement to transmission and flexibility, not a replacement for either, and it cannot by itself solve the problem of evening demand.
Natural gas looks like a textbook bridge fuel on paper, offering the flexibility and reliability that the system needs. Except that cost and availability work against it in practice in the Indian context. Even under prospective liquefied natural gas gluts on global markets, gas-fired generation sits higher on India’s merit order than coal because of fuel pricing dynamics that have persisted for years.
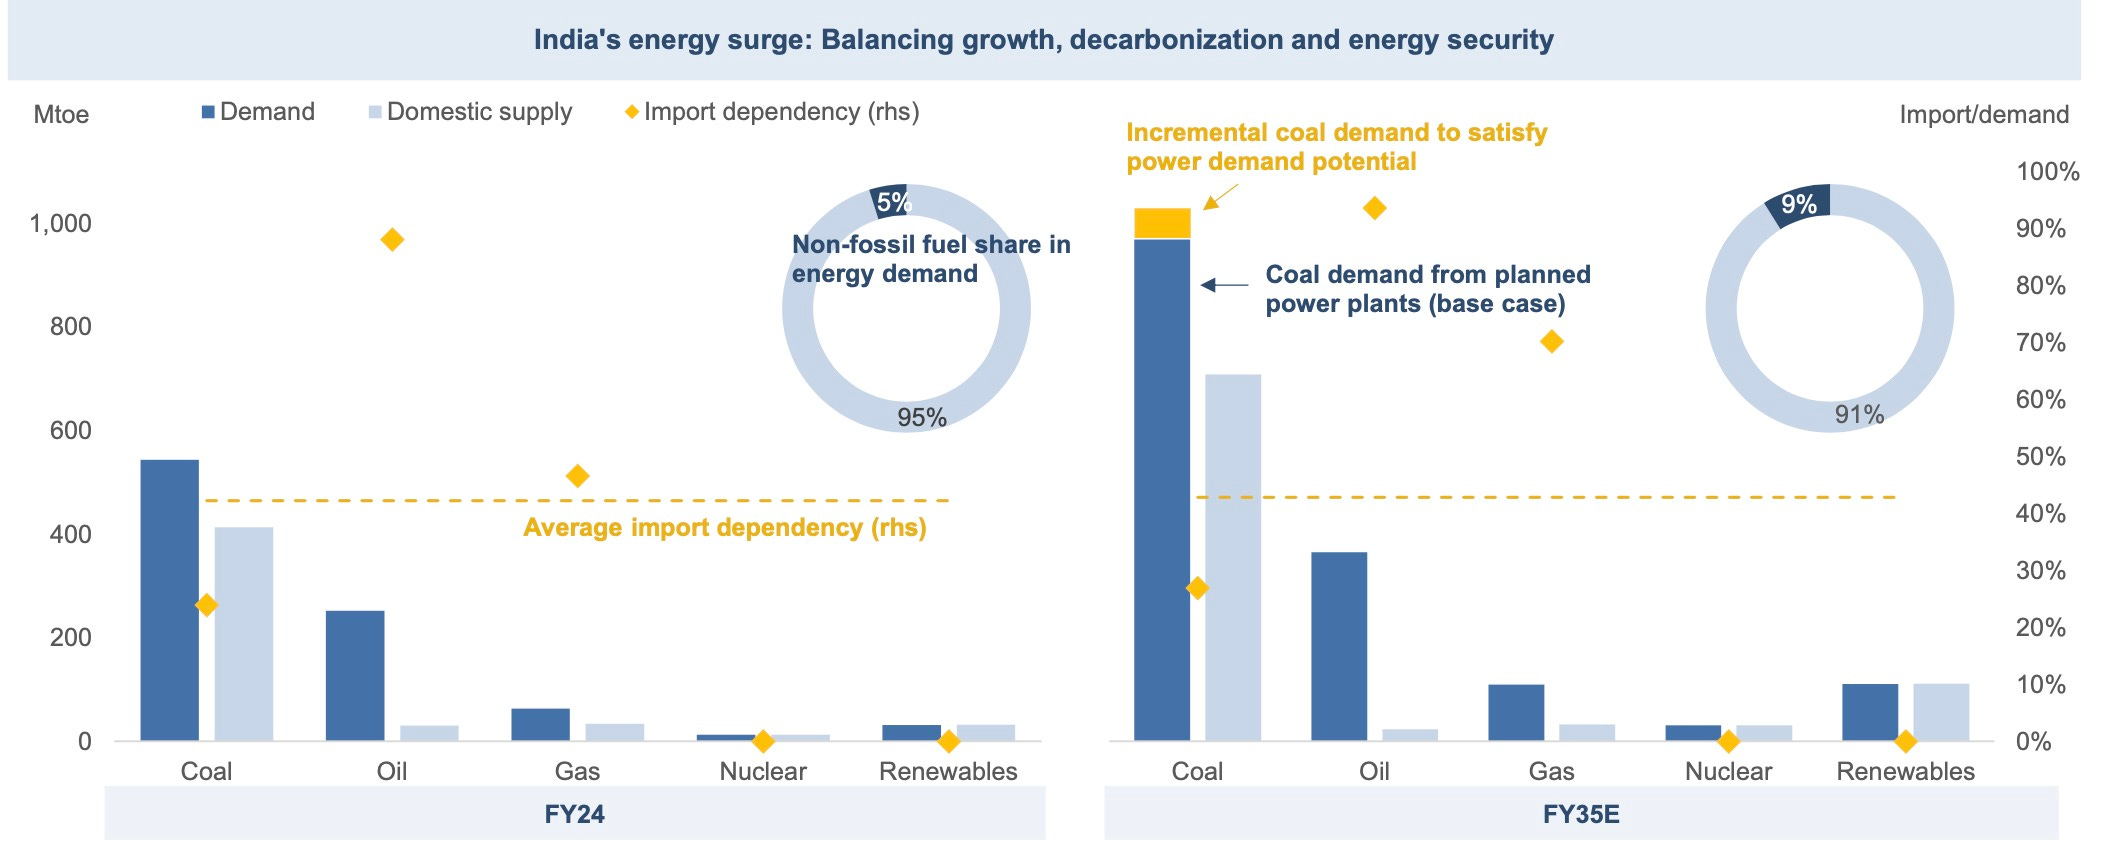
Gas will find a role as peaking capacity and locational reliability, especially where transmission infrastructure and urban substations are running at their limits, but it will not underwrite the nation’s evening ramp at scale on current economics. The math simply does not work at the volumes required to make a meaningful difference in the overall power balance.
Time-of-day tariffs, interruptible contracts for large users and automated demand response can shave the peak and reduce the need for new generation capacity if deployed aggressively. These tools should be pursued because they can deliver results faster than building new plants or transmission lines and at a fraction of the capital cost.
The political economy resists change in ways that make widespread deployment difficult. Distribution company finances are fragile, tariff reform is jagged and politically contentious, and enforcing sharp evening prices on voters is rarely a career-enhancing move for state governments that depend on those votes. Without that price signal, smart loads remain a pilot program rather than a resource at scale that can materially affect the peak demand problem.
Institutions will decide the pace as much as technology does, determining which solutions can be deployed and how quickly they can scale. The Central Electricity Authority and Central Electricity Regulatory Commission set operating norms that determine how low coal plants can be run, how quickly they must ramp and what flexibility investments can be recovered through tariffs.
State distribution companies control connection timelines and local capital expenditure decisions that affect every project. They also ration pain through load-shedding rather than pay for upgrades that stress their balance sheets and require politically difficult tariff increases.
Land acquisition and right-of-way rules for the interstate transmission system pit national priorities against local politics and immediate constituent concerns in ways that delay projects for years. Open-access permissions, banking rules, and cross-subsidy surcharges tilt corporate buyers toward captive generation solutions instead of grid-beneficial ones that would help the broader system but offer less certainty to individual companies.
China’s solution to data-centre load has been a coal-plus-renewables tandem buttressed by ultra-high-voltage transmission lines that move power thousands of kilometres across the country. The country built firm capacity and a long-haul backbone first, then stacked wind and solar behind it once the grid could handle the variability. It is not clean by any measure, but it is stable and predictable in ways that enable industrial planning.
Texas offers a cautionary mirror on the other end of the spectrum: a torrent of wind and solar capacity, relatively light interconnections between regions, and a price-only market that invites curtailment and volatility during extreme weather events. That system is now being partly tempered by a wave of battery installations, but the integration challenges remain significant.
India cannot copy either model wholesale given its own institutional constraints and geography, but the lesson is the same everywhere. Get the transmission infrastructure and the operating rules right before promising 24-hour clean power to compute campuses that require uninterrupted supply.
Most commentary fixates on long-distance transmission lines as the primary constraint limiting renewable deployment. The near-term crunch may actually be distribution infrastructure at the local level, which receives less attention but creates immediate bottlenecks.
Data-centre parks and peaking plants need substations at various voltage levels, high-capacity feeders, and fault-level upgrades inside cities already operating at thermal and political limits. Who pays becomes key in determining what gets built and when: developers via hefty connection charges, or distribution companies via capital expenditure they can barely finance given their debt loads and tariff constraints.
Connection queues and local reinforcement requirements may add as much delay as the interstate lines that dominate public discussion, creating a two-tier bottleneck that affects different projects in different ways.
Avoiding a false binary choice is essential when considering how much coal versus everything else the system needs to manage the transition. A plausible fiscal year 2035 mix that manages the evening peak includes several components working together in ways that complement rather than substitute for each other.
A large block of new coal capacity operating flexibly during the 6 PM to 11 PM hours when demand surges past what renewables can provide. An upgraded legacy fleet with lower minimum operating levels to absorb midday solar without destabilising the grid’s frequency or forcing curtailment.
Hundreds of gigawatt-hours of batteries shaving intraday swings and covering the first hour of the peak before other sources take over. A modest wedge of gas for location-specific reliability and fast start capability where transmission constraints prevent coal from serving certain areas. A growing contribution from time-of-day tariffs and demand response as state politics allow and distribution companies become more financially stable.
The exact shares will move with prices, weather patterns and policy choices as the decade progresses, but the direction is clear regardless of which specific path policymakers choose. India will add coal to buy time for transmission, storage and demand-side tools to catch up with the modern economy’s arrival, even as it continues building renewable capacity at record rates.
The digital economy is arriving faster than the physical grid can adapt to handle its demands. Transmission lines take years to plan, approve, and construct under the best circumstances. Solar panels go dark at the worst moment for system reliability, creating precisely the gap that needs to be filled.
Batteries are powerful tools but not yet cheap enough at the scale required to make evening peaks disappear entirely, despite the dramatic cost declines of recent years. Hydroelectric plants and nuclear reactors face long lead times and public resistance that delay their contribution to the grid mix, often by a decade or more from initial proposal to operation.
Given these timelines, the dependence on high-carbon baseload power will rise before it falls, creating a period where emissions may increase even as renewable capacity expands. Policymakers cannot pretend otherwise or deny the contradiction between clean energy goals and near-term infrastructure realities.
Thanks for reading India Dispatch! Subscribe to receive new posts.
The strategy is a direct response to India’s notoriously tangled rules on foreign direct investment. For decades, regulations have prevented overseas firms from owning a majority stake in multi-brand retailers, a policy designed to protect the country’s 13 million family-owned kirana stores and their 40 million employees, who happen to constitute a vote bank no government dares to antagonize.
This protectionist stance has thwarted the ambitions of giants including Walmart and, most pointedly, Amazon. So in 2019, Amazon engineered a workaround. Alongside Samara Capital, an Indian private-equity firm, it acquired a majority stake in More Retail from the Aditya Birla Group for $580 million. The structure is a masterclass in regulatory navigation: Amazon holds a 48% stake in the parent company, just shy of the controlling threshold, making it an immensely powerful shareholder rather than a direct owner.
The timing of Amazon’s patient positioning through More takes on new significance as Washington increases pressure on New Delhi to liberalize its markets. US Commerce Secretary Howard Lutnick declared last week that India must “open their markets, stop taking actions that harm America” and warned that countries wanting to sell to US consumers need to “play ball with the president of the United States.” His intervention followed a high-level Indian delegation’s visit to Washington led by the Indian Commerce Minister Piyush Goyal, where both sides discussed expediting a Bilateral Trade Agreement — negotiations that invariably include American demands for greater market access in retail.
Amazon’s deal has become the foundation of a profound strategic pivot for More Retail, which is quietly being reshaped in the global giant’s image. The core of the transformation is a shift from a simple brick-and-mortar chain to a hybrid logistics network. And this integration is already yielding results.
Nearly a quarter of More’s 45 billion Indian rupees ($540 million) in sales now flows through Amazon’s online platform. Stores integrated with Amazon Fresh, Amazon’s online grocer business, boast monthly sales of 5.6 million Indian rupees, a 60% uplift over their offline-only counterparts while maintaining identical 7.5% EBITDA margins. The plan is to accelerate this rollout to reach 3,000 stores, turning More’s physical locations into mini-fulfilment centres for Amazon even as the company’s employee costs have mysteriously declined from 9.4% to 7.9% of sales since FY20.
More’s second pillar is a deliberate push into India’s heartland, which Amazon has struggled to reach on its own. While rivals like DMart and Reliance Retail wage a costly war in hyper-competitive megacities, 70% of More’s 819 stores are in smaller, “upcountry” towns. Management presents this as a shrewd move into areas where organised retail penetration is a mere 6-11% and rents are 30-40% lower.
Yet it could also be seen as Amazon’s attempt to bide its time, particularly as quick-commerce giants Blinkit, Zepto and Swiggy Instamart race to set up thousands of dark stores in urban cities. It is a bet on a less-tested thesis about consumption in smaller towns where 65-70% of India’s incremental middle-income growth will emerge through 2028, per analyst hopes.
To lock in customers, More is leaning on a third pillar: a surprisingly effective loyalty programme. For an annual fee of just 199 rupees, members receive a 5% cashback on most purchases. The scheme has attracted 1.8 million subscribers who now account for nearly two-thirds of sales, spend 2,400 rupees monthly (compared to 1,200 rupees for non-members) and have a 94% renewal rate among high-value customers.
For More, this creates stickiness. For Amazon, it provides a rich stream of purchasing data from a demographic it cannot legally access directly.
Taken together, these strategies reveal a company becoming inextricably entwined with its American backer. More is effectively outsourcing its digital future to Amazon and betting its physical footprint on less-proven markets. In return, Amazon gets a proxy army in the battle against domestic behemoths, invaluable consumer data and the foundations of a nationwide supply chain positioned to capture the 31% annual growth More projects through 2031.
Should India yield to American pressure and relax its FDI rules — a prospect that becomes more likely with each bilateral trade negotiation — Amazon would be in prime position to consolidate control over an already integrated operation spanning 394 cities. The shoppers in Guntur may not know it, but every bag of rice they buy helps an American titan stock its shelves for the future of Indian retail, a future that Washington seems increasingly determined to help unlock.
]]>The fee exceeds what many of these engineers earn in a year, with the average H-1B salary at TCS running about $105,000. A typical engineer deployed to an American client site generates $150,000 to $200,000 in annual billings at roughly 10% operating margins, producing $15,000 to $20,000 in yearly profit. The $100,000 upfront fee eliminates five to six years of that entire profit stream. J.P. Morgan states bluntly that the move effectively “prices out the utility of H-1B as a source of labor supply.”
For all their many flaws, you have to concede: Indian IT companies have been preparing for this moment — to an extent. They have already pivoted away from the visa-dependent model, making the new fee less catastrophic than it would have been a decade ago. Combined initial and continuing H-1B approvals now represent only 0.2% to 2.2% of the total workforce at major firms, according to UBS, while new approvals alone account for under 0.4%. The “continuing employment” category inflates even these modest numbers because the same employee can generate multiple approvals when changing client sites or roles — a quirk (PDF) stemming from a 2015 regulatory precedent involving Simeio Solutions.
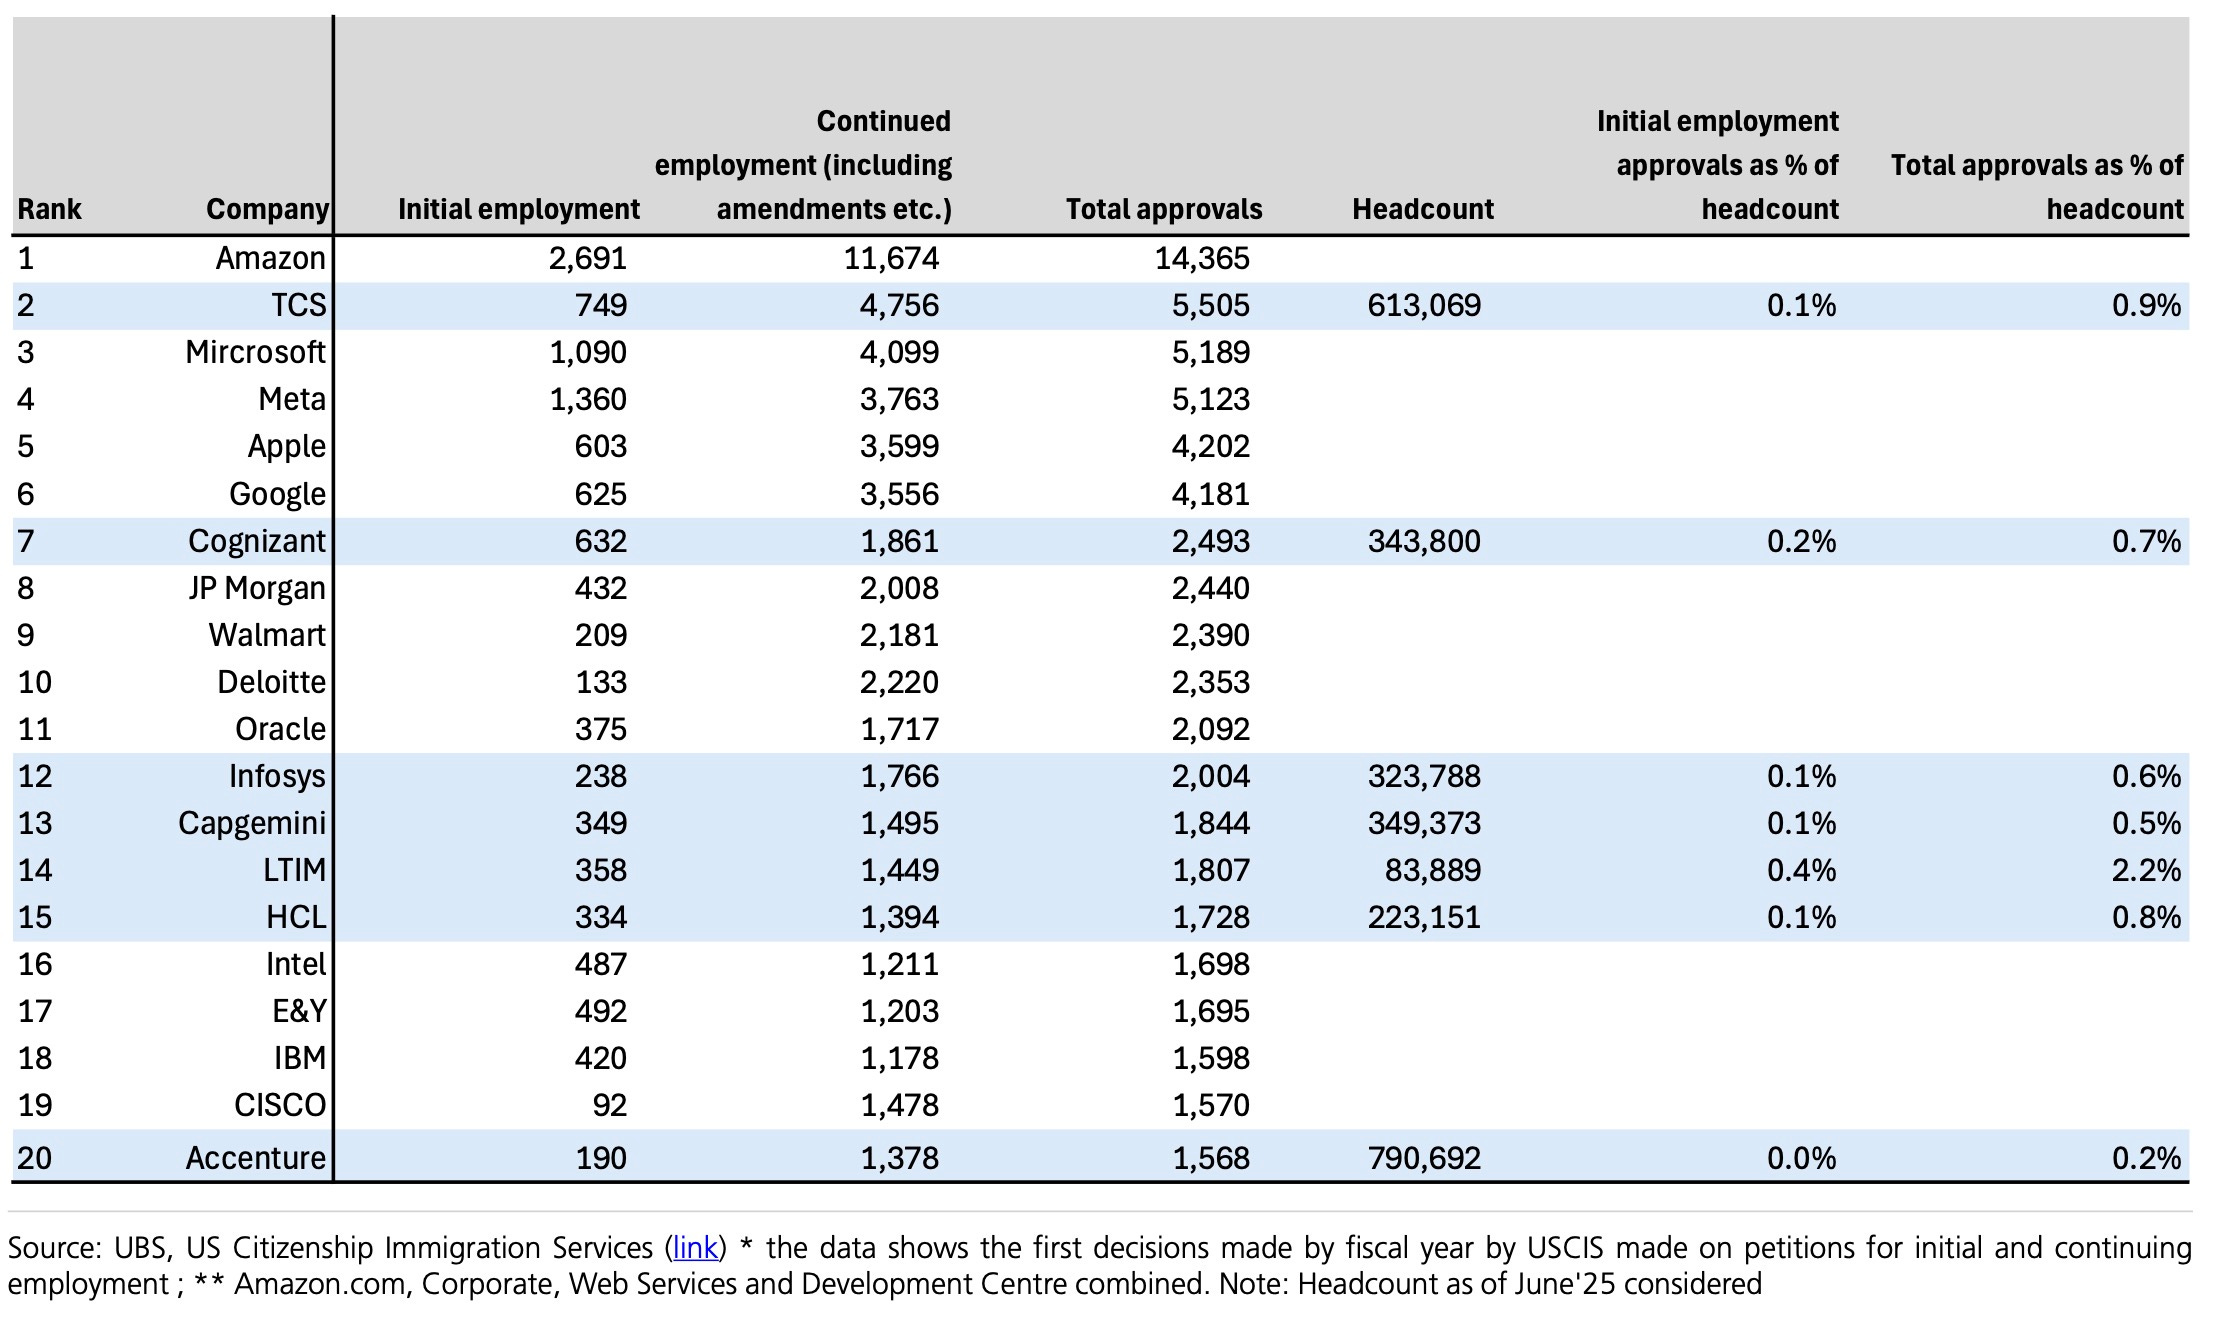
This reality allows them to accelerate the geographic arbitrage they have pursued for years — routing more work to India, Canada, and Latin America — rather than absorb the fee. Firms can maintain their existing visa holder base while letting normal turnover occur over three to six years, offsetting, per Morgan Stanley’s estimates, roughly 60% of the financial impact through increased offshoring and selective price increases. The net damage to operating profit would stay contained at around 50 basis points, or a 3% to 4% hit to earnings spread across the renewal cycle.
American wage inflation, rather than visa availability, emerges as the real pressure point. A 5% increase in on-site compensation could reduce profits by 4% to 13%, depending on each firm’s U.S. exposure and reliance on subcontractors, according to UBS. Companies that maintain large American workforces or depend heavily on third-party contractors face the steepest impact as local talent becomes scarcer and more expensive.
Contract renegotiations will determine how quickly companies can shift delivery models. Moving a project from on-site to offshore requires rewriting service-level agreements and adjusting security protocols. Revenue growth will likely wobble during this transition as management teams restructure their platforms while navigating a soft macroeconomic environment and potential AI-driven price deflation through 2026 and 2027, Jefferies warns.
European integrators have already demonstrated how the new model will function. Capgemini delivers 80% of its North American work from offshore locations while maintaining a 59% global offshore mix that increases by roughly one percentage point every three to six months. The company maintains competitive margins in North America despite minimal on-site presence, proving clients will accept remote delivery.
American corporations face their own staffing crisis that the new fee will compound. The Bureau of Labor Statistics projects 357,000 annual IT job openings on average between 2024 and 2033. Corporate technology budgets will absorb higher costs, whether through elevated local wages, premium visa fees passed on by vendors, or increased offshore delivery, guaranteeing expense inflation.
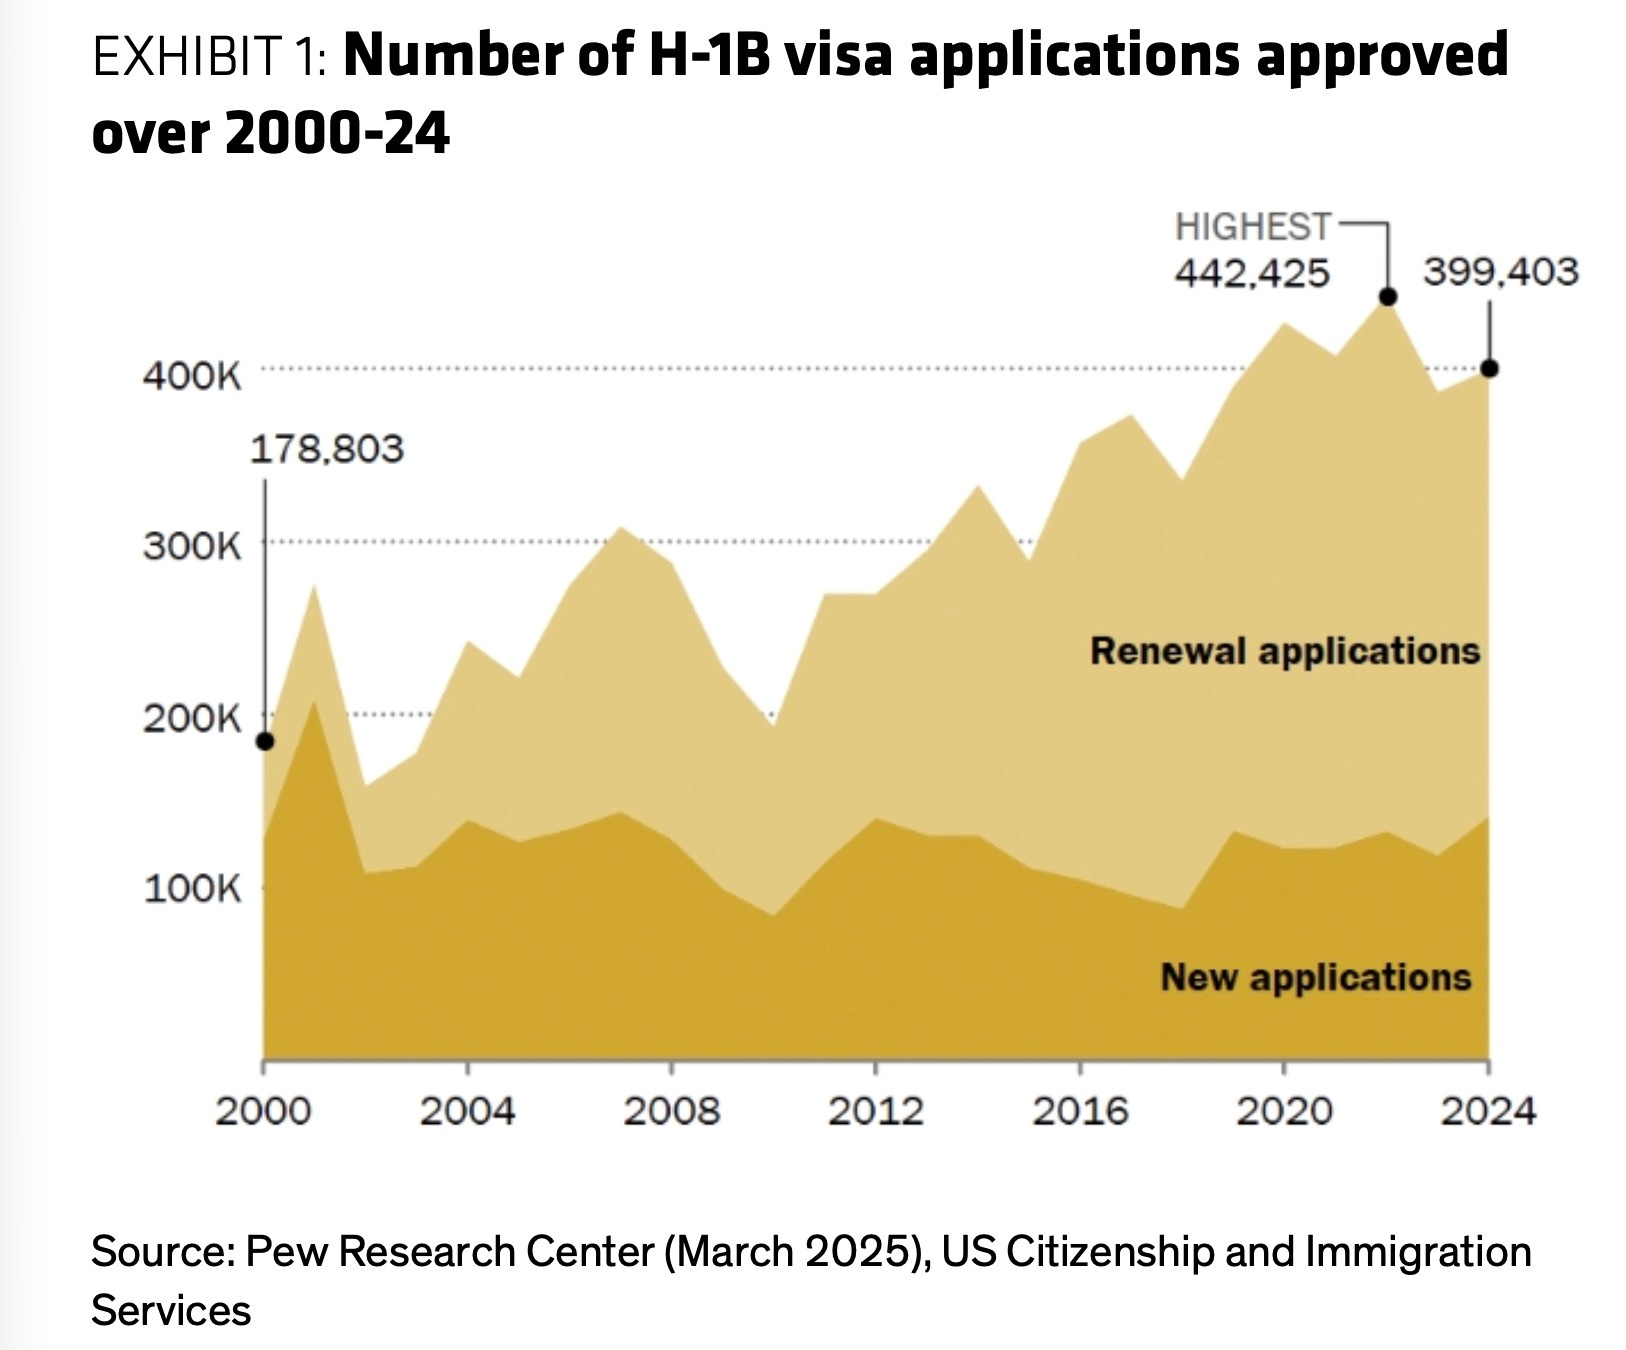
The policy could create an unexpected boost for India’s services export economy. The rational corporate response assumes a higher offshore delivery share, meaning more dollars flow to technology centers in Bengaluru, Hyderabad, and Pune. India’s services surplus expands while remittances from workers abroad — a $35 billion annual flow from the U.S. — potentially shrink, strengthening the current account.
Career trajectories within Indian IT companies will reshape. The traditional path of a U.S. rotation after two years becomes available to fewer engineers, replaced by faster progression within Indian offices and more complex projects routed directly to offshore teams. Companies might want to rebuild their talent proposition around technical challenges rather than international exposure.
Political resistance has mobilized. The U.S. Chamber of Commerce has filed formal objections, while technology giants lobby for modifications. The biggest H-1B users will push to soften the policy’s edges, though political pressure cannot eliminate the fundamental shift in delivery economics the fee creates.
Washington’s attempt to protect American tech jobs will likely achieve the opposite by accelerating the offshoring it meant to prevent. Companies will maintain minimal on-site presence while routing everything else to locations where talent costs less and visa fees don’t apply. The $100,000 fee becomes a tax on proximity in a scarce market, pushing work toward time zones rather than pulling workers toward clients.
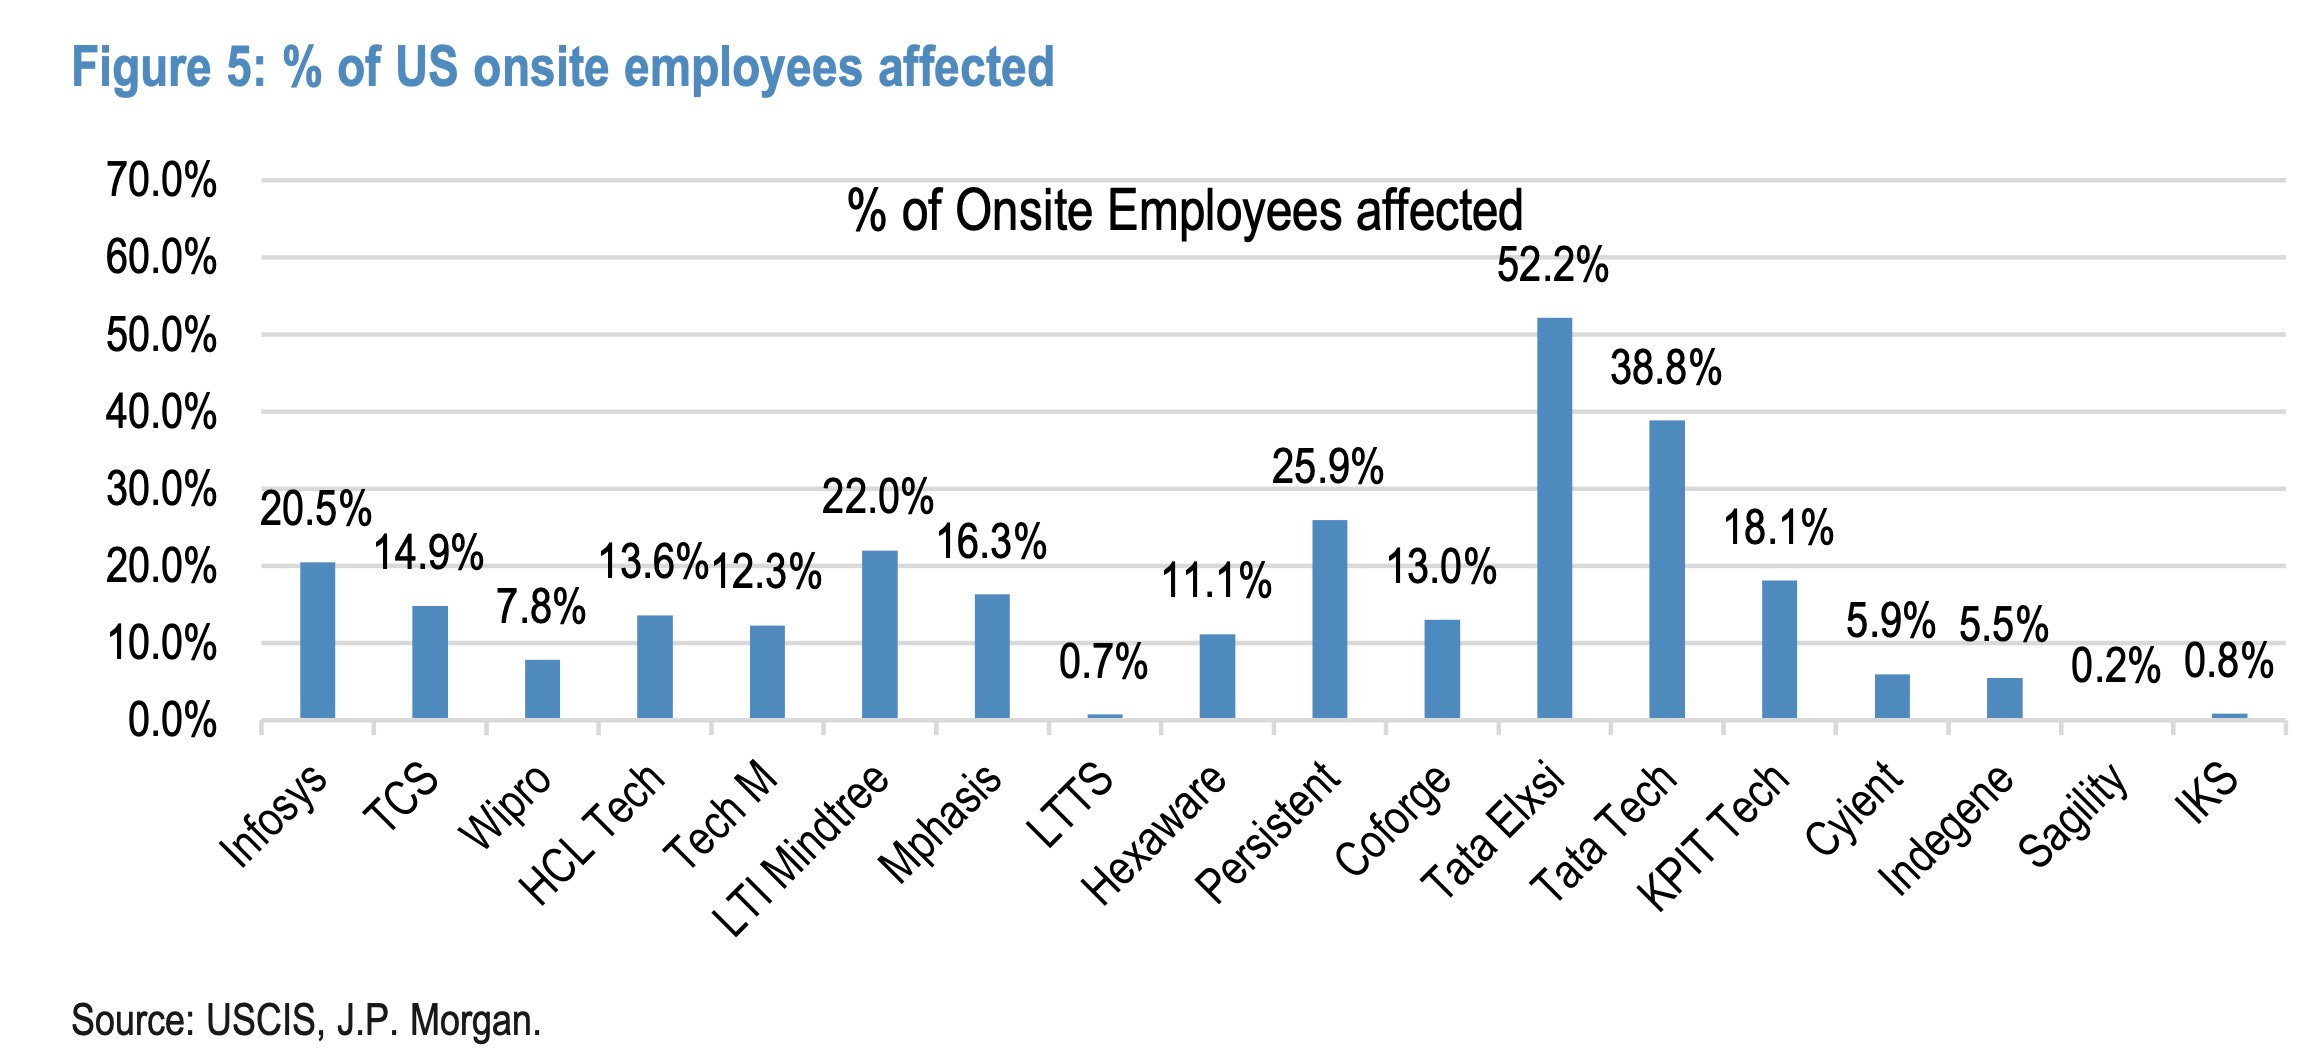
That model, a pillar of India’s current economy, is now facing a structural crisis. AI is methodically eliminating the very entry-level roles that served as the training ground for a generation of programmers and project managers.
This transformation is striking the Indian economy at a particularly notable moment. The IT sector, which employs 5.4 million people and contributes 8% of the country’s GDP, forms the very backbone of urban middle-class employment. Its upheaval coincides with the nation’s pressing need for mass formal employment.
India’s working-age cohort is projected to swell from approximately 980 million in 2024 to more than 1 billion by 2033, adding 8-9 million people to the workforce each year. They will enter a services-heavy economy that accounts for around 64% of Gross Value Added (GVA) and 42% of total employment.
What’s happening now isn’t a cyclical downturn but a fundamental rupture, most visible in the collapse of entry-level hiring. In the 2023 fiscal year, the top four IT exporters hired a combined 225,000 fresh graduates; by fiscal 2024, that figure had plummeted by over 70% to some 60,000.
To put this in perspective, TCS and Infosys combined added over 157,000 employees in the hiring boom of 2022 fiscal year, but that number fell to just 12,771 in 2025 fiscal year.
This hiring freeze is also visible in the overall headcount of the industry’s giants. For the first time in decades, they are shrinking — TCS seeing its workforce fall by over 13,000 in fiscal 2024 and Infosys shedding 25,000.
The driving force behind this disruption is AI, which targets the exact tasks that once served as the industry’s induction schools. Studies by firms like Accenture suggest generative AI could automate 30-40% of the work done by junior software developers and testers. Basic code generation, documentation and quality assurance are increasingly being handed over to AI assistants.
Persistent client demands for lower prices are forcing firms like TCS and Infosys to deliver traditional services with fewer people.
This collapse in junior hiring is accelerating a demographic transformation that has been underway for over a decade, fundamentally altering the age profile of the industry’s workforce. The share of staff under 30 at Infosys plummeted from 81% in 2010 to a projected 53% by fiscal 2025, according to an analysis by Jefferies. Baselines may vary, but the overarching story is consistent: the proportion of junior employees has contracted by roughly one-third in fifteen years.
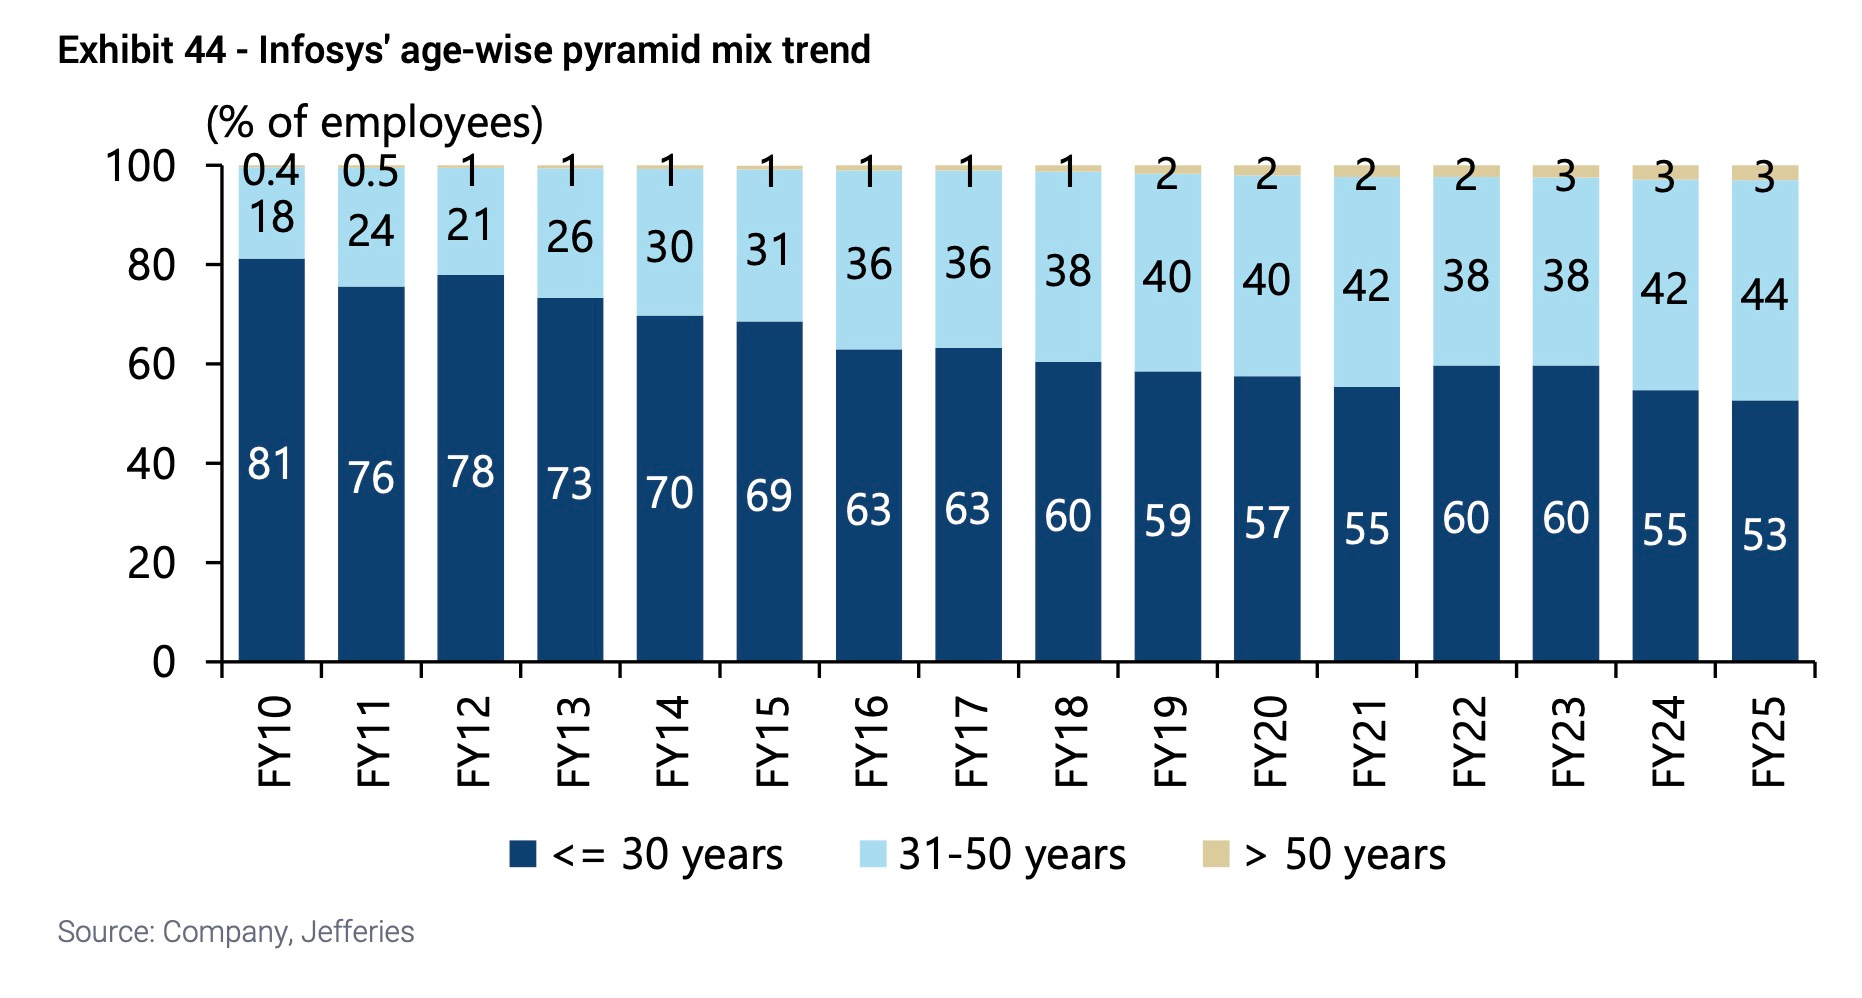
As recently as 2010-11, corporate disclosures reviewed by India Dispatch showed that 70% of employees at TCS were aged 30 or lower. At the end of fiscal 2025, that mix accounted for less than 48% of its employees in India. This youthful foundation has steadily eroded across the sector; Wipro reported 60% in that bracket by 2015-16, and HCLTech just 39.5% by fiscal 2020.
Even as AI is delivering productivity gains, a corresponding financial windfall for the companies themselves — at least most of the IT giants — is not materializing yet. The economics of the transition defy conventional assumptions about automation, with group EBIT margins projected to remain flat at around 20% through fiscal 2028, per Jefferies. This is largely because higher-margin service lines face intense pricing pressure while the business mix shifts towards higher-cost onshore consulting.
Future growth now appears almost entirely dependent on the expansion of AI-related services, which are forecast to grow at 15% annually but demand senior experts in client locations, not junior coders offshore. The market for non-AI IT services, meanwhile, is projected by Gartner to shrink by 1-3% a year, eroded by a cumulative 20% revenue deflation by 2029.
Nor do other business lines offer a significant refuge. Infrastructure management, for instance, provides only modest new efficiency gains of 5-10%, much of which is already given away in price concessions. In business process outsourcing, while some segments see high automation potential, the risk for Indian firms lies in broad back-office work, where roughly 35% of productivity gains are expected to be passed on to customers over five years.
Confronted by these pressures, leading firms are racing to remodel their businesses by converting internal AI tools into sellable platforms and shifting from pricing by the hour to pricing by outcome. Companies that remain dependent on the old model of labour arbitrage face the prospect of steady margin compression, as the cost advantage held by the IT giants erodes with every task that AI learns to perform offshore.
The consequences of this industry-specific shift have far-reaching macroeconomic implications for India, striking at a core pillar of its social contract. For years, an entry-level IT job was the primary pathway from a mass-market engineering college to middle-class stability. The hollowing out of these roles creates a severe mismatch in the labour market, where the unemployment rate for graduates already exceeds 13%, nearly three times the national average.
A material portion of the 8-9 million people entering the workforce annually is competing for a pool of just 50,000 net new IT jobs projected per year from FY26-28.
India’s policymakers now confront the uncomfortable reality that the sector which once symbolised the country’s ascent no longer functions as a mass employment engine. The alternative requires a massive national pivot towards labour-absorbing sectors such as construction and renewable energy, coupled with a reorientation of education towards AI-complementary skills. Failure risks stranding millions of educated youth between an automated service sector and an underdeveloped manufacturing base.
This Indian predicament also serves as a warning for other emerging economies. The Philippines confronts this in its call centres and Eastern Europe in its nearshoring operations, as automation eliminates the bottom rungs of the professional ladder.
The Indian technology sector may find ways to continue to compete globally, but the architecture that converted inexpensive graduates into middle-class professionals is being dismantled from the bottom up. The pyramid that once represented India’s formidable competitive advantage has become a monument to a model whose time has passed.
]]>That’s the blunt warning from investment research firm Bernstein that pulls no punches on what it sees as a dangerously naive policy stance.
India is staring down a strategic tech crisis... Indian policymakers appear blind to the dangers of their stance on U.S. tech dominance and predatory pricing in AI. India is rolling out the red carpet for US AI, letting them lock in share with unsustainably low prices, a playbook that was used in the past.
The American giants are already moving with devastating efficiency against India’s handful of homegrown efforts like Sarvam AI and Ola Krutrim. Perplexity Pro is available free for a year to the 350 million subscribers of telecom giant Airtel, while OpenAI’s ChatGPT recently launched an India-focused $5 a month subscription — compared to $20 in the U.S.
Bernstein analysts are also baffled by the misplaced enthusiasm they see among some Indians. When OpenAI, which is reportedly looking to set up a data center in India, announced the plans to launch a new office, it was met with another round of excitement — “as if Open AI will hire all Indians at hefty salaries,” the firm wrote in a note to clients Thursday. Bernstein analysts pour cold water on this excitement, dismissing it as a “repeat of the 90s” and arguing that the hype misses the fundamental power imbalance.
Anyone, we repeat anyone, can build a data center... This is the start of the dominance of US tech in Indian AI environment ensuring Indian entrepreneurs do not get a fighting chance to stay relevant. They will run on the sidelines - piggybacking on the US foundation models or maybe even the Chinese.
This leaves Prime Minister Narendra Modi’s calls to India to build its own platforms sounding, in Bernstein’s words, “almost wistful.”
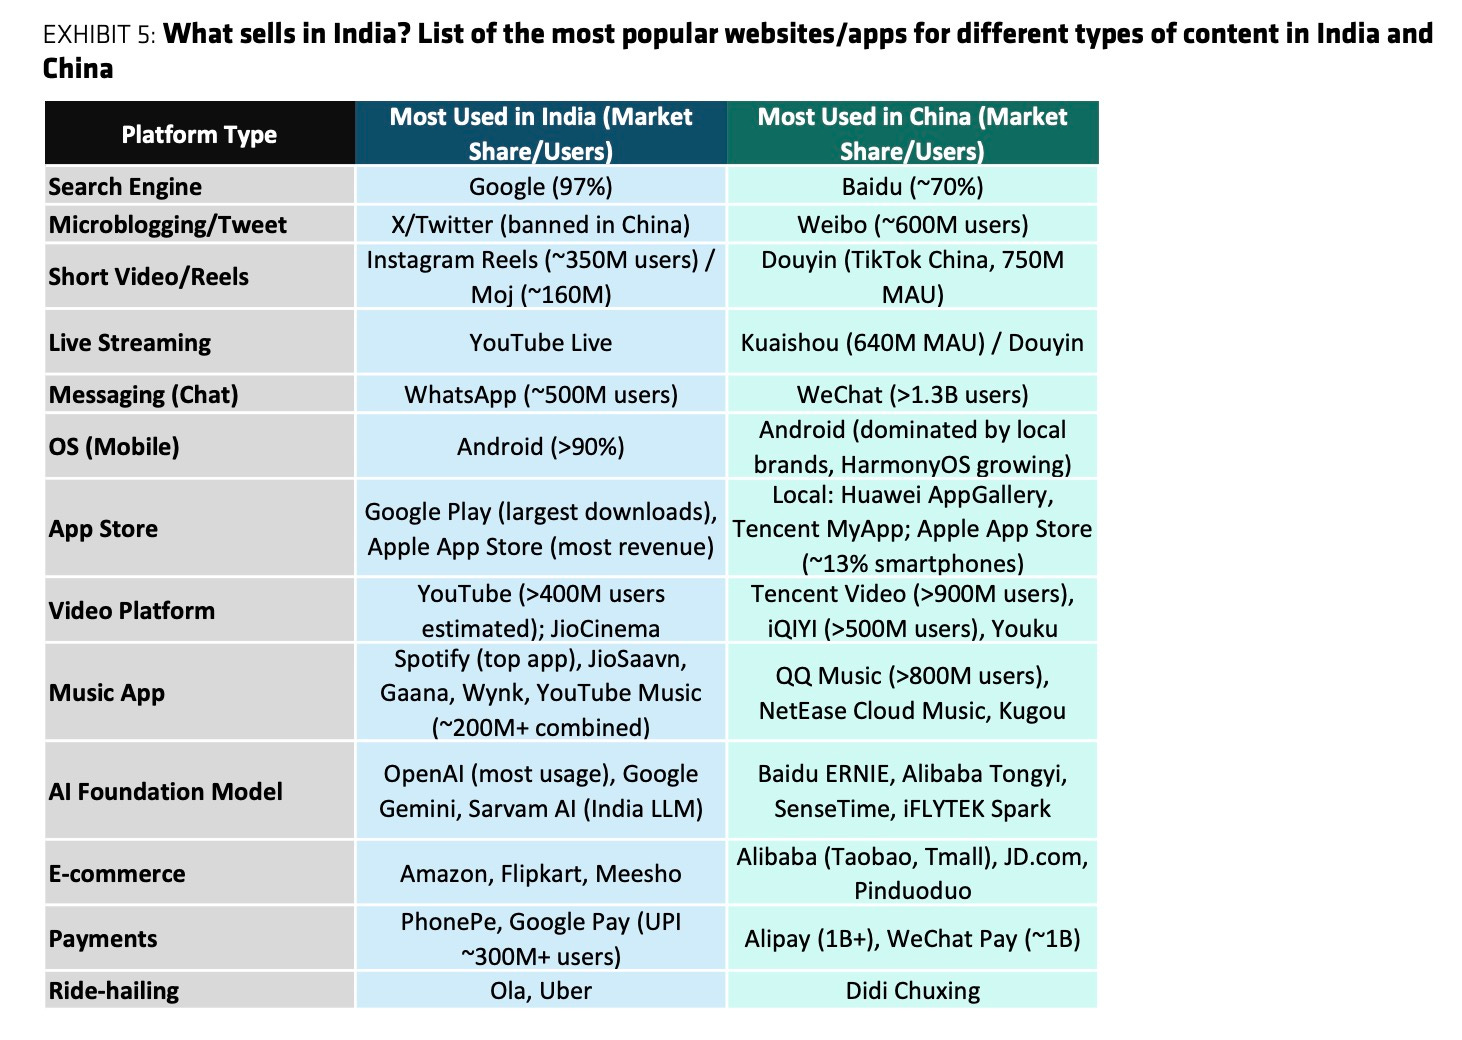
The analysts point to an uncomfortable reality where every major digital platform in India — search, messaging, social media, and commerce — is already under U.S. control. They highlight what happened after the TikTok ban: “it wasn’t an Indian challenger that rose, but Instagram swept up millions of users.” (YouTube did well, too.)
India’s AI ambitions are lacking on multiple fronts, including funding. Between 2013 and 2024, private AI investment in the US hit $471 billion, with China at $119 billion, compared to India’s $11.29 billion. The Indian government’s much-touted AI fund is just $1.2 billion, while OpenAI had already secured $13 billion before launching ChatGPT.
Adding insult to injury is what Bernstein calls a regulatory “double standard.” While foreign tech gets the red carpet treatment, local innovators face “crushing rules and government-led ‘tech stacks’ that make private business unviable,” with fintech cited as the prime example of domestic dreams destroyed by regulatory overreach.
Venture capitalists in India have coalesced around the view that local founders should build applications rather than foundational models, a strategy that Bernstein says carries the risk that specialized vertical solutions become “ineffective and not worth the extra money” once global tech giants acquire sufficient sector knowledge to replicate their functionality.
The analysts warn that Indian tech continues riding “the wave of labour arbitrage” — the same model that kept IT services from ever making “the leap to successful products” and now leaves them “staring down the barrel of AI-driven disruption.”
With signs of India-China relations warming and the potential re-entry of Chinese tech giants, Bernstein spells out the sobering endgame: India risks being “reduced to a mere digital marketplace, not a creator,” locked in a commoditized market where local players are perpetually dependent on the very behemoths they claim to compete with, in what the analysts call “certainly not where one expects to see a future top economy in the AI race.”
]]>This small decision, repeated millions of times a day across the country, is at the heart of a major power shift in India’s trillion-dollar consumer market. Retailers like Reliance Retail, India’s largest retail chain, and discount supermarket chain DMart are no longer content to be middlemen. They are aggressively launching their own brands in a direct challenge to global giants like Unilever and Nestle.
Seizing on a market with surprisingly few dominant national brands for its size, India’s retailers are using their control over distribution to build their own consumer-goods empires. In a country with 1.4 billion people, only eight consumer brands top $1 billion in revenue, per Bernstein’s count, compared to China’s dozens or Brazil’s strong regional player base. The ten largest consumer-goods firms in India reach just 4% of their addressable market — a vacuum that retailers are now racing to fill as their share of spending climbs toward a projected 40% by 2035.

This transformation diverges fundamentally from the gradual private-label evolution that unfolded across Western markets, where penetration in Europe is now 38% and 19% in the U.S. Those levels emerged over decades. In contrast, private label penetration remains low in other developing markets like Latin America (2.3%) and China (around 5%), where established manufacturers maintain dominance.
India’s retailers are leapfrogging this timeline. This shift also occurs against a backdrop where China achieved retail modernization differently, maintaining strong national brands while growing e-commerce to nearly 50% of sales. India’s retailers are using physical store control as their primary weapon.
The economics of this shift decisively favor the retailers. Traditional fast-moving consumer-goods companies in India typically spend 5-10% of their revenue on advertising and promotions, and another 4-5% on sales and distribution, plus royalties and corporate overhead.
Retailers building their own brands sidestep nearly all of these costs. They convert those savings directly into lower shelf prices, with their store brands commonly priced 30-40% below national equivalents, a magnitude that surpasses even mature Western markets where price gaps average 20-28%. Shopper data confirms the strategy is working: shopping carts heavily weighted toward private labels save customers roughly 35-45% compared to the maximum retail prices of national brands.
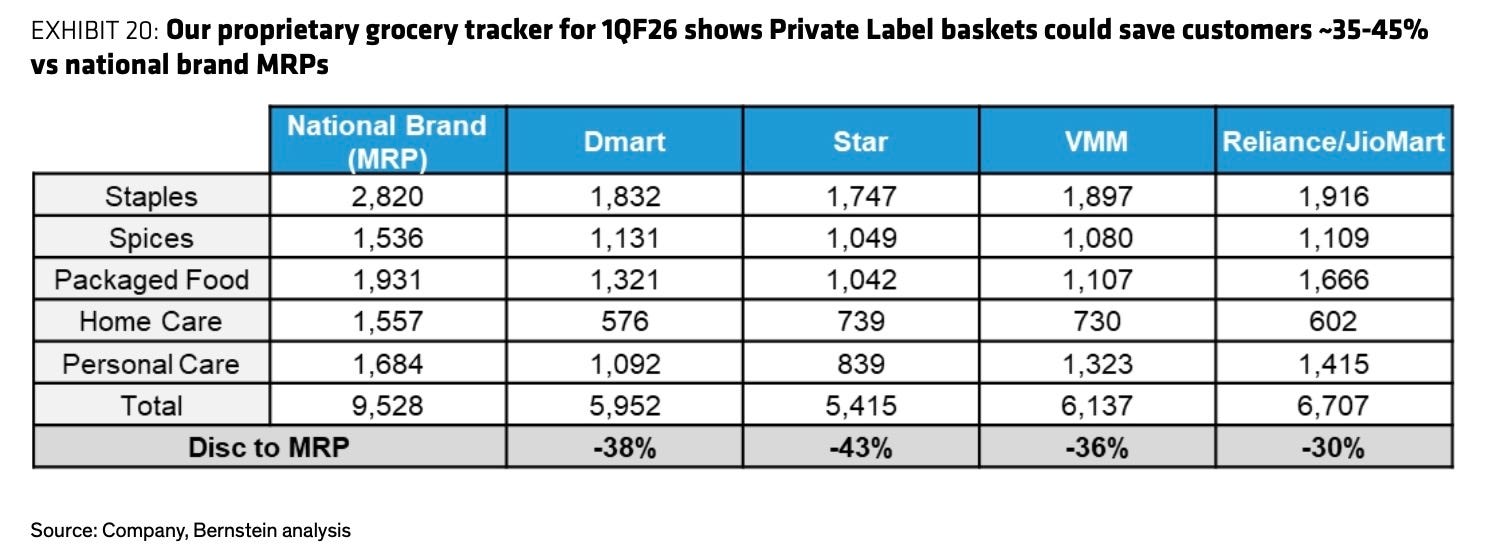
The savings for consumers vary by what they buy and where they shop. The deepest discounts, approaching 60%, are in home care products sold in modern supermarkets, while packaged foods see gaps in the mid-30s. The hierarchy is clear: brick-and-mortar superstores offer the biggest private-label discounts, followed by e-commerce, with quick-commerce platforms offering the slimmest savings.
Retailers aren’t just putting cheaper products on the shelf; they are engineering the entire price architecture of their aisles to favor their own brands. When a chain introduces a private-label line, it often reduces the promotions on competing national brands in the same aisle.
This tactic deliberately creates a wider price gap, making the store brand a more compelling value choice. The strategy allows retailers to capture more margin from shoppers who remain loyal to the big brands while making the switch to a private label almost irresistible for everyone else.
No company has embraced this strategy more aggressively than Reliance Retail. The conglomerate spun off its consumer brands into a separate unit, Reliance Consumer Products Limited (RCPL), signaling its ambition to build a standalone consumer-goods business.
In fiscal year 2025, the RCPL portfolio hit roughly ₹115 billion ($1.31 billion) in revenue, a scale that already rivals several publicly listed FMCG companies. Two of its new brands, Campa soft drinks and Independence staples, scaled rapidly, each exceeding ₹10 billion ($114 million) in sales.
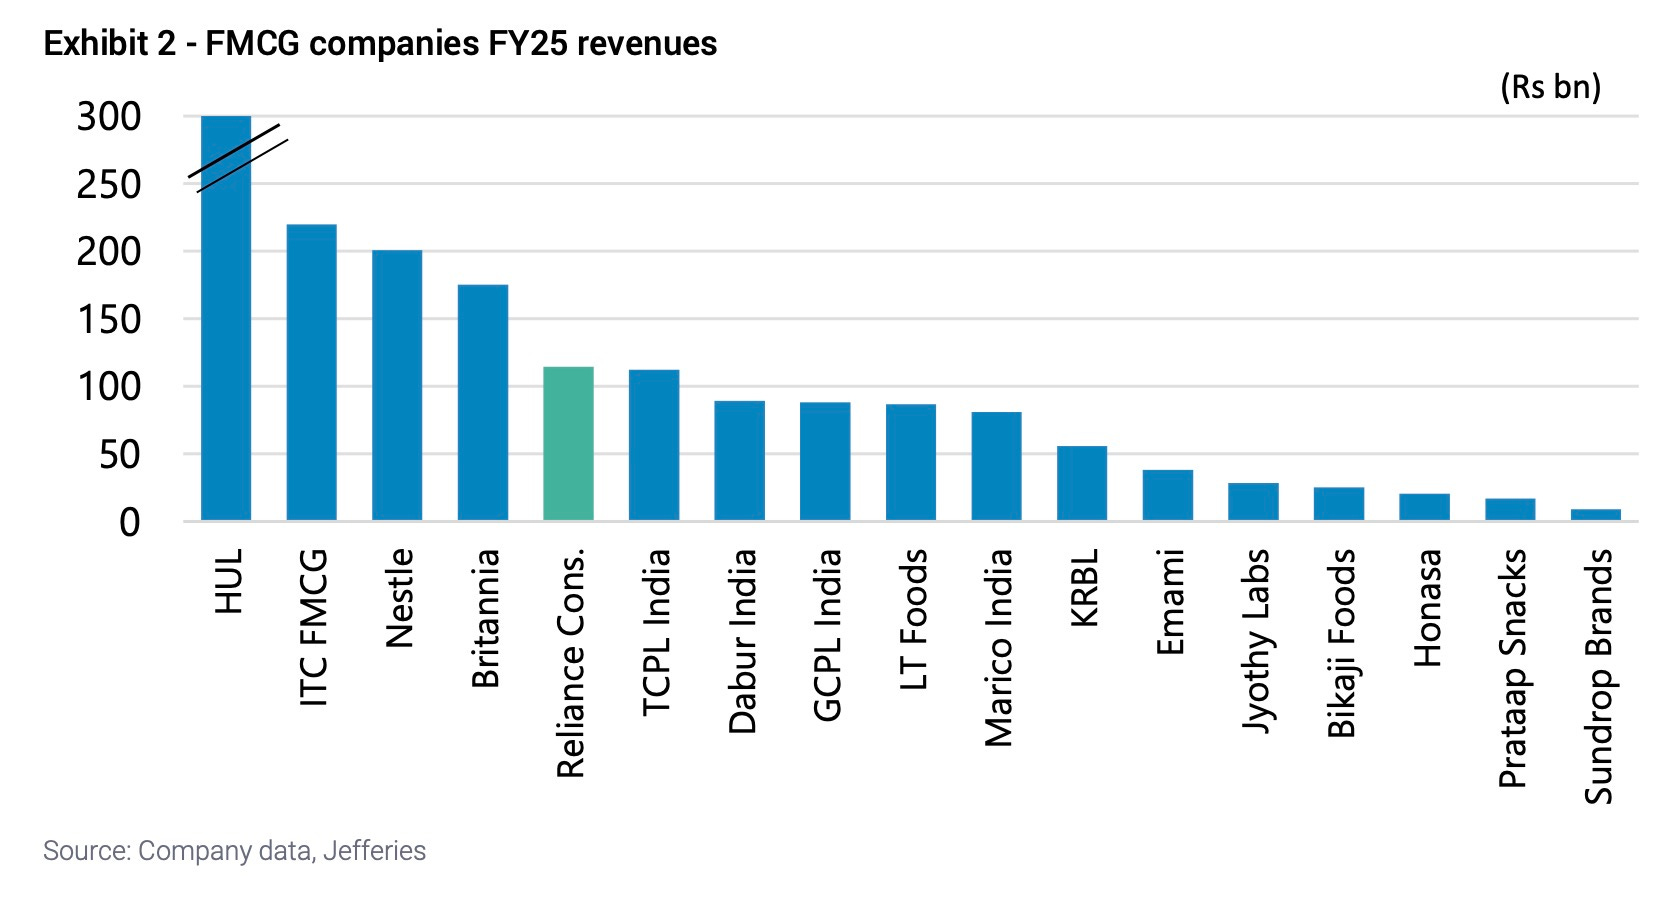
To put its scale in perspective, these consumer brands now account for about 7% of Reliance Retail’s core revenue and 12% of its grocery sales. To lead the charge, the company hired a former top executive from Coca-Cola, a clear signal of its brand-building ambitions.
Yet the strategy holds a key contradiction. To become a true “brand house” instead of just a “house brand,” RCPL must take on the very advertising and distribution costs its private-label model was designed to avoid. As long as its products are sold mainly through its own captive channels like JioMart, its costs remain artificially low. Success in selling through India’s millions of mom-and-pop kiranas and rival chains will mean its cost structure will inevitably begin to look more like a traditional FMCG company’s.
At the other end of the strategy spectrum is DMart, which uses its private labels as tools for speed rather than profit engines. The discount chain focuses on an everyday-low-price strategy for all brands, using its own grocery products simply to drive foot traffic and increase the number of items in each basket.
DMart’s gross margins hover near 15%, lower than competitors that push private labels harder. Yet its revenue per square foot is significantly higher. For DMart, a private label is a lever to accelerate how fast inventory sells, not a replacement for the price discipline that drives its business.
The contrast is clearer when looking at how much of a store is dedicated to its own brands. At chains like Star and Vishal Mega Mart, store brands can generate over 70% of sales in some categories. At DMart, that figure is kept around 20-25%. Analysts warn that pushing private labels too hard can alienate shoppers looking for familiar names and that store brands rarely succeed in creating entirely new product categories.
Retailers can compete so effectively on quality because their products often come from the same factories that make the famous national brands. Contract manufacturers that produce coffee, biscuits and instant noodles for leading companies frequently run the same production lines for retailer-owned labels. In a market where packaging often matters as much as advertising, this blurs the line for consumers and allows retailers to offer comparable quality for a much lower price. In taste tests cited by Bernstein, private labels frequently scored at or above their well-known national counterparts, demolishing the quality-based justifications for premium pricing.
For shoppers, the final calculation is the total bill. An analysis by brokerage Bernstein of a sample basket, including delivery or travel costs, showed DMart was the cheapest at ₹6,101, followed by e-commerce player Flipkart at ₹5,516. A comparable quick-commerce basket cost ₹7,764, reflecting fewer private-label options and a focus on convenience over price.
Furthermore, retailers like DMart have another quiet advantage: format economics. By often owning its store locations, DMart has lower long-term occupancy costs, which helps it sustain low prices and turn over stock rapidly. On digital platforms like JioMart, the strategy is different, using dynamic pricing to nudge shoppers toward its own RCPL brands. In one example, it launched a 200ml cola for ₹10, explicitly resetting consumer price expectations in a market where rivals were anchored at ₹20 for 250ml.
India’s consumer market remains oddly under-branded at the top and over-fragmented at the bottom. This structural anomaly creates opportunities for retailers to fill the vacuum themselves. The comparison to China is instructive, as that market developed powerful national champions before modern retail achieved significant penetration, whereas India’s simultaneous retail modernization and brand vacuum creates the conditions for retailers to pre-empt manufacturer consolidation entirely.
As organized retail continues to grow, the companies controlling the shelves will decide whether growth flows to the new brands they own or the old brands they stock. The trade-offs are significant. Pushing store brands too hard risks losing shoppers, but not pushing them hard enough leaves profits on the table.
Investors and analysts are watching key signals to see if the retailers succeed. First, if Reliance’s RCPL becomes a true brand, its revenue from its own stores should paradoxically fall as it wins on the shelves of its rivals. Second, its cost structure must start to resemble that of its FMCG competitors. Third, the significant price gap between store brands and national brands must remain.
In India’s fast-growing formalizing economy, the gatekeepers of distribution are becoming the new kingmakers, deciding not just which brands survive, but which ones need to exist at all. The question is whether shoppers will ultimately reward the builder of brands or the builder of the cheapest basket.
]]>To become rich before it finishes growing old, China would now need a breathless sprint of 32% annual GDP growth, while India faces a gruelling marathon, requiring a more plausible, though still demanding, 10.4% sustained growth rate over 35 years.
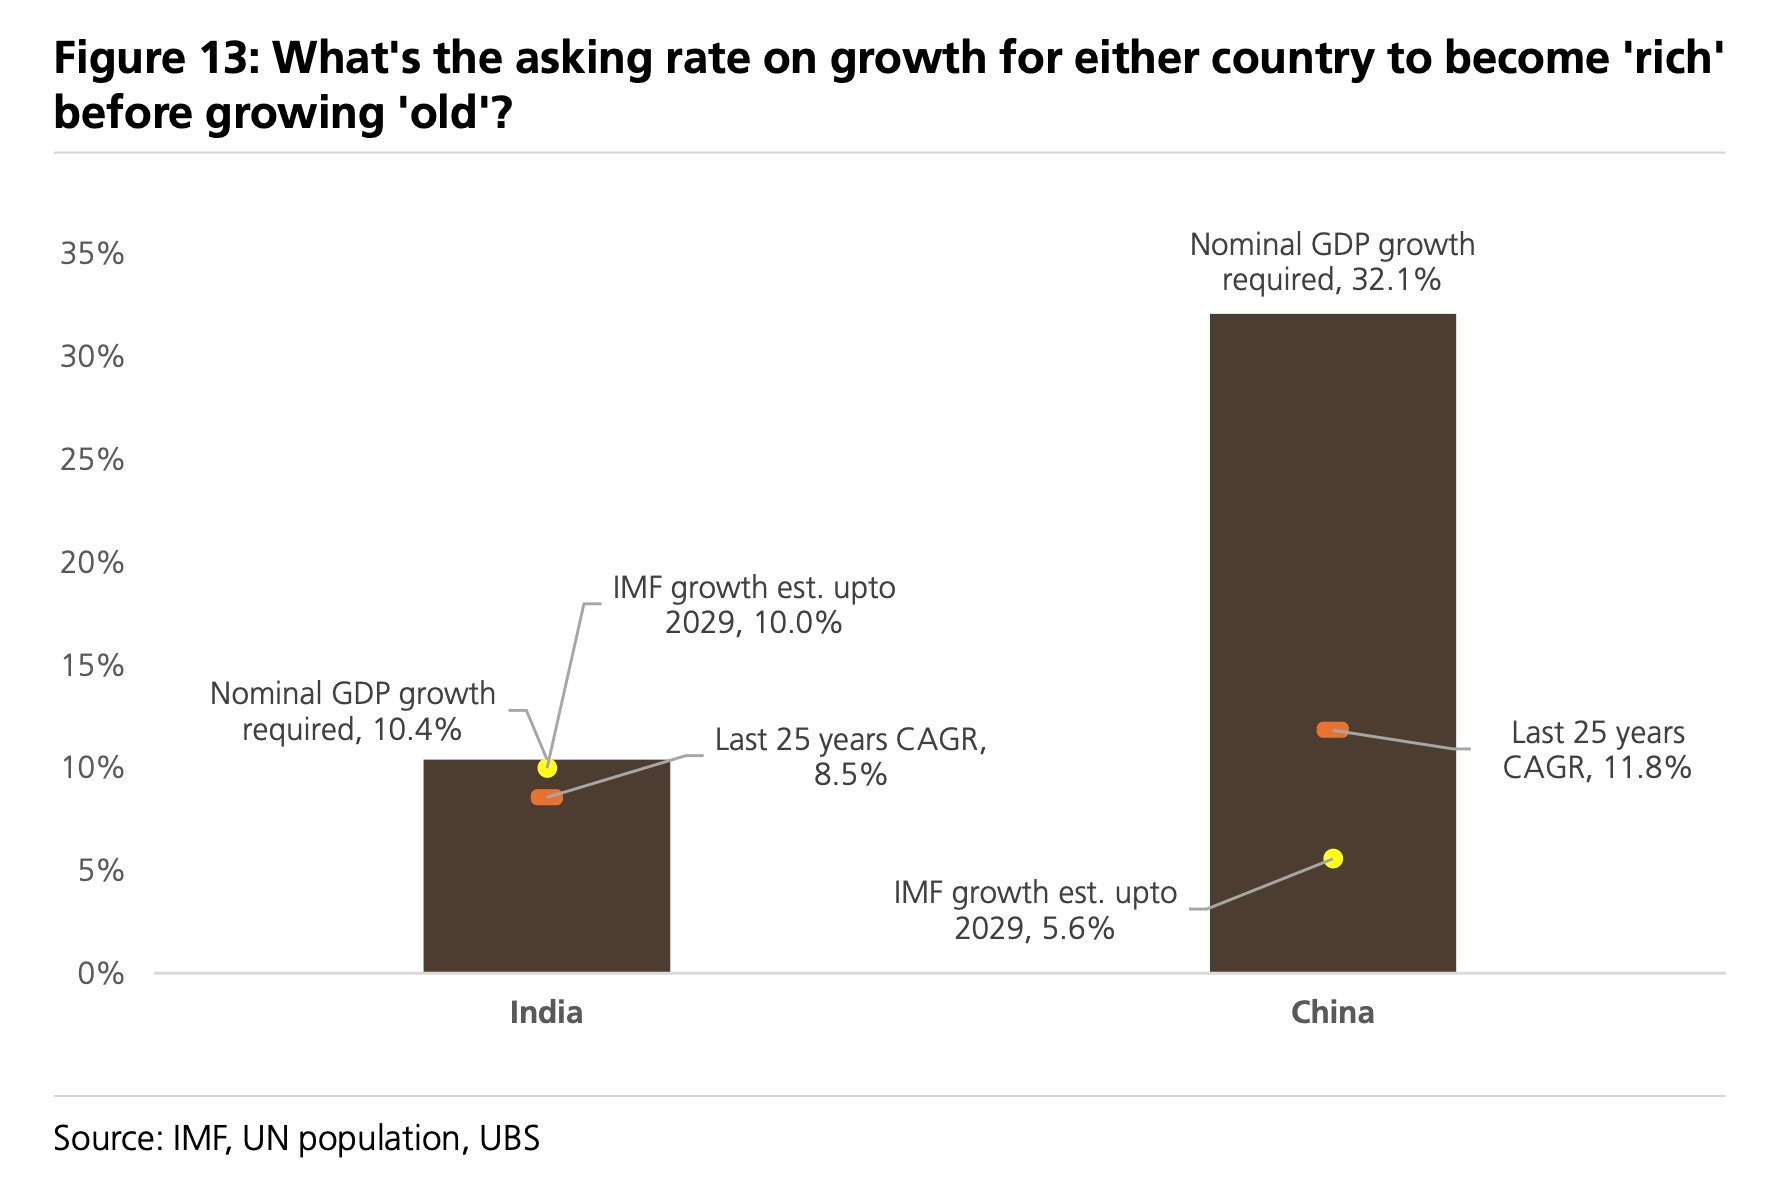
China’s compressed dilemma mirrors what is gripping the developed world, where Europe’s share of population over 65 is on track to hit 30% by 2050, up from 8% in 1950. Raising retirement ages — what economists describe as the closest thing to a silver bullet — faces older voting blocs, who now make up roughly 40% of those who turn up at the polls in European elections. In the U.S., what J.P. Morgan analysts term a “Social Security cliff” looms by 2033, when the system’s trust funds are projected to be exhausted, and hopes that productivity miracles (powered by, hopefully AI) will quietly square this circle look optimistic, leaving much of the rich world and North Asia out of time.
India’s working-age population is set to rise from 67.5% in 2021 to 69.2% by 2031, while the total dependency ratio — the number of children and retirees each worker must support — is projected to fall from 48.2% to 44.1%, with the median age nationwide projected to be just 34.5 in 2036, keeping a youth bulge flowing through the labour market for years to come.
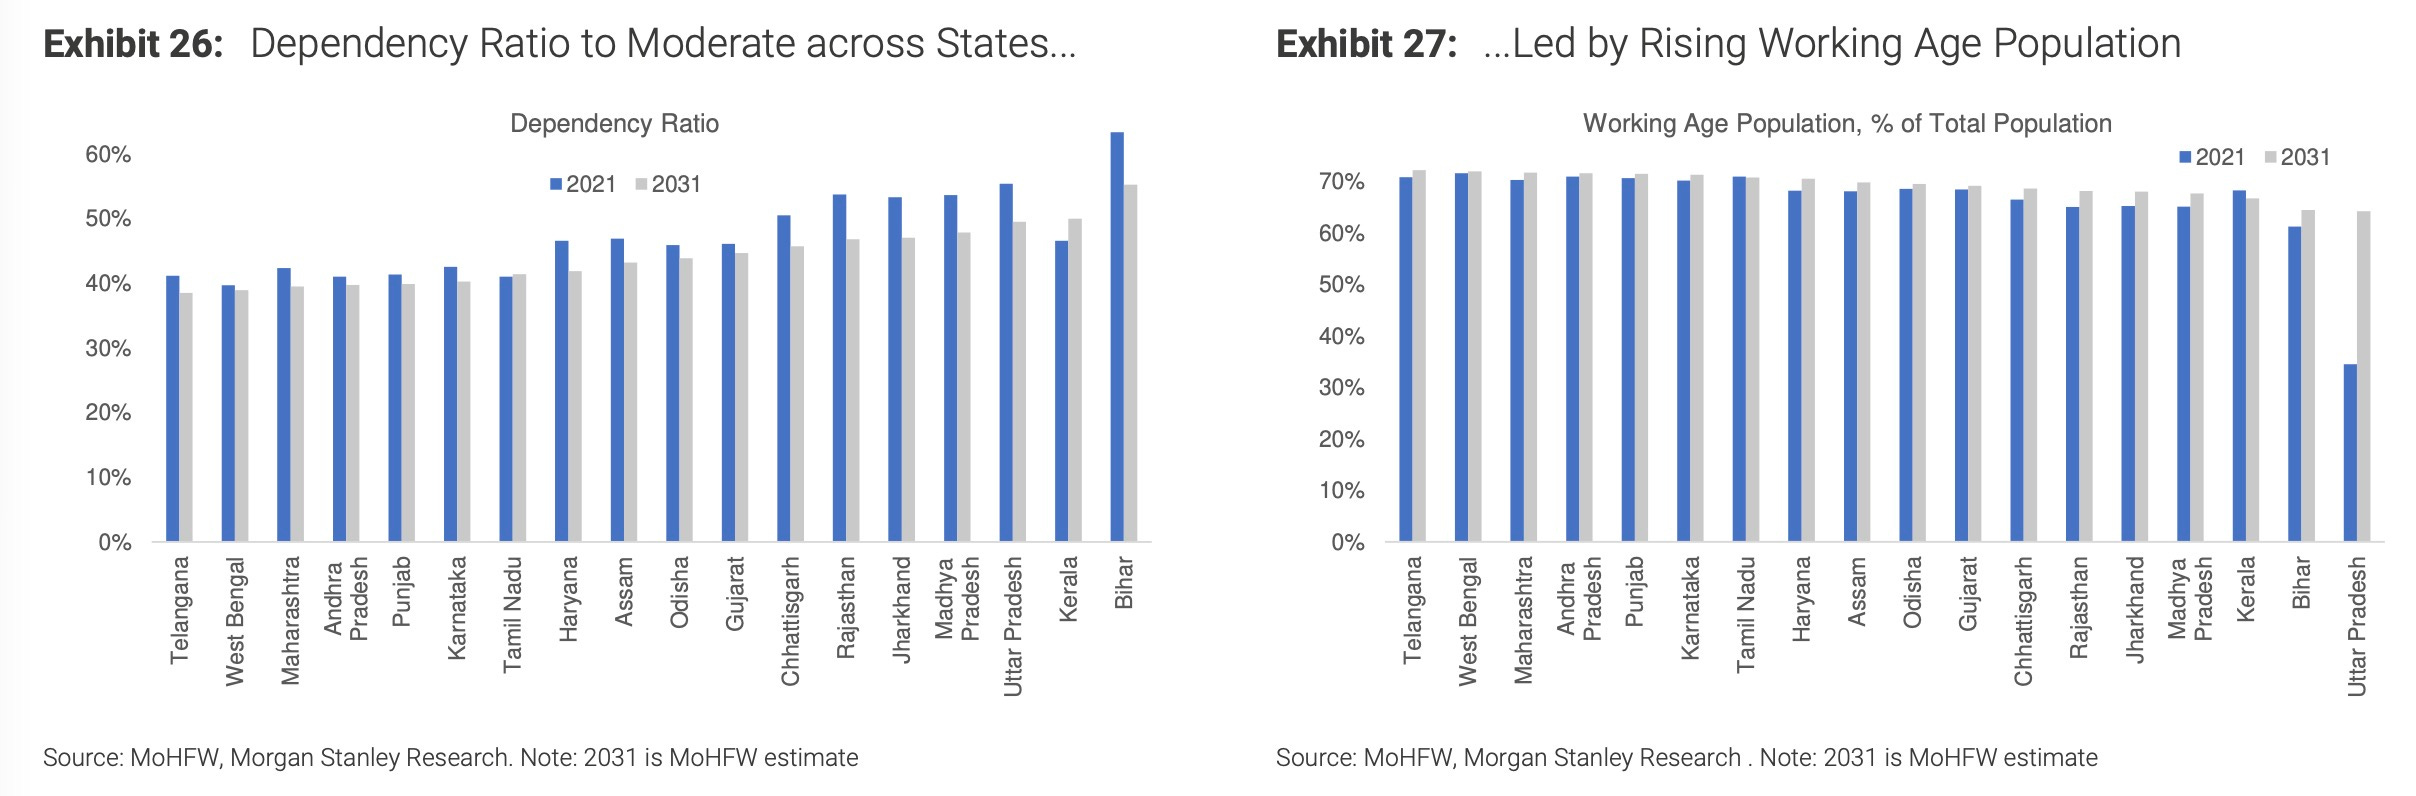
Yet for all this potential, the dividend remains mostly option value, nowhere more evident than in the labour-force participation rate for women, at roughly 42%, which languishes far below the 79% rate for men, leaving an extraordinary amount of economic potential untapped. That this figure is not a ceiling is proven by states like Chhattisgarh, where female participation reaches 59.5%, while the national gross-enrolment ratio in higher education sits at only 28%, against a 50% goal.
India is not one demographic story but a portfolio of different futures, with states ageing at vastly different rates that create powerful internal economic logic. By the mid-2030s, Tamil Nadu’s median age is projected to be around 40.5, while Bihar’s will be closer to 28, a gap that raises the return on inter-state migration and encourages capital to chase younger labour inland. While Telangana boasts India’s highest GDP per capita at $4,633, it is states like Uttar Pradesh and Chhattisgarh that have shown the most progress in recent years.
The world’s next great cohort, Generation Alpha (born 2010-24), will come of age in an era of widespread population shrinkage, and India’s share of that cohort, at roughly 18%, matches its share of humanity, with its age pyramid overlapping with Alpha’s prime working and spending years. The right comparison is not China’s factories-plus-youth model of the 2000s; India enters the Alpha era as a services-heavy economy with lower female participation and schooling levels than China had at its manufacturing-led moment.
As age-related spending rises in the West, policy is tilting toward preserving fiscal space, directing capital toward economies where labour supply is still growing, particularly as the global support ratio — the number of workers per senior — is expected to fall to under four by 2050, from over nine in 1997, putting a premium on labour-rich economies. India’s working-age population has already surpassed China’s, a structural advantage that matters when the world is short of growth.
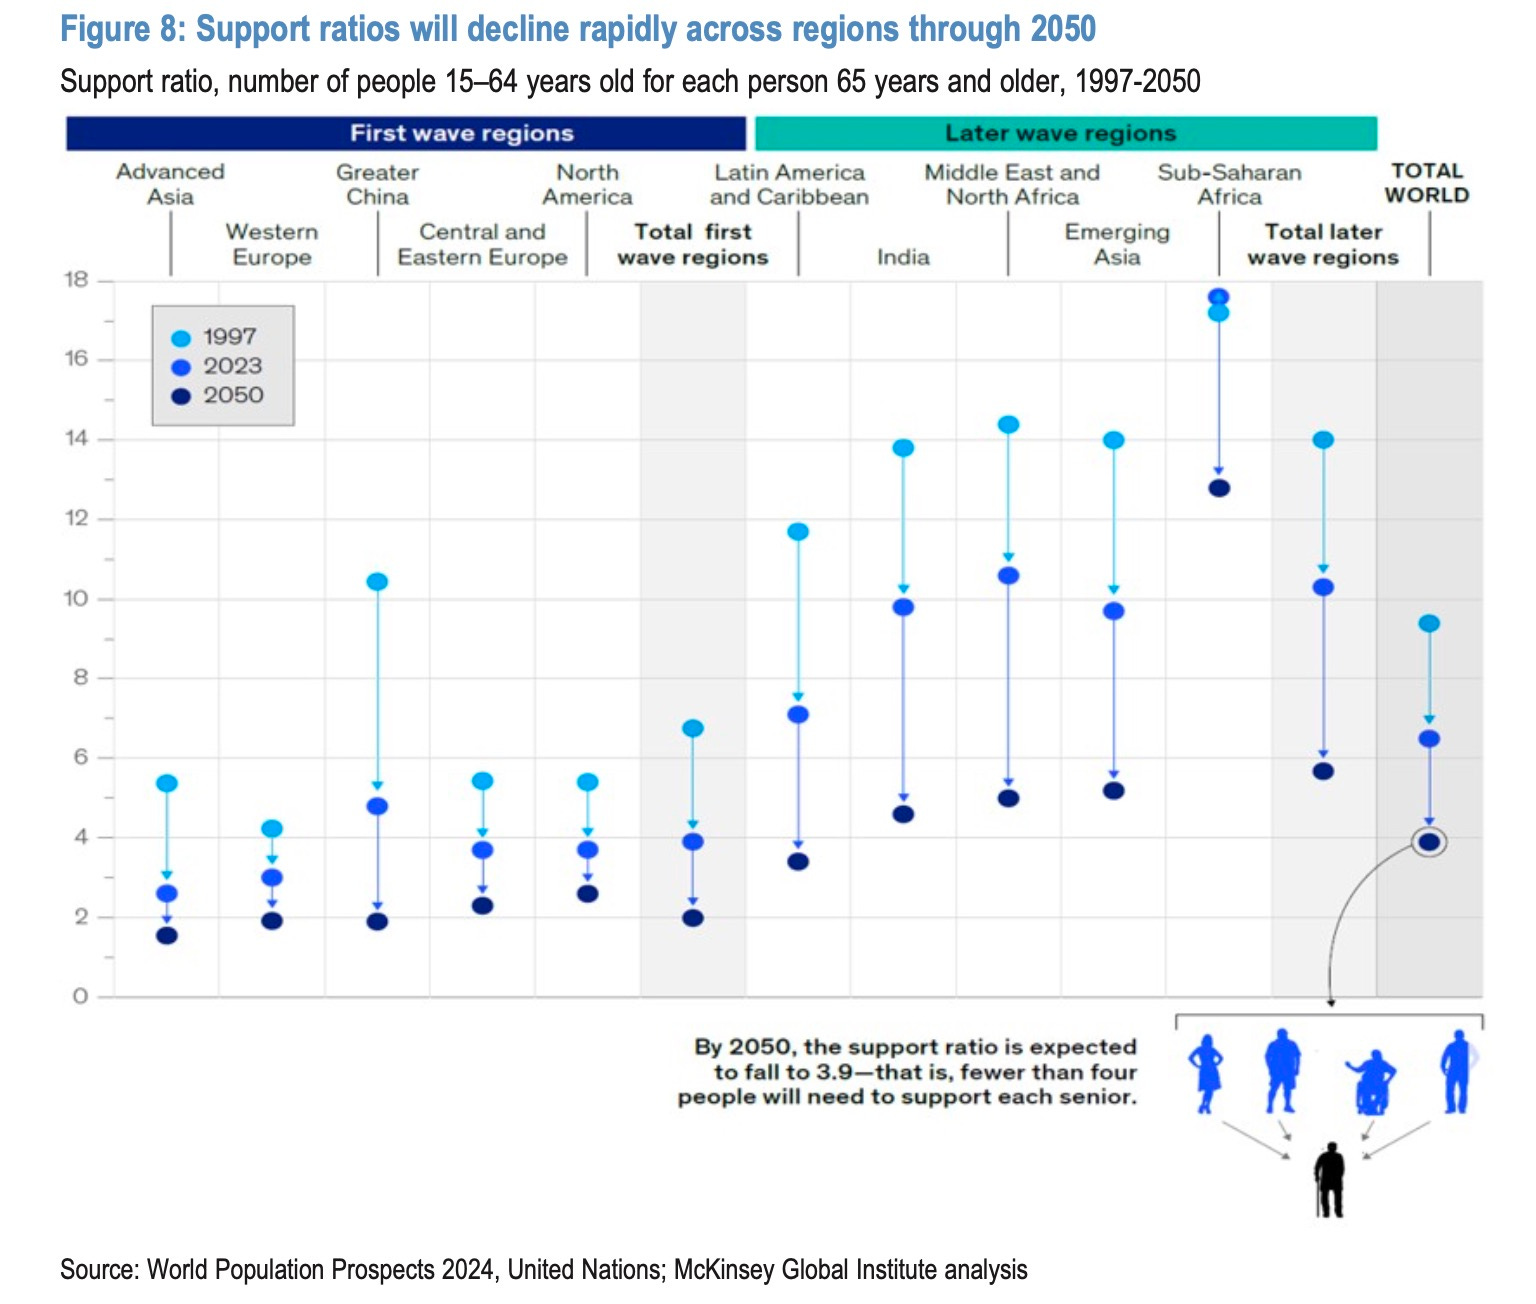
While my recent story on India’s electronics manufacturing was critical, highlighting how its deep reliance on Chinese technology makes the “China-Plus-One” strategy seem more like establishing a subsidiary than a true rival, looking at the situation through the lens of time offers a brighter perspective. India’s unique, decades-long demographic runway provides the crucial period needed to absorb this expertise and build indigenous capabilities.
None of this absolves India from the need for execution. The policy checklist remains urgent: boost female participation, push higher education completion, speed up formal urban job creation, and treat health as growth infrastructure, but the real demographic advantage is temporal. The West and China are grappling with the mathematics of dependency now, while their politics make textbook fixes slow and partial, whereas India’s fiscal pressures from ageing will come later, and between now and then, the country can do something most of its peers cannot: use three unhurried decades to build what others must fix in compressed time while their electorates resist.
]]>