| CARVIEW |
Alaska
According to the 2020 U.S. Census, Alaska’s population of approximately 733,000 is 59% White (alone), 15% American Indian/Native Alaskan (alone), 12% multiracial, 7% Hispanic, and 6% Asian (alone). Given the substantial European ancestry among Hispanics, multiracial individuals, and American Indian/Native Alaskans, the overall proportion of European ancestry in Alaska is estimated at around 75%, comparable to the U.S. national average. Based on our computations, Alaska’s average Academic Achievement Quotient (ACHQ), derived from NAEP and PIAAC test scores, is 99.42, also near the U.S. average.
Academic achievement disparities by racial and ethnic groups in Alaska mirror those in the contiguous United States. NAEP main assessments (2015, 2017, 2019, 2022) for non-English language learners reveal an average math achievement gap of d = 0.93 standard deviations between White and American Indian/Native Alaskan students. IQ testing shows similar disparities. Grigorenko et al. (2004) administered the Cattell Culture Fair Test and Mill Hill Vocabulary Scale to 261 Yup’ik students (grades 9–12) in Alaska. As reported by Lynn (2016), the group scored an equivalent of IQ 86 on the non-verbal test and IQ 77 on the verbal test.
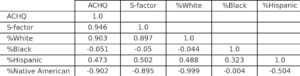
County-level data from the Stanford Education Data Archive indicate strong negative correlations between the percentage of American Indian/Native Alaskan residents and both ACHQ and an S-factor index based on rates of adults without a high school diploma, uninsured individuals, unemployment, SNAP recipients, and those living below 150% of the poverty line. These correlations persist after controlling for the percentage of Asian and Pacific Islander residents. Table 1 summarizes partial correlations between self-identified racial/ethnic (SIRE) percentages and both ACHQ and S-factor scores across 29 Alaskan counties, controlling for Asian and Pacific Islander populations.
Table 1. Partial correlations between SIRE percentages and academic achievement (ACHQ) and S-factor scores across 29 Alaskan counties, controlling for % Asian and Pacific Islander
Greenland
Greenland has a population of approximately 56,000, of which about 89% are reportedly Inuit (Bjerregaard et al., 2002). The remaining 9% consists primarily of Danes, other Europeans, and small groups such as Filipinos (Central Intelligence Agency, 2020). According to a large genetic study, the Greenlandic Inuit population has, on average, about 25% European ancestry. Based on these figures, the estimated country-wide ancestry proportions would be approximately 31% European, 67% Inuit (Amerindian), and 2% from other sources.
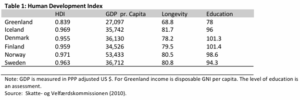
Since Greenland is a constituent country of Denmark, its Human Development Index (HDI) is not routinely reported by the UN. However, several estimates have been made for the 2008–2010 period: 0.869 (Hastings, 2009), 0.786 (Avakov et al., 2013), and 0.839 (Andersen et al., 2021). All are lower than Denmark’s HDI average of 0.93 to .95 for 2010. Summarizing the HDI components for 2010, Andersen et al. (2021) reports the following:
Table 2. Human Development Index (HDI) and component scores for Greenland and Nordic countries, as reported by Andersen et al. (2021).
Little cognitive data is available for Greenland. Becker (in View on IQ) provides an estimate of 98.89 (or 98.74 when scaled relative to the U.S. average) based on WISC Block Design scores from a sample of 40 Inuit adolescents in a study by Weihe et al. (2002). Becker excluded WISC Digit Span (SD) scores, which were low with raw scores of 2.8 and 2.3 for DS forwards and backwards, respectively, arguing that mercury exposure may have artificially lowered performance on that subtest. However, the children tested were not atypical, suggesting that if mercury exposure is affecting scores, it likely reflects a broader issue within the Greenlandic Inuit population. Using U.S. CNLSY scores as norms, computed in another post, the children’s estimated scores would be IQ 85 for Digit Span Backwards and IQ 79 for Digit Span Forwards. Averaging Block Design and Digit Span Backwards yields an estimated IQ of 92 (U.S.-normed) for the sample.
Additionally, Kleist et al., (2021) report validation results for an Greendlandic Inuit translation of The Rowland Universal Dementia Assessment Scale (RUDAS) dementia screen. The discussion and figures imply a mean score of around 24, significantly lower than scores found in validation studies of European populations (Nielson et al., 2019; M = 27.3; SD = 2.2).
Regarding the ACHQ, Statistics Greenland reports rates of satisfactory performance on achievement tests in Math, English, Danish, and Greenlandic. These scores are not directly comparable to Danish test scores, but analyzing student performance across Nuuk schools provides valuable insights. We examined results from top-performing schools on Danish tests. At Nuuk Internationale Friskole, a private international school, 90% of students were European, while 95% of students at Ukaliusaq were Inuit. Atuarfik Hans Lynge and Kangillinnguit had more mixed demographics and more admixed students, with approximately 50% and 33% of students, respectively, exhibiting predominantly European features. Pictures of the student bodies of the schools are shown below.

Based on percentages achieving satisfactory scores in years 2010 to 2019 we computed deviations scores relative to the Greenland average. Results are shown in Table 3.
Table 3. Deviation Scores for the Schools with the Highest Danish Language Performance in Greenland (Greenland average as reference)
| Greenlandic | English | Danish | Math | ||
|---|---|---|---|---|---|
| All Greenland | ref | ref | ref | ref | |
| Ukaliusaq | Public | -0.01 | -0.31 | -0.46 | 0.07 |
| Kangillinnguit Atuarfiat | Public | 0.18 | -0.90 | -0.92 | -0.11 |
| Atuarfik Hans Lynge | Public | 0.13 | -1.00 | -1.07 | -0.46 |
| Nuuk Internationale Friskole | Private | 0.57 | -1.42 | -1.34 | -0.81 |
Students at Nuuk Internationale Friskole scored 0.77 standard deviations (SD) above the Greenland average, calculated by averaging Math scores and the mean of the three language tests (English, Danish, and Greenlandic). Note, the numbers at this school were small with around 150 kids over a decade of data; estimates are not precise. This may represent an upper bound for the Danish-Greenland performance gap, as the school is selective. The extent of this selectivity is unclear, but Europeans in Greenland are often administrators, suggesting a potential cognitive advantage. If we assume these students perform 0.4 SD above the Greenland average due to selection, their residual advantage would be 0.4d. For comparison, selection for the children of U.S. military personnel at Department of Defense schools is estimated to be approximately 0.3d, where one parent is directly selected on a measure of general intelligence.
For the Admixture in Americas analyses, we will use the score of 92, derived from the average of the DS backwards and Block Design scores reported by Weihe et al. (2002). Based on our preliminary analysis of achievement data, the ACHQ is likely not below this value.
It is notable that Greenlanders in Denmark are reported to have higher educational dropout rates, increased levels of poverty, and greater incidence of homelessness (Graven et al., 2023). Additionally, Greenlanders disproportionately fail the Danish Parent Competency Test. According to Human Rights in Denmark, this may be partly due to lower measured cognitive ability scores, noting:
When the municipalities examine the basis for the forced removal of Greenlandic children in Denmark, a number of tests are generally used to measure parenting skills. But according to several sources, these tests are unsuitable because they are not adapted to the target group. Greenlandic parents risk achieving low test scores, so that it is concluded, for example, that they have reduced cognitive abilities without there being actual evidence for it. Such potential misjudgements can have far-reaching consequences for both children and parents, as they can ultimately contribute to the forced removal of a child. As stated in the memo, it is well known that, among other things, intelligence tests prepared and tested in a given context or culture cannot simply be used among other peoples or cultures. The criticism of the measurement tools used in connection with forced removals should therefore be taken seriously. In Denmark, 7 per cent of children born in Greenland and 5 per cent of children with at least one parent born in Greenland are placed outside the home, compared to 1 per cent of other children in Denmark. Testing of parenting skills among Greenlanders in Denmark. (Danish Institute for Human Rights, 2022)
Greenland is another country where more detailed research is needed on the relationship between ancestry and outcomes.
References
Andersen, T. M. (2021). The Greenlandic economy: Structure and prospects. In Greenland’s Economy and Labour Markets (pp. 11-29). Routledge.
Avakov, A. V. (2013). Quality of Life, Balance of Powers, and Nuclear Weapons, 2013: A Statistical Yearbook for Statesmen and Citizens (Vol. 6). Algora Publishing.
Bjerregaard, P., & Curtis, T. (2002). Cultural change and mental health in Greenland: the association of childhood conditions, language, and urbanization with mental health and suicidal thoughts among the Inuit of Greenland. Social Science & Medicine,
Central Intelligence Agency. (2020). The World Factbook. CIA.gov. Archived January 9, 2021. Retrieved October 3, 2020, from https://www.cia.gov/the-world-factbook/
Graven, V., Abrahams, M. B., & Pedersen, T. (2023). Total pain and social suffering: marginalised Greenlanders’ end-of-life in Denmark. Frontiers in Sociology, 8, 1161021.
Grigorenko, E. L., Meier, E., Lipka, J., Mohatt, G., Yanez, E., & Sternberg, R. J. (2004). Academic and practical intelligence: A case study of the
Yup’ik in Alaska. Learning and Individual Differences, 14(4), 183-207.
Hastings, D. A. (2009). Filling gaps in human development index: findings for Asia and the Pacific.
Kleist, I., Noahsen, P., Gredal, O., Riis, J., & Andersen, S. (2021). Diagnosing dementia in the Arctic: translating tools and developing and validating an algorithm for assessment of impaired cognitive function in Greenland Inuit. International Journal of Circumpolar Health, 80(1), 1948247.
Lynn, R. (2006). Race differences in intelligence. Whitefish, MT: Washington Summit Publishers.
Moltke, I., Fumagalli, M., Korneliussen, T. S., Crawford, J. E., Bjerregaard, P., Jørgensen, M. E., … & Albrechtsen, A. (2015). Uncovering the genetic history of the present-day Greenlandic population. The American Journal of Human Genetics, 96(1), 54–69.
Nielsen, T. R., Segers, K., Vanderaspoilden, V., Bekkhus-Wetterberg, P., Bjørkløf, G. H., Beinhoff, U., … & Waldemar, G. (2019). Validation of the Rowland Universal Dementia Assessment Scale (RUDAS) in a multicultural sample across five Western European countries: diagnostic accuracy and normative data. International Psychogeriatrics, 31(2), 287-296.
Weihe, P., Hansen, J. C., Murata, K., Debes, F., Jørgensen, P. J., Steuerwald, U., … & Grandjean, P. (2002). Neurobehavioral performance of Inuit children with increased prenatal exposure to methylmercury. International Journal of Circumpolar Health, 61(1), 41-49.
]]>
Table 1. Average PIAAC Literacy and Numeracy d-Values Between Non-Aboriginal and Aboriginal Individuals by Canadian Province/Territory (Mother Tongue Matches Test Language)
| Non-aboriginal / Metis d | Non-aboriginal / First Nations d | Non-aboriginal / Inuit d | |
|---|---|---|---|
| Canada | 0.21 | 0.56 | 1.18 |
| Ontario | 0.21 | 0.49 | NA |
| Manitoba | 0.23 | 0.81 | NA |
| Saskatchewan | 0.4 | 0.77 | NA |
| British Colombia | 0.22 | 0.59 | NA |
| Yukon | 0.46 | 0.87 | NA |
| Northwest Territories | 0.52 | 1.2 | 1.11 |
| Nunavut | NA | NA | 1.67 |
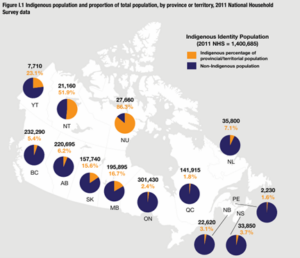
Given these disparities, along with the considerable variation in the geographic distribution of Indigenous populations, depicted in Figure 1, it is reasonable to expect that Amerindian admixture will correlate with regional cognitive outcomes—particularly with lower scores in the northern regions. In contrast, some, such as Professor Leon, have proposed that regional differences in cognitive performance reflect variation in UV radiation exposure.
Figure 1. Indigenous Population as a Percentage of the Total Population by Canadian Province/Territory
To investigate we computed first order administrative division (FOAD) cognitive and SES-related scores as follows:
1. Cognitive ability
We computed unit-weighted averages of math/numeracy and reading/literacy scores from four 21st-century assessments:
• School Achievement Indicators Program (SAIP), 2001–2002 — includes data from the Northwest Territories, Nunavut, and Yukon
• Pan-Canadian Assessment Program (PCAP), 2007 and 2010 — includes Yukon
• Program for the International Assessment of Adult Competencies (PIAAC), 2012 — includes the Northwest Territories, Nunavut, and Yukon
• Programme for International Student Assessment (PISA), 2009, 2012, 2015, 2018, and 2022 — limited to the provinces
PISA covers only the provinces. PCAP included Yukon in 2007 and 2010, while both SAIP and PIAAC included all three territories. The average correlation among scores from these four assessments across FOADs was r = .69, justifying their combination.
2. Province / Territory ancestry
Due to Canada’s rapid demographic change, published genetic ancestry estimates—such as those from Ancestry.com (2017)—are now outdated. More reliable estimates can be generated by weighting self-identified race/ethnicity (SIRE) percentages by the corresponding average genetic ancestry. This approach requires a few simplifying assumptions. We assume that most visible minority groups are genetically unadmixed, with the exception of Black and Latin American populations. For instance, individuals identified as Filipino are assumed to be 100% East Asian. This assumption is supported by their recent immigration history and admixture data from their countries of origin.
For Black Canadians from the West Indies, we apply admixture patterns found among Anglo-Caribbean populations, estimating an average of approximately 80% African and 20% European ancestry, while for Black Canadians from Africa we assumed 100% African ancestry. For Latin Americans—based on common countries of origin such as Mexico and Brazil—we use average admixture levels observed in U.S. Hispanic populations.
For Aboriginal groups, we rely on previously calculated admixture averages and apply them to relevant subgroups (e.g., Métis, First Nations). In cases where individuals are identified as mixed Aboriginal and non-Aboriginal, we use the European Canadian average for the non-aboriginal component, given that the non-Aboriginal population in Canada has historically been overwhelmingly of European descent.
While not a perfect method, this approach is grounded in common sense and is consistent with that used by Putterman and Weil (2010).
3. HDI and S-factor scores\
We obtained HDI estimates for 2005, 2010, 2015, and 2020 from Smits and Permanyer (n.d.) and averaged them. To compute S-factor scores, we used the OECD Regional Well-Being dataset (https://www.oecdregionalwellbeing.org/), applying principal factor analysis (PFA) with mean replacement. The variables included were: Education, Jobs, Income, Safety, Health, Accessibility of Services, and Housing. The first factor accounted for 61% of the total variance. Summary values are showing in Table 2.
Table 2. Summary Variables for Canadian Regions
| Region | Population | % European | % Arab | % African | % Amerindian | % East Asian | % South Asian | % Other | IQ | HDI | S-factor |
|---|---|---|---|---|---|---|---|---|---|---|---|
| Canada | 36328475 | 0.705 | 0.019 | 0.04 | 0.048 | 0.093 | 0.071 | 0.024 | 100.56 | ||
| Newfoundland and Lab | 502100 | 0.883 | 0.003 | 0.007 | 0.085 | 0.01 | 0.009 | 0.002 | 97.37 | 0.874 | 0.62 |
| Prince Edward Island | 150480 | 0.874 | 0.007 | 0.011 | 0.036 | 0.043 | 0.025 | 0.004 | 97.09 | 0.864 | 0.149 |
| Nova Scotia | 955860 | 0.86 | 0.011 | 0.027 | 0.048 | 0.026 | 0.023 | 0.006 | 98.12 | 0.872 | 0.376 |
| New Brunswick | 759195 | 0.898 | 0.007 | 0.015 | 0.049 | 0.017 | 0.011 | 0.004 | 97.47 | 0.866 | 0.735 |
| Quebec | 8308480 | 0.816 | 0.034 | 0.048 | 0.046 | 0.03 | 0.015 | 0.011 | 103.1 | 0.887 | 0.828 |
| Ontario | 14031755 | 0.644 | 0.02 | 0.051 | 0.034 | 0.106 | 0.108 | 0.037 | 101.13 | 0.899 | 0.229 |
| Manitoba | 1307185 | 0.682 | 0.006 | 0.033 | 0.108 | 0.105 | 0.054 | 0.012 | 97.97 | 0.869 | -0.736 |
| Saskatchewan | 1103200 | 0.752 | 0.005 | 0.019 | 0.11 | 0.066 | 0.041 | 0.007 | 97.74 | 0.882 | 0.496 |
| Alberta | 4177715 | 0.688 | 0.017 | 0.04 | 0.053 | 0.113 | 0.071 | 0.018 | 101.83 | 0.902 | 0.791 |
| British Columbia | 4915940 | 0.624 | 0.006 | 0.013 | 0.045 | 0.186 | 0.096 | 0.03 | 100.65 | 0.895 | 1.184 |
| Yukon | 39585 | 0.737 | 0.001 | 0.013 | 0.142 | 0.076 | 0.026 | 0.005 | 97.48 | 0.866 | -0.778 |
| Northwest Territories | 40380 | 0.539 | 0.006 | 0.024 | 0.345 | 0.062 | 0.019 | 0.006 | 94.03 | 0.893 | -1.433 |
| Nunavut | 36600 | 0.199 | 0.001 | 0.014 | 0.768 | 0.011 | 0.005 | 0.002 | 81.47 | 0.801 | -2.461 |
Table 3 presents partial correlations—weighted by the square root of population size—with non-focal ancestry (i.e., ancestry other than Amerindian, African, and European) statistically controlled. European ancestry is positively associated with IQ, the S-factor, and HDI, while Amerindian ancestry is negatively associated with all three outcomes. African ancestry shows a positive association with IQ and HDI; however, this likely reflects the settlement of highly selected African immigrants in high-performing FOADs such as Ontario and Quebec. Many of these individuals are recent migrants with elevated educational and occupational profiles. As such, their characteristics—like those of Asian immigrants—do not reflect historical admixture patterns and therefore fall outside the intended scope of our Admixture in the Americas project.
Table 3. Correlation Matrix for Canadian FOAD
| Amerindian | African | European | ACHQ | S-factor | |
|---|---|---|---|---|---|
| Amerindian | – | ||||
| African | –.221 | – | |||
| European | –.982 | 0.032 | – | ||
| ACHQ | –.795 | 0.563 | 0.704 | – | |
| S-factor | –.671 | –.119 | 0.71 | 0.657 | – |
| HDI | –.640 | 0.489 | 0.56 | 0.827 | 0.576 |
The provincial-level results also replicate at the subprovincial level at least when using education attainment as an outcome. For example, Statistics Canada reports college attendance rates for 293 municipalities. These rates correlate at –.40 with Amerindian ancestry and at –.41 with Aboriginal self-identified race/ethnicity (SIRE). Since data are available for both Aboriginal and non-Aboriginal populations, it can be demonstrated mathematically that the observed correlations are driven by an Indigenous-specific effect, rather than by other factors varying between municipalities. Data attached.
Overall, despite Canada’s rapid demographic change, regional variation in outcomes continues to reflect performance differences between historical groups—namely, Aboriginal and European Canadians.
References
Organisation for Economic Co-operation and Development (OECD). (n.d.). OECD Regional Well-Being. https://www.oecdregionalwellbeing.org
Putterman, L., & Weil, D. N. (2010). Post-1500 population flows and the long-run determinants of economic growth and inequality. The Quarterly journal of economics, 125(4), 1627-1682.
Smits, J. and Permanyer, I. The Subnational Human Development Database. Sci. Data. 6:190038 https://doi.org/10.1038/sdata.2019.38 (2019).
OECD Regional Well-Being
Canada is rapidly diversifying as a result of relaxed immigration policies. According to the 2021 Census, individuals of European ancestry now constitute approximately 67% of the population, down from 83% two decades earlier. The largest non-European groups include East Asians (9%), South Asians (7%), Aboriginal peoples (6%), and Black Canadians (4%). The pace of demographic change has outstripped genetic survey estimates. For instance, Ancestry.com still reported over 90% European ancestry in Canada as recently as 2017, whereas the true proportion is now likely under 70%. Despite this shift, geographic variation in socioeconomic and cognitive outcomes continues to correlate strongly with European and Amerindian ancestry proportions. This post provides an overview of Aboriginal demographic distributions and cognitive performance in Canada.
Aboriginal Populations: Geographic Distribution
Canada’s Aboriginal populations includes three officially recognized groups: First Nations, Métis, and Inuit. Most First Nations and Métis individuals reside in the ten provinces, with roughly 40% of First Nations people living on reserves. By contrast, the Inuit are primarily concentrated in the three territories, especially Nunavut. Outside Nunavut, major Inuit populations are found in Newfoundland and Labrador (~7,000) and the Northwest Territories (~4,000).
Table 1. Geographic distribution of Aboriginal and non-Aboriginal Canadians
| Region | Total Population | First Nations | Métis | Inuit | Total Aboriginal | Non-aboriginal |
|---|---|---|---|---|---|---|
| Provinces | 36,873,821 | 1,144,065 | 586,900 | 17,015 | 1,747,980 | 35,125,841 |
| • Reservations | ~428,000 | ~428,000 | ~0 | ~0 | ~428,000 | ~0 |
| Territories | 118,160 | 19,430 | 4,290 | 53,530 | 77,250 | 40,910 |
| • Yukon | 40,232 | 6,935 | 1,285 | 260 | 8,805 | 31,427 |
| • Northwest Territories | 41,070 | 12,315 | 2,890 | 4,155 | 19,360 | 21,710 |
| • Nunavut | 36,858 | 180 | 115 | 49,115 | 49,410 | 7,448 |
| Canada Total | 36,991,981 | 1,163,495 | 591,190 | 70,545 | 1,807,250 | 35,184,731 |
Genetic Admixture of Aboriginal Populations
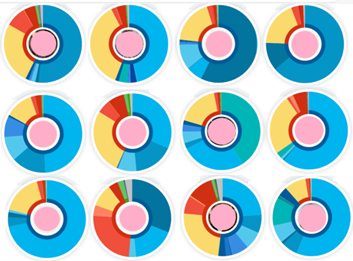
Admixture estimates for the Métis are sparse in the academic literature, but informal data from 23andMe (e.g., r/23andme subreddit) suggest approximately 65% European and 35% Amerindian ancestry, using the East Asian component as a proxy for Amerindian.
Figure 1. 23andMe admixture “donuts” for Métis individuals
First Nations individuals on reserves show average ancestry estimates of ~25% European and ~75% Amerindian, based on samples compiled from Flegontov et al. (2019), Reich et al. (2012), and Verdu et al. (2014). Off-reserve First Nations likely have higher European admixture. For Inuit, Zhou et al. (2019) report about 5% European admixture among the Nunavik Inuit of Arctic Quebec. Greenlandic Inuit, by contrast, average about 25% European ancestry, though this is lower in eastern Greenland near Nunavut. For context, Moreau et al. (2013) report ~2% Amerindian admixture in the French Canadian population. Estimated admixture — this are admittedly rough estimates –is summarized in Table 2.
Table 2. Estimated admixture for White/European Canadians and Indigenous groups
| European % | Amerindian % | ||
| European Canadians | 0.98 | 0.02 | |
| Metis | 0.65 | 0.35 | |
| First Nations | 0.25 | 0.75 | |
| Inuit | 0.05 | 0.95 | |
Academic Achievement Gaps
In other posts, we have discussed the aptitude test scores of various ethnic groups. Given Canada’s rapidly changing population, it is difficult to keep pace. Regarding Aboriginal populations specifically, most academic achievement data in Canada pertain to off-reservation individuals residing in the ten provinces. This means the Yukon, Northwest Territories, and Nunavut are typically excluded. Approximately 40% of Aboriginal students live either on a reserve or in one of the territories, resulting in a substantial portion of the Aboriginal population—particularly First Nations and Inuit—not being represented in these datasets.
The most comprehensive data available for off-reserve Aboriginal students in the provinces come from the Pan-Canadian Assessment Program (PCAP), which evaluates the academic performance of 8th-grade students every three years. Administered by the Council of Ministers of Education, Canada (CMEC), PCAP publishes contextual reports for each assessment cycle, focusing on a specific domain (Mathematics, Reading, or Science). Mean scores are standardized with a total standard deviation (SD) of 100. Results from 2010 to 2019, converted into Cohen’s d values, are summarized in Table 3. Off-reserve First Nations and Inuit students perform approximately d = –0.55 to –0.60 below the non-Aboriginal mean, while Métis and individuals of mixed Aboriginal and non-Aboriginal ancestry—who likely have similar levels of European ancestry—score around d = –0.30 below non-Aboriginals.
Table 3. Achievement gaps (Cohen’s d) on PCAP tests
| Metis | Mixed aborig. / not | First Nations | Multiple aborig. | Inuit | |
| Math 2010 | 0.4 | 0.54 | 0.62 | ||
| Science 2013 | 0.31 | 0.54 | 0.84 | ||
| Reading 2016 | 0.23 | 0.56 | 0.31 | ||
| Math 2019 | 0.31 | 0.28 | 0.69 | 0.58 | 0.42 |
| Average | 0.31 | 0.28 | 0.58 | 0.58 | 0.55 |
These performance patterns are also evident at the provincial level. While most provinces do not disaggregate achievement data by specific Aboriginal groups, Ontario is an exception. The Government of Ontario (n.d.) reports pass rates—defined as achieving Level 3 or 4—on provincial Mathematics and Reading assessments (EQAO). Table 4 presents these pass rates converted into Cohen’s d scores, assuming a normal distribution. Métis and First Nations students perform similarly to the results observed in the PCAP data. Because the vast majority of Métis reside in the provinces and outside of reserves, the available achievement data are broadly representative of Métis performance.
Table 4. Test score gaps between Aboriginal and non-Aboriginal students in Ontario (Cohen’s d, EQAO assessments)
| Metis | First Nations | Inuit | ||||||
|---|---|---|---|---|---|---|---|---|
| Subject | N | d | N | d | N | d | ||
| Math_2011 | 337 | 0.33 | 1399 | 0.7 | ||||
| Math_2012 | 409 | 0.3 | 1549 | 0.7 | ||||
| Math_2013 | 454 | 0.3 | 1760 | 0.62 | 47 | 0.18 | ||
| Math_2015 | 536 | 0.39 | 1994 | 0.67 | 69 | 0.39 | ||
| Reading_2011 | 337 | 0.26 | 1399 | 0.6 | 24 | 0.57 | ||
| Reading_2012 | 409 | 0.19 | 1551 | 0.61 | 28 | 0.46 | ||
| Reading_2013 | 454 | 0.13 | 1759 | 0.5 | 47 | 0.22 | ||
| Reading_2015 | 536 | 0.35 | 1995 | 0.57 | 69 | 0.75 | ||
| Ave. | 0.29 | 0.62 | 0.44 |
Another valuable data source—particularly for adult populations—is the 2012 Programme for the International Assessment of Adult Competencies (PIAAC). Summary scores from this dataset, as reported by the Council of Ministers of Education, Canada (CMEC), and Indigenous Services Canada (ISC, n.d.), include participants from all three territories, thereby capturing Inuit populations in Nunavut. However, the data remain limited to off-reservation individuals. A key advantage of the PIAAC dataset is its disaggregation of scores by whether the respondent’s mother tongue matches the language of the test (see Figure 2.12 for Literacy and Figure 2.13 for Numeracy). Table 5 summarizes comparisons between Aboriginal and non-aboriginal individuals whose mother tongue corresponds to the test language.
Table 5. Test score gaps (Cohen’s d) between Aboriginal and non-Aboriginal individuals with matching test and mother tongue languages based on PIAAC 2012
| Metis | First Nations | Inuit | |
| N | 2025 | 2238 | 472 |
| d | d | d | |
| Literacy | 0.18 | 0.52 | 0.96 |
| Numeracy | 0.26 | 0.68 | 1.34 |
| Average | 0.22 | 0.6 | 1.15 |
The results suggest that differences are not simply due to linguistic bias since they show up among individuals who grew up speaking English or French. Adjusting for territorial distribution and on-reserve effects suggests Inuit, overall, score approximately d = 0.80 below non-aboriginals.
What about on reservations first nations? Bacic and Zheng (2024) report that on-reserve Indigenous students in British Columbia score approximately d = 0.38 below their off-reserve counterparts. Similarly, the Government of Ontario (n.d.) indicates that during the 2013–14 school year, only 19% of on-reserve Indigenous students met acceptable standards in mathematics, and 26.5% did so in reading. Based on the EQAO pass rate data used for Table 4, these figures correspond to an average performance roughly d = 0.64 below that of off-reserve Indigenous students—who themselves scored d = 0.62 below the non-Indigenous average. Taken together, these findings suggest that on-reserve First Nations students perform approximately one standard deviation below the non-Indigenous mean. Averaging across on- and off-reserve populations, the total First Nations population appears to score around d = 0.80 below the non-Indigenous population.
IQ Test Scores
For the Admixture in the Americas update, our primary focus is on achievement test scores. Nonetheless, it is worth revisiting IQ-based findings, particularly as only a handful of studies published in the 21st century have reported IQ data for Indigenous populations in Canada.
Inuit Populations
Two notable studies examine Inuit samples in Arctic Quebec. Jacobson et al. (2014) report a mean IQ of 91.8 among 282 Inuit children, based on a culturally adapted version of the U.S. Wechsler Intelligence Scale for Children (WISC). A consistent pattern—also observed in First Nations populations—is evident: relatively higher performance on spatial subtests and lower scores on verbal comprehension, processing speed, and working memory.
Plusquellec et al. (2007) provide corresponding data for the mothers of these children (N = 165–169). On the Peabody Picture Vocabulary Test (PPVT), the mothers averaged 68.2. On Raven’s Standard Progressive Matrices (SPM), they scored an average of 34.7 raw. Because these women fell outside the SPM age norms, the raw score was converted using the Advanced Progressive Matrices (APM) norms using Becker’s (2023) tables. The corresponding APM score of 5.15 (rounded down to 5) for a mean age of 24.9 (rounded up to 25) yields an estimated IQ of 65.84. Applying a Flynn Effect correction (to the converted APM-based score) reduces this by an additional 3.99 points. Additionally, Faucher (1999) reported an average SPM score of 35.9 for 44 Inuit adults (mean age = 24.6) from Nunavik. This corresponds to an APM score of 6.02, which is equivalent to an IQ of 68.27 when rounded to age 25. Applying a Flynn Effect correction reduces this by 4.20 points.
Due to the heterogeneity across tests and the assumptions involved in converting SPM raw scores to standardized scores, we refrain from calculating a combined average. For broader context, Lynn (2016) reports a mean IQ of 91 for Arctic populations across Alaska, Canada, and Russia. The key point for our analysis is that both IQ and achievement scores for Inuit populations are comparatively low.
First Nations Populations
We identified nine 21st-century studies reporting IQ data across 11 First Nations samples:
-
Diaz (2005): WAIS-III Matrix Reasoning score of 9.02 for 42 on-reserve adults in British Columbia. Assuming this is a scaled subtest score (M = 10, SD = 3), this corresponds to an IQ of 95.1.
-
Morin (2006): Average IQ of 91.49 for 49 children on a Saskatchewan reserve, using the Das–Naglieri Cognitive Assessment System (CAS), a test specifically designed to be less culturally biased.
-
Root (2006): Root (2006) reported SPM scores on Forms A–D of 33.16 (N = 38) for students who later dropped out and 38.34 (N = 25) for those who graduated. According to Becker (personal communication, May 8, 2025), the conversion equation to the full form (A–E) is:
SPM_RS(A–E) = 0.0133 × [SPM_RS(A–D)]² + 0.4547 × [SPM_RS(A–D)] + 5.7301.
Applying this formula yields estimated raw scores of 35.43 and 42.71, respectively. Using Becker’s (2023) norms and an estimated age of 13.5, the corresponding IQ equivalents are 81.26 and 93.80. Adjusting for the Flynn Effect reduces each score by 3.99 points. -
Vanderpool & Catano (2008): Among 101 young adults (ages 18–28), CFAT = 87, SPM = 96, along with Mill Hill Vocabulary and Wonderlic scores. Differential item functioning analyses showed minimal cultural bias. Spatial abilities were comparable to the general military recruit population.
-
Dela Cruz & McCarthy (2010): PPVT-IV mean of 98.3 for 44 off-reserve children in Alberta Head Start.
-
Vicaire (2011): An average SPM score of 36.66 on Forms A–D was reported for 53 children in remote First Nations schools. Using the conversion formula referenced in relation to Root (2006), this corresponds to a full-form (A–E) raw score of 40.27. Based on Becker’s (2023) tables and an estimated age of 14, the corresponding IQ is 88.61. Applying a Flynn Effect correction reduces this by 6.09 points.
-
Janzen et al. (2013): CAS scores of 86.32 (N = 84, Alberta) and 91.49 (N = 49, Saskatchewan).
-
Babcock (2017): WISC-IV mean of 94.96 for 60 off-reserve First Nations children, compared to 100.6 for White children in the standardization sample.
-
Hanson (2019): WISC-IV mean of 78.56 for 102 First Nations children in the Northwest Territories. Subtest analysis showed relatively strong visual-spatial performance and weaker verbal scores.
Excluding the Diaz (2005) result and averaging across the remaining ten samples (with multiple test scores averaged for Vanderpool & Catano (2008), the unadjusted weighted mean IQ for 21st century First Nations individuals is approximately 88.47. Applying Flynn Effect corrections would lower this by one to two points. Lynn (2016), analyzing five Canadian studies from 1968–1987, reports a similar average of 85.2. While individual conversions may be debated, Lynn’s overall estimate appears broadly accurate. Most of these studies focus on individuals living on reserves, which aligns with achievement data indicating performance approximately one standard deviation below the non-Indigenous mean. The average for the broader First Nations population—especially off-reserve individuals—would likely be somewhat higher.
Thus, in this case, IQ test results align closely with academic achievement outcomes. For both First Nations and Inuit populations, scores are consistently lower than those of the non-aboriginal population. IQ test results are summarized in Table 6.
Table 6. IQ results across studies.
| Author | Test | N | FSIQ M | Flynn corrected FSIQ | Verbal | Spatial | Fluid | Working Memory | Processing | |||
|---|---|---|---|---|---|---|---|---|---|---|---|---|
| Diaz (2005) | Martix subtest, WAIS-III | Native American | Califonia, LA | 64 | 98.35 | |||||||
| Martix subtest, WAIS-III | Native American | British Columbia reserves | 42 | 95.1 | ||||||||
| Morin (2006) | CAS | First Nations | Saskatchewan reserve | 49 | 91.49 | No | ||||||
| Root (2006) | SPM | First Nations | Quebec reserve U | 38 | 81.26 | 77.27 | ||||||
| Root (2006) | SPM | First Nations | Quebec reserve A | 25 | 93.80 | 89.81 | ||||||
| Vanderpool & Catano (2008) | First Nations | remote Manitoba | 101 | |||||||||
| CFAT | 87 | No | 89 | 95 | ||||||||
| SPM | 96 | No | 42 | |||||||||
| MHV | 91 | No | 28 | |||||||||
| Wonderlic | 88 | No | ||||||||||
| General population Recruits | 108 | |||||||||||
| CFAT | 104 | No | 104 | 99 | ||||||||
| SPM | 101 | No | ||||||||||
| MHV | 100 | No | ||||||||||
| Wonderlic | 106 | No | ||||||||||
| dela Cruz & McCarthy (2010) | PPVT-IV | Aboriginal | Alberta off reseve | 44 | 98.3 | No | ||||||
| Vicaire (2011) | SPM | First Nations | remote schools | 53 | 88.61 | 82.52 | ||||||
| Janzen et al. (2013) | CAS | Native Children | Alberta reserve | 84 | 86.32 | No | ||||||
| Janzen et al. (2013) | CAS | Native Children | Saskatchean reserve | 49 | 91.49 | No | ||||||
| Babcock (2017) | WISC-IV CAN | |||||||||||
| Asian | 96 | 102.34 | No | |||||||||
| Caucasian | 647 | 100.6 | No | |||||||||
| First Nation | Off reservation | 60 | 94.98 | No | ||||||||
| Other | 77 | 95.92 | No | |||||||||
| Hanson (2019) | WISC-IV CAN | First Nations | Northwest territories | 102 | 78.56 | No | 77.47 | 93.21 | 86.01 | 80.97 | 84.34 | |
| Faucher (1999) | SPM | Inuit | Nunavik | 44 | 68.27 | 64.07 | ||||||
| Plusquellec et al. (2007) | Inuit | Arctic Québec | 165-169 | |||||||||
| PPVT USA | 68.2 | No | ||||||||||
| SPM | 65.84 | 61.85 | 34.7 | |||||||||
| Jacobson et al. (2014) | WISC-IV USA, Inuit adapted | Inuit | Arctic Québec | 282 | 91.8 | No | 84.5 | 94.2 | 89.5 | 86.6 | ||
Conclusion
In Canada, both achievement and IQ tests consistently reveal cognitive disparities between Aboriginal and non-Aboriginal populations, particularly among First Nations and Inuit. These differences are observed nationwide and within provinces & territories and persist even when matching on language. Given the markedly uneven regional distribution of Aboriginal populations across Canada, we can reasonably expect that Amerindian ancestry will be negatively correlated with both cognitive ability and socioeconomic status across Canadian regions. In Part 2, we examine whether this prediction holds.
References
Babcock, S. E. (2017). Examining the influence of demographic differences on children’s WISC-V test performance: A Canadian perspective [Master’s thesis, University of Western Ontario].
Bacic, R., & Zheng, A. (2024). Race and the income‐achievement gap. Economic Inquiry, 62(1), 5–23.
Becker, D. (2023, October 25). National IQ dataset (Version 1.3.5) [Dataset].
Council of Ministers of Education, Canada (CMEC), & Indigenous Services Canada (ISC). (n.d.). Adult competencies among Indigenous Peoples in Canada: Findings from the first cycle of the Programme for the International Assessment of Adult Competencies (PIAAC). Government of Canada.
Dela Cruz, A. M., & McCarthy, P. (2010). Alberta Aboriginal Head Start in urban and northern communities: Longitudinal study pilot phase. Health Promotion and Chronic Disease Prevention in Canada, 30(2).
Diaz, S. H. (2005). Differences in cognitive strengths between Native North Americans living in rural versus urban environments [Doctoral dissertation, Fielding Graduate University].
Faucher, C. (2002). Étude des associations entre le développement cognitif et la qualité de l’environnement familial dans la population inuit du Nunavik. National Library of Canada= Bibliothèque nationale du Canada, Ottawa.
Flegontov, P., Altınışık, N. E., Changmai, P., Rohland, N., Mallick, S., Adamski, N., … & Schiffels, S. (2019). Palaeo-Eskimo genetic ancestry and the peopling of Chukotka and North America. Nature, 570(7760), 236–240.
Government of Ontario. (n.d.). Strengthening our learning journey: Third progress report on the implementation of the Ontario First Nation, Métis and Inuit education policy framework.
Hanson, J. (2019). Exploratory factor analysis of the Canadian Wechsler Intelligence Scale for Children—for a sample of First Nations students [Master’s thesis, Eastern Illinois University].
Jacobson, J. L., Muckle, G., Ayotte, P., Dewailly, É., & Jacobson, S. W. (2015). Relation of prenatal methylmercury exposure from environmental sources to childhood IQ. Environmental Health Perspectives, 123(8), 827–833.
Janzen, T. M., Saklofske, D. H., & Das, J. P. (2013). Cognitive and reading profiles of two samples of Canadian First Nations children: Comparing two models for identifying reading disability. Canadian Journal of School Psychology, 28(4), 323–344.
Lynn, R. (2016). Race differences in intelligence: An evolutionary analysis (2nd rev. ed.). Washington Summit Publishers.
Moltke, I., Fumagalli, M., Korneliussen, T. S., Crawford, J. E., Bjerregaard, P., Jørgensen, M. E., … & Albrechtsen, A. (2015). Uncovering the genetic history of the present-day Greenlandic population. The American Journal of Human Genetics, 96(1), 54–69.
Moreau, C., Lefebvre, J. F., Jomphe, M., Bhérer, C., Ruiz-Linares, A., Vézina, H., … & Labuda, D. (2013). Native American admixture in the Quebec founder population. PLOS ONE, 8(6), e65507.
Morin, T. L. (2006). A cognitive approach to word-reading for First Nations children [Master’s thesis, University of Saskatchewan].
Plusquellec, P., Muckle, G., Dewailly, É., Ayotte, P., Jacobson, S. W., & Jacobson, J. L. (2007). The relation of low-level prenatal lead exposure to behavioral indicators of attention in Inuit infants in Arctic Quebec. Neurotoxicology and Teratology, 29(5), 527–537.
Reich, D., Patterson, N., Campbell, D., Tandon, A., Mazieres, S., … & Bustamante, C. D. (2012). Reconstructing Native American population history. Nature, 488(7411), 370–374.
Root, R. (2008). Predictors of educational attainment among Naskapi adolescents [Doctoral dissertation, McGill University].
Vanderpool, M., & Catano, V. M. (2008). Comparing the performance of Native North Americans and predominantly White military recruits on verbal and nonverbal measures of cognitive ability. International Journal of Selection and Assessment, 16(3), 239–248.
Verdu, P., Pemberton, T. J., Laurent, R., Kemp, B. M., Gonzalez-Oliver, A., Gorodezky, C., … & Malhi, R. S. (2014). Patterns of admixture and population structure in native populations of Northwest North America. PLOS Genetics, 10(8), e1004530.
Vicaire, M. (2011). Cultural identity, intelligence, and self-esteem: Towards enriching the understanding of academic outcomes in a community of First Nation students [Master’s thesis, McGill University].
Zhou, S., Xie, P., Quoibion, A., Ambalavanan, A., Dionne-Laporte, A., Spiegelman, D., … & Rouleau, G. A. (2019). Genetic architecture and adaptations of Nunavik Inuit. Proceedings of the National Academy of Sciences, 116(32), 16012–16017.
]]>
Less is known about the performance of more recent immigrant-origin groups, as academic performance data disaggregated by race/ethnicity is generally not collected at the national level in Canada. However, relatively high academic performance among Chinese and other Northeast Asian Canadians has been documented since Peter Sandiford’s research on Vancouver’s Chinese population in the 1920s (Sandiford & Kerr, 1926), with further evidence summarized by Vernon (1982). More recent national and provincial achievement data corroborate these findings (Bacic & Zheng, 2024; Barber et al., 2021). By contrast, average performance among other ethnic groups—such as Asian Indians, Filipinos, and Hispanics—remains less clear. The same applies to the children of Black African immigrants, many of whom come from highly selected backgrounds — and whom are highly educated. While I have previously reported ethnic performance data from the Toronto District School Board, these findings should not be assumed to generalize nationally or even across Ontario.
Recently, I was able to compile a decade’s worth of Canadian Advanced Placement (AP) data, as reported by College Board (years: 2009, 2011–2019) and to convert AP threshold pass rates into d-scores using the method of thresholds. Unfortunately, post-George Floyd, College Board changed its policy and ceased reporting Canadian scores by race/ethnicity; as a result, data after 2019 is not available.
Note, for these analyses, I dropped the three studio art scores along with all of the ‘language & culture’ scores, as Warne (2016) found that these tests had low correlations with PSAT scores. (Both the original and modified datafiles are attached; thus if readers wish they can modify the analyses as desired.) Moreover, I computed d-values with respect to the total mean; since Asians score higher, self-identifying White Canadians scored below average. Additionally, I dropped the American Indian group since there were too few individuals to allow for reliable estimates. While Hispanic/Latino is a “visible minority” group in Canada, the number reporting as Hispanic in the Canadian AP datasets seems excessive. This group may include Iberians in addition to Latin Americans.
Summary results are presented below, with the final row reporting weighted-average ACHQ scores. Unlike in the United States, AP exams are not widely taken in Canada, so these results should be interpreted with caution — they represent a few more data points.
Table 1. Canadian 2009-2019 Advance Placement Results by Self-reported race/ethnicity
| Asian | Black | Hispanic | White | |||||||
|---|---|---|---|---|---|---|---|---|---|---|
| N | d | N | d | N | d | N | d | |||
| 2019 | 14061 | 0.172 | 575 | -0.565 | 730 | -0.254 | 10516 | -0.180 | ||
| 2018 | 13282 | 0.181 | 504 | -0.385 | 557 | -0.285 | 10362 | -0.175 | ||
| 2017 | 12258 | 0.189 | 471 | -0.486 | 673 | -0.320 | 10856 | -0.146 | ||
| 2016 | 11291 | 0.172 | 519 | -0.490 | 590 | -0.330 | 10649 | -0.128 | ||
| 2015 | 10037 | 0.179 | 473 | -0.545 | 274 | -0.160 | 10359 | -0.094 | ||
| 2014 | 9619 | 0.221 | 440 | -0.584 | 286 | -0.240 | 10479 | -0.130 | ||
| 2013 | 9680 | 0.210 | 419 | -0.423 | 236 | -0.351 | 10901 | -0.135 | ||
| 2012 | 8887 | 0.213 | 380 | -0.584 | 188 | -0.277 | 10649 | -0.141 | ||
| 2011 | 8152 | 0.218 | 318 | -0.783 | 155 | -0.212 | 10920 | -0.125 | ||
| 2010 | 7172 | 0.233 | 204 | -0.794 | 202 | -0.094 | 10324 | -0.136 | ||
| 2009 | 6772 | 0.205 | 211 | -0.898 | 87 | -0.466 | 9602 | -0.126 | ||
| Ave d. | 0.196 | -0.557 | -0.275 | -0.138 | ||||||
| ACHQ M | 105.01 | 93.72 | 97.95 | 100.00 | ||||||
| N | 111211 | 4514 | 3978 | 115617 | ||||||
For comparison, Warne (2016) reports that, in the United States, the weighted mean AP group differences in 2015 were: d = 0.774 (White–Black), d = 0.484 (White–Hispanic), and d = –0.156 (White–Asian). Thus, relative to the U.S., all non-White groups perform better on AP tests in Canada. For other national-level comparisons using Canadian datasets, see here. As I’ve previously argued, it would be worthwhile to collect more robust data on ethnic differences across a range of countries prior to hypothesizing about causes, rather than relying solely on U.S. data.
The R code and data files can be found here.
References
- Bacic, R., & Zheng, A. (2024). Race and the income‐achievement gap. Economic Inquiry, 62(1), 5–23.
- Barber, M., & Jones, M. E. (2021). Inequalities in test scores between Indigenous and non-Indigenous youth in Canada. Economics of Education Review, 83, 102139.
- Sandiford, P., & Kerr, R. (1926). Intelligence of Chinese and Japanese children. Journal of Educational Psychology, 17(6), 361.
- Vernon, P., (1982). The abilities and achievements of orientals in North America. Academic Press.
- Warne, R. T. (2016). Testing Spearman’s hypothesis with Advanced Placement examination data. Intelligence, 57, 87–95.
Figure 1. Population by Country of Birth for the Cayman Islands (2021)
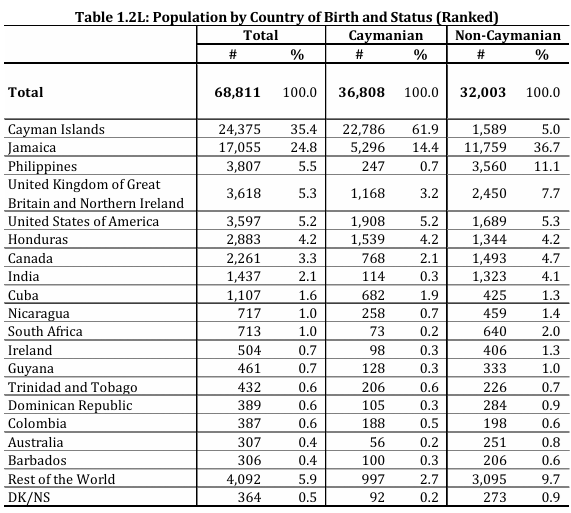
The Cayman Islands government does not officially report race or ethnicity data, contrary to Wikipedia’s assertions. The 2008 CIA World Factbook estimates the racial composition as 40% Afro-European, 20% African, 20% European, and 20% “other,” but the basis for these figures is unclear, and their frequent citation lacks specificity.
Genetic ancestry data specific to the Cayman Islands is scarce. The only relevant study, Micheletti et al. (2020), analyzed 23andMe samples from 1,526 self-identified Black individuals from Jamaica and the Cayman Islands (not disaggregated). Participants were included if all four grandparents were born in the same country and reported historical ties to an African nation. The study found an average ancestry (corrected so to be out of 100%) of 78.89% African, 19.84% European, and 1.23% East Asian and Amerindian combined. Given Jamaica’s population (2.8 million) vastly exceeds the Cayman Islands’, most samples likely represent Jamaicans, limiting the study’s applicability to Caymanians.
To estimate Caymanian resident ancestry, we rely on several assumptions:
- Non-immigrant Caymanian residents (61.9% of the resident population) align with the CIA’s 2008 breakdown: 50% Afro-European, and 25% African, and 25% European.
- Black non-immigrant Caymanians born on the island have an ancestry profile similar to Jamaicans. Jamaican ancestry, based on four studies including Micheletti et al. (2020), is shown in Table 1. Except for Vergara et al. (2013), these studies focus on self-identified individuals of African descent. The 2011 Jamaican census shows 98.17% of Jamaicans identify as Black (92.11%) or mixed (6.06%), suggesting no need to adjust for non-Afro-descent groups (unlike Barbados or the Bahamas).
Table 1: Admixture estimates for Jamaica
| Ethnic group | N | Markers | European % | African % | Amerindian % | East Asian % | Source |
|---|---|---|---|---|---|---|---|
| Afro-Caribbean | 119 | 15 STRs | 16 | 78.3 | 5.7 | Simms et al. (2010) | |
| Afro-Caribbean | 44 | 105 AIMs | 10.3 | 81.4 | 8.3 | Torres et al. (2013) | |
| General population | 706 | 237 AIMS | 14.00 | 76.00 | 9 | Vergara et al. (2013) | |
| Self-reported African ancestry | 45 | 551,510 SNPs | 11 | 89 | 1 | Mathias et al. (2016) | |
| Self-reported African ancestry | 1526 | 560,000 SNPs | 18.99 | 75.5 | 0.17 | 1.01 | Micheletti et al. (2020) |
| above corrected | 19.84 | 78.89 | 0.18 | 1.06 | Micheletti et al. (2020) | ||
| Average | 14.23 | 80.72 | 1.90 | 3.15 |
- White non-immigrant Caymanians resemble white British individuals (~100% European).
- Self-identified mixed-race non-immigrant Caymanians reflect an intermediate blend of African and European ancestry.
- Immigrants (38.1% of the resident population), mirror their countries’ average ancestry.
Weighting these groups by population share and ancestry profiles yields an approximate Cayman Islands average of 50% European, 40% African, 5% Amerindian, and 5% other (e.g., East Asian, South Asian). Without Cayman-specific genetic studies or detailed demographic data, this remains a rough estimate.
Turning to academic achievement, prior estimates suggested a CXC ACHQ of 85.41 and a GMATQ of 94.45 relative to the U.S. mean, averaging 89.48. However, these rely on selective samples (test-takers), limiting their representativeness.
Additional data from 2019-20, 2020-21, 2021-22, 2023-24 educational reports offer CAT4 scores for 1,543 Year 11 students in government schools, where most Cayman residents study (expatriates often attend private schools). These scores, (apparently) benchmarked against UK norms, yield a weighted mean of 92.88. This is much higher than the HVIQ of 74 estimated by Jason Malloy based on data from the middle of last century!
In this series, our focus is on ACHQ. For the academic years 2021-22 and 2023-24, the Department of Education has provided the Rising Stars assessment results for Year 6 students. Rising Stars is a UK-based assessment that aligns with the UK mean. Instead of reporting mean scores or percentages of students achieving basic levels, only the percentage of students performing at the level predicted by CAT4 is provided. However, with the application of clever statistical methods, it is possible to estimate the mean scores.
To illustrate, Figure 2 displays the 2023-24 attainment across Grammar, Punctuation, and Spelling (GAPS), Reading, and Mathematics relative to the predictions from the CAT4 test. To estimate the Academic Achievement Quotient (ACHQ), we consider 100% meeting expectations as equivalent to performing at the CAT4 mean. We express this relative to a normal curve by dividing the percentage meeting expectations by 2. For instance, in 2023, 81% met the GAPS predictions; halving this value (0.81/2 = 0.405) places it relative to a mean of 0.50 on a normal curve. Applying a normal curve transformation results in a difference of 0.24 (NORMSINV(0.50) – NORMSINV(0.405)) relative to the CAT mean. Averaging this difference across subjects and years gives a Cohen’s d of 0.37. With a CAT4 mean of 94.84 for the two years with Rising Stars data (UK-normed), we adjust by subtracting 0.37 *15 from the mean CAT4 for these years, resulting in 89.29. Since the UK ACHQ mean is 0.43 points above the U.S. mean, we add this difference to arrive at 89.72 (USA-normed).
Figure 2. Relative Performance on Rising Star versus CAT4 Assessments, 2023-24

Note: Figure from the 2023-24 government report showing Year 6 attainment in government schools, based on end-of-year school-based tests. Performance is measured as the percentage of students meeting CAT4-predicted levels (CAT4 Predictor), Rising Stars (RS), and Key Stage 2 SATs (KS2 SATS) across GAPS, Reading, Writing, and Mathematics.
This result aligns closely with our earlier estimate of 89.48, based on the average of CXC and GMAT scores. Thus, estimates derived from three different tests—normed against Caribbean, U.S., and UK populations—converge. We adopt an ACHQ of 89.37 as the current best estimate for the Cayman Islands. This is lower than the NIQ of 92.88 (for 2021 to 2023), which is consistent with governmental reports noting a discrepancy between these metrics. For example, in 2023 it is noted:
When the KS2 data is compared against both CAT4 predictors and Rising Stars estimates for this cohort, a consistent pattern emerged: students consistently lag behind their predicted or estimated levels across all areas. The striking aspect is the substantial variances mathematics: 56pp and 33pp for CAT4 and RS, respectively (See Figure 12). This underperformance may stem from gaps in foundational knowledge, insufficient practice opportunities, or potential misalignment between instructional approaches and the skills measured by these assessments.
We consider both NIQ and NACHQ to measure “national cognitive ability,” so one might average the two for a combined estimate. However, for consistency in this series, we rely on ACHQ.
In the context of the Admixture in Americans project, results from the Cayman Islands are of limited value due to uncertainties in ancestry and cognitive ability estimates, and, more significantly, the high proportion of recent immigrants, who cannot be assumed to represent their home populations.
References
Economic and Statistics Office. (2021). The Cayman Islands’ Human Development Index report 2021. Economic and Statistics Office.
Department of Education Services, Cayman Islands Government [DES]. (2021–2024). Data reports for academic years 2020–21 to 2023–24. Cayman Islands Government.
Mathias, R. A., Taub, M. A., Gignoux, C. R., Fu, W., Musharoff, S., O’Connor, T. D., … & Barnes, K. C. (2016). A continuum of admixture in the Western Hemisphere revealed by the African Diaspora genome. Nature communications, 7(1), 12522.
Micheletti, S. J., Bryc, K., Esselmann, S. G. A., Freyman, W. A., Moreno, M. E., Poznik, G. D., … & Mountain, J. L. (2020). Genetic consequences of the transatlantic slave trade in the Americas. The American Journal of Human Genetics, 107(2), 265-277.
Simms, T. M., Rodriguez, C. E., Rodriguez, R., & Herrera, R. J. (2010). The genetic structure of populations from Haiti and Jamaica reflect divergent demographic histories. American Journal of Physical Anthropology: The Official Publication of the American Association of Physical Anthropologists, 142(1), 49-66.
Torres, J. B., Stone, A. C., & Kittles, R. (2013). An anthropological genetic perspective on Creolization in the Anglophone Caribbean. American journal of physical anthropology, 151(1), 135-143.
Vergara, C., Murray, T., Rafaels, N., Lewis, R., Campbell, M., Foster, C., … & Barnes, K. C. (2013). African ancestry is a risk factor for asthma and high total IgE levels in African admixed populations. Genetic epidemiology, 37(4), 393-401.
]]>. . .
France governs three overseas departments in the Americas—French Guiana, Guadeloupe, and Martinique—along with three overseas American collectivities: Saint Barthélemy (St. Barth), Saint Martin, and Saint Pierre and Miquelon. The populations of these territories display a rich diversity of ancestries, making them an interesting case study.
Saint Pierre and Miquelon, located off the coast of Canada, has a population of approximately 5,819 and is the most European-influenced of France’s overseas territories. Its residents are primarily descendants of French settlers from Normandy, Brittany, and other regions, supplemented by recent migrants from metropolitan France. Saint Barthélemy, a small Caribbean island that separated from Guadeloupe in 2007, has a population of around 10,000. Although France does not officially collect ethnic or racial data, visual observations of children in local primary schools and at festivals suggest the population is roughly 80% of European ancestry (mostly French), 15% of African ancestry, and 5% of other origins. This aligns with historical settlement records, which indicate a majority of French descent.
Figure 1. School and Festival Pictures from St. Barts

Guadeloupe and Martinique are primarily inhabited by admixed Afro-European populations, with additional contributions from descendants of South Asian Indian groups. A 2019 study by Mendisco et al. analyzed mtDNA and Y-DNA haplogroups from individuals whose grandparents were all born in Guadeloupe, estimating ancestry proportions. Averaging these maternal and paternal markers suggests that Guadeloupe’s population is approximately 25.5% European, 69% African, 0.25% Amerindian, and 5.3% other (mostly South Asian). These estimates, which do not account for recent immigration, reflect higher African maternal ancestry and greater European paternal contributions, consistent with the region’s colonial history. Given Martinique’s similar historical trajectory, its ancestry composition is likely comparable, though slight variations may arise from local differences in settlement and immigration patterns.
Notably, island-wide studies on sickle cell anemia suggest that both Guadeloupe and Martinique have lower levels of African ancestry compared to Anglo-Caribbean countries such as Jamaica, Saint Vincent and the Grenadines, Grenada, St. Lucia, and Tobago (Knight-Madden et al., 2019). As shown in Table 1, beta-S and beta-C gene frequencies—markers associated with African ancestry—are approximately 75% of the rates found in these other islands. Extrapolating from these figures suggests a somewhat lower African ancestry proportion of around 60%, since these other countries have around 80% African ancestry (when taking into account admixture in the respective Afro-Caribbean populations and the proportion of non-Afro-Caribbeans). However, due to the potential influence of genetic drift and selection on specific gene frequencies, the estimates based on Mendisco et al. (2019) remain the most reliable for these populations.
Table 1. Frequency Data on Sickle Cell-Related Alleles (β^S and β^C) by Country/Territory
| Country/Territory | β^S | β^C | β^S + β^C |
|---|---|---|---|
| Jamaica | 0.055 | 0.019 | 0.074 |
| Guadeloupe | 0.042 | 0.012 | 0.054 |
| Martinique | 0.04 | 0.011 | 0.051 |
| French Guiana | 0.04 | 0.011 | 0.051 |
| Tobago | 0.051 | 0.02 | 0.071 |
| Grenada | 0.054 | 0.017 | 0.071 |
| Saint Lucia | 0.06 | 0.012 | 0.072 |
| Haiti | 0.062 | 0.012 | 0.074 |
| Saint Vincent & Grenadines | 0.055 | 0.015 | 0.07 |
| Cuba | 0.011 | 0.003 | 0.014 |
Comprehensive admixture data for Saint Martin, a French overseas collectivity populated by admixed Afro-Caribbean groups, is limited. However, a study by Bera et al. (2001) examined HLA class I and II allele frequencies, revealing a population predominantly of African ancestry with a minor European component and no significant contributions from other groups. Based on this and comparisons with nearby islands like St. Kitts and Nevis, a rough estimate of Saint Martin’s ancestry might be approximately 80% African and 20% European, though this remains an approximation pending more detailed genetic analysis.
Figure 2. Festival Pictures from St. Martin

The majority of French Guiana’s population is comprised of recent immigrants and their descendants from countries such as Guyana, Suriname, Brazil, Haiti, China, Laos, Saint Lucia, and metropolitan France. The remainder includes Amerindians, Caribbean Creoles, and Maroons. Genetic studies suggest that the Maroons (Fortes-Lima et al., 2017), East Asians (Brucato et al., 2012), and Amerindians (Mazières et al., 2009) of this department exhibit little admixture. However, no genetic data is available for the Creole populations. Population admixture can be approximated by weighting ethnic or national groups according to their reported average ancestry; though official ethnic data is not collected in French Guiana various sources have reported estimates. The percentages provided, as detailed in Table 2, are plausible estimates.
Table 2: Admixture Estimates for French Guiana
| % Pop | African % | European % | Amerindian % | Other % | |
|---|---|---|---|---|---|
| Maroon | 15 | 98.00 | 2.00 | 0.00 | 0.00 |
| Creole | 25 | 80.00 | 20.00 | 0.00 | 0.00 |
| Amerindian | 3 | 0.68 | 9.56 | 89.76 | 0.00 |
| Guyana | 6 | 35.00 | 5.00 | 10.00 | 50.00 |
| Suriname | 12.5 | 40.00 | 5.00 | 5.00 | 50.00 |
| Brazilian | 9.3 | 19.60 | 68.10 | 11.60 | 0.00 |
| Haitian | 9.2 | 94.00 | 6.00 | 0.00 | 0.00 |
| Chinese | 3 | 0.00 | 0.00 | 0.00 | 100.00 |
| Laotian | 2 | 0.00 | 0.00 | 0.00 | 100.00 |
| St. Lucian | 3 | 71.67 | 18.22 | 7.22 | 2.90 |
| Metro. French | 12 | 2.83 | 87.20 | 0.00 | 9.97 |
| Weighted Ave. | 100 | 54.78 | 24.41 | 5.21 | 15.53 |
France is becoming increasingly less European in its demographic composition. Although ethnicity is not officially reported, detailed data on first- to third-generation immigrants by region of origin is available (INSEE, 2024). By combining this data with estimates of its overseas territories, admixture estimates can be derived for France as a whole. These estimates reveal a growing proportion of the population with North African and Middle Eastern ancestry, categorized here as “other.” The demographic shift, often described as the replacement of the indigenous French population, is substantially more pronounced among younger age groups, a trend partially obscured in overall population estimates. Admixture estimates for both France as a whole and its overseas departments and territories in the Americas are summarized in Table 3.
Table 3: Admixture Estimates for France and French American Possessions
| Country | Population | African % | European % | Amerindian % | Other % |
|---|---|---|---|---|---|
| France* | 68,373,647 | 4.97 | 84.67 | 0.00 | 10.36 |
| French Guiana | 292354 | 54.78 | 24.41 | 5.21 | 15.53 |
| Guadeloupe | 378561 | 69.00 | 25.50 | 0.25 | 5.30 |
| Martinique | 349,925 | 69.00 | 25.50 | 0.25 | 5.30 |
| St. Barth | 10,967 | 15.00 | 80.00 | 0.00 | 5.00 |
| St. Martin | 32489 | 80.00 | 20.00 | 0.00 | 0.00 |
| St. Pierre et Miquelon | 5819 | 0.00 | 100.00 | 0.00 | 0.00 |
*Including overseas France; North Africans included as “Other.”
Since the 2017–2018 school year, France has administered yearly academic achievement tests to sixth and tenth graders, with assessments later expanded to other grades. The language test evaluates reading comprehension, oral language, spelling, grammar, and vocabulary, while the math test assesses knowledge of numbers, computation, problem-solving, geometry, and measurements. As of the time of writing, means and standard deviations were available for sixth-grade tests (2017–2023) and tenth-grade tests (2019–2024) for French Guiana, Guadeloupe, and Martinique.
Additionally, since 1998, the Journée Défense et Citoyenneté (JDC) has required citizens aged 16–25 to take language comprehension tests, which include tests of word recognition and passage comprehension. Percentages of individuals facing difficulties are reported by department. We converted these rates for 2014–15, 2018–19, 2019–20, and 2022–23 into d-scores. Data was available for French Guiana, Guadeloupe, and Martinique. These test scores have been shown to correlate at r = .54 with a 66-item math test (Herrero et al., 2015). Although this correlation is substantially lower than the r = .85 found for PIAAC, it is relatively close to the r = .65 typically observed for academic achievement tests, such as the American NAEP tests.
Due to their smaller populations, data for Saint Pierre and Miquelon, Saint Barthélemy, and Saint Martin are less comprehensive, resulting in less precise estimates. Thus, for Saint Pierre and Miquelon, we additionally computed scores using all available data points, while for Saint Martin and Saint Barthélemy, we calculated results additionally for grade 4. These findings are presented in Tables 4 and 5 below, respectively.
Table 4. Tests Scores for Saint Pierre & Miquelon
| Language | Math | |||||||
|---|---|---|---|---|---|---|---|---|
| Year | Grade | France | SP&M | France | SP&M | |||
| % Satisfactory | % Satisfactory | d | % Satisfactory | % Satisfactory | d | Ave. d | ||
| 2023 | Cours Préparatoire | 78.90 | 76.10 | 0.09 | 81.60 | 74.00 | 0.26 | 0.18 |
| 2023 | Cours Élémentaire 1 | 77.40 | 85.30 | -0.30 | 68.00 | 76.80 | -0.26 | -0.28 |
| 2023 | Cours Moyen 1 | 64.30 | 57.60 | 0.17 | 56.60 | 56.30 | 0.01 | 0.09 |
| 2024 | Cours Moyen 2 | 0.16 | 0.01 | 0.09 | ||||
| 2019 | Middle school | -0.10 | -0.31 | -0.21 | ||||
| 2023 | Middle school | 0.13 | 0.11 | 0.12 | ||||
| 2023 | Middle school | 52.90 | 44.80 | 0.20 | 47.10 | 41.90 | 0.13 | 0.17 |
| 2019 | Middle school | -0.10 | -0.17 | -0.14 | ||||
| 2022 | Vocational School | 55.00 | 81.00 | -0.75 | 31.00 | 42.00 | -0.29 | -0.52 |
| 2022 | College Prep. | 92.00 | 95.00 | -0.24 | 77.00 | 84.00 | -0.26 | -0.25 |
Table 5. Test Scores for Saint Barthélemy and Saint Martin
| Language | Math | Average | ||||||
|---|---|---|---|---|---|---|---|---|
| d France / St. Martin | d France / St. Barts | d France / Martin | d France / St. Bars | d France / Martin | d France / St. Barts | d France / St. Barts | ||
| 6eme | 2019 | 0.94 | -0.06 | 1.16 | 0.36 | 1.05 | 0.15 | 0.15 |
| 6eme | 2020 | 1.36 | -0.02 | 1.00 | -0.47 | 1.18 | -0.24 | -0.24 |
| 6eme | 2021 | 1.34 | -0.23 | 1.12 | -0.24 | 1.23 | -0.23 | -0.23 |
| 6eme | 2022 | 1.16 | 0.29 | 1.03 | 0.27 | 1.09 | 0.28 | 0.28 |
| ave | 1.14 | -0.01 | -0.01 | |||||
| CE1 | 2019 | 0.95 | 0.15 | 0.65 | 0.23 | 0.80 | 0.19 | 0.19 |
| CE1 | 2020 | 1.10 | -0.01 | 0.68 | 0.07 | 0.89 | 0.03 | 0.03 |
| CE1 | 2021 | 1.24 | 0.21 | 0.66 | 0.04 | 0.95 | 0.13 | 0.13 |
| CE1 | 2022 | 1.13 | -0.07 | 0.71 | -0.06 | 0.92 | -0.07 | -0.07 |
| ave | 0.89 | 0.07 | 0.07 | |||||
| Grade 10 tech (LEGT R. Weinum & 2nde M. Choisy) | 2022 | 0.87 | 0.25 | 0.40 | -0.63 | 0.63 | -0.19 | -0.19 |
| Grade 10 prof (LP D. Jeffry & 2nde M. Choisy) | 2022 | 0.98 | 0.81 | 0.32 | -0.61 | 0.65 | 0.10 | 0.10 |
| ave | 0.64 | -0.04 | -0.04 |
For consistency, we rely on averages from sixth and tenth grades across these three collectivities, despite having only one year of tenth-grade data for Saint Martin, which was derived from a single school. For the overseas departments we averaged Grade 6, Grade 10, and the DofL test values. Results, alongside Human Development Index (HDI) and socioeconomic status (SES) data when available, are presented in Table 6 below. Academic achievement (ACHQ) and SES/HDI correlated strongly, with r-values ranging from .90 to .95, for regions with data. For the 13 Metropolitan French regions (that is, excluding overseas possessions) Grade 6 Math and Reading scores correlated at r = .69 with DofL scores, providing further support for the validity of the latter as measures of academic achievement.
Table 6. Test Scores, HDI, and S-factor for French Regions and Territories
| Region | Grade_6_ACH | Grade_10_ACH | DofL_ACH | ACH_ave | ACHQ | S-factor | HDI | |
|---|---|---|---|---|---|---|---|---|
| National | 0.000 | 0.000 | 0.000 | 0.000 | 99.28 | 0.886 | ||
| Auvergne-rhone-alpes | -0.101 | -0.142 | -0.121 | 101.10 | 0.727 | 0.881 | ||
| Bourgogne-franche-comte | -0.026 | 0.012 | -0.007 | 99.39 | 0.606 | 0.863 | ||
| Bretagne | -0.138 | -0.162 | -0.150 | 101.53 | 0.725 | 0.879 | ||
| Centre-val de loire | 0.008 | 0.039 | 0.024 | 98.93 | 0.683 | 0.865 | ||
| Corse | 0.059 | 0.210 | -0.112 | -0.026 | 99.68 | -0.17 | 0.843 | |
| Grand-est | -0.002 | -0.033 | -0.017 | 99.54 | 0.528 | 0.867 | ||
| Hauts-de-france | 0.137 | 0.036 | 0.087 | 97.98 | 0.294 | 0.852 | ||
| Ile-de-france | -0.069 | -0.147 | -0.108 | 100.90 | 0.708 | 0.93 | ||
| Normandie | 0.079 | 0.045 | 0.005 | 0.042 | 98.65 | 0.537 | 0.864 | |
| Nouvelle-aquitaine | -0.047 | -0.043 | -0.045 | 99.95 | 0.68 | 0.872 | ||
| Occitanie | -0.032 | -0.049 | -0.041 | 99.89 | 0.539 | 0.881 | ||
| Pays de la loire | -0.079 | -0.115 | -0.097 | 100.74 | 0.765 | 0.88 | ||
| Provence-alpes-cote d'azur | 0.004 | -0.090 | -0.043 | 99.92 | 0.391 | 0.883 | ||
| Guadeloupe | 0.460 | 0.565 | 0.700 | 0.575 | 90.66 | -1.194 | 0.841 | |
| French Guyane | 1.009 | 0.935 | 1.200 | 1.048 | 83.56 | -2.325 | 0.787 | |
| Martinique | 0.372 | 0.458 | 0.700 | 0.510 | 91.63 | -0.645 | 0.851 | |
| Mayotte | 1.496 | 1.589 | 1.800 | 1.628 | 74.86 | -2.176 | 0.764 | |
| La Reunion | 0.342 | 0.361 | 0.600 | 0.434 | 92.77 | -0.674 | 0.829 | |
| St-Pierre et Miquelon | -0.060 | -0.14 | -0.100 | 100.78 | ||||
| St. Martin | 1.140 | 0.64 | 0.890 | 85.93 | ||||
| St. Barthélemy | -0.01 | -0.04 | -0.025 | 99.66 |
Overseas departments and territories with less European influence tend to exhibit lower academic performance. This trend is holds when also considering the predominantly African population of Mayotte (Msaidie et al., 2011), the Afro-European-South Asian demographic mix of La Réunion (Berniell-Lee et al., 2008), and French Polynesia (not shown). However, the predominantly African Caribbean departments of Guadeloupe and Martinique demonstrate unexpectedly strong academic performance. The true ACHQ scores may even be higher insofar as JDC tests may be linguistically biased. However, that Guadeloupéens and Martiniquais do relatively better on the grade 6 and 10 language tests, which include an oral comprehension test, than the math tests would argue against linguistic bias. However, formal testing would be required to conclusively rule out any such bias.
While this analysis primarily focuses on achievement tests, findings from a study on IQ in the Guadeloupe population present a more complex picture. Oulhote et al. (2023) reported Raven’s Matrices scores for mothers and French-WISC scores for children from the TIMOUN mother-child cohort in Guadeloupe. The study involved 1,068 pregnant women recruited from the general population between November 2004 and December 2007, with a follow-up seven years later. Among the 569 children aged 7-8, the average WISC-IV score was 87.1 relative to the French mean. The 541 mothers achieved an average Standard Progressive Matrices (SPM) score of 35.4, equivalent to an Advanced Progressive Matrices (APM) score of 5.62 and an IQ of 70.79 based on British 1992 norms. Adjusted for the Flynn effect, this drops to 67.43. Averaging these scores yields a HVGIQ of 77 for Guadeloupe, which would need to be adjusted upwards a few points to align with U.S. metrics.
Jason Malloy also reported a low Raven’s Matrices score (IQ = 77, relative to the UK mean) for Guadeloupe, based on Massina et al. (2000). However, the Raven’s IQ scores are inconsistent with achievement test data, suggesting they may not accurately reflect the general cognitive ability of the population. Regardless, this series emphasizes academic achievement, which may diverge from nonverbal intelligence measures due to variations in schooling quality. This is evident in cases like Argentina, where achievement test scores are over 15 points lower than intelligence test scores.
Datafile, with sources.
References
Bera, O., Cesaire, R., Quelvennec, E., Quillivic, F., De Chavigny, V., Ribal, C., & Semana, G. (2001). HLA class I and class II allele and haplotype diversity in Martinicans. Tissue Antigens, 57(3), 200-207.
Berniell‐Lee, G., Plaza, S., Bosch, E., Calafell, F., Jourdan, E., Cesari, M., … & Comas, D. (2008). Admixture and sexual bias in the population settlement of La Reunion Island (Indian Ocean). American Journal of Physical Anthropology: The Official Publication of the American Association of Physical Anthropologists, 136(1), 100-107.
Brucato, N., Mazières, S., Guitard, E., Giscard, P. H., Bois, E., Larrouy, G., & Dugoujon, J. M. (2012). The Hmong diaspora: preserved south-east Asian genetic ancestry in French Guianese Asians. Comptes Rendus Biologies, 335(10-11), 698-707.
Dubut, V., Murail, P., Pech, N., Thionville, M. D., & Cartault, F. (2009). Inter‐and Extra‐Indian Admixture and Genetic Diversity in Reunion Island Revealed by Analysis of Mitochondrial DNA. Annals of Human Genetics, 73(3), 314-334.
Fortes-Lima, C., Gessain, A., Ruiz-Linares, A., Bortolini, M. C., Migot-Nabias, F., Bellis, G., … & Dugoujon, J. M. (2017). Genome-wide ancestry and demographic history of African-descendant Maroon communities from French Guiana and Suriname. The American Journal of Human Genetics, 101(5), 725-736.
Herrero, S., Huguet, T., & Vourc’h, R. (2015). Evaluation des compétences des jeunes en numératie lors de la JDC.[Assessing the numeracy skills of young adults during the JDC]. Educations Et Formations, 86, 259-282.
Institut National de la Statistique et des Études Économiques. (2024). La diversité des origines et la mixité des unions progressent au fil des générations. INSEE. https://www.insee.fr/fr/statistiques/6468640
Knight-Madden, J., Lee, K., Elana, G., Elenga, N., Marcheco-Teruel, B., Keshi, N., … & Hardy-Dessources, M. D. (2019). Newborn screening for sickle cell disease in the Caribbean: an update of the present situation and of the disease prevalence. International Journal of Neonatal Screening, 5(1), 5.
Malloy, J. (2014, July 16). HVGIQ: Guadeloupe. Human Varieties. https://web.archive.org/web/20140724072218/https:/humanvarieties.org/2014/07/16/hvgiq-guadeloupe/
Massina, C., Le Gall, D., Aubin, G., Mazaux, J.M., Galanthe, E., Sainte-Foie, S., & Emile, J. (2000). Une observation de la récupération différentielle des deux langues chez une patiente aphasique bilingue français-créole guadeloupéen. Annales de Réadaptation et de Médecine Physique, 43, 450-464.
Mazieres, S., Callegari-Jacques, S. M., Crossetti, S. G., Dugoujon, J. M., Larrouy, G., Bois, E., … & Salzano, F. M. (2011). French Guiana Amerindian demographic history as revealed by autosomal and Y-chromosome STRs. Annals of Human Biology, 38(1), 76-83.
Mendisco, F., Pemonge, M. H., Romon, T., Lafleur, G., Richard, G., Courtaud, P., & Deguilloux, M. F. (2019). Tracing the genetic legacy in the French Caribbean islands: a study of mitochondrial and Y‐chromosome lineages in the Guadeloupe archipelago. American Journal of Physical Anthropology, 170(4), 507-518.
Msaidie, S., Ducourneau, A., Boetsch, G., Longepied, G., Papa, K., Allibert, C., … & Mitchell, M. J. (2011). Genetic diversity on the Comoros Islands shows early seafaring as major determinant of human biocultural evolution in the Western Indian Ocean. European Journal of Human Genetics, 19(1), 89-94.
Oulhote, Y., Rouget, F., Michineau, L., Monfort, C., Desrochers-Couture, M., Thomé, J. P., … & Muckle, G. (2023). Prenatal and childhood chlordecone exposure, cognitive abilities and problem behaviors in 7-year-old children: the TIMOUN mother–child cohort in Guadeloupe. Environmental Health, 22(1), 21.
]]>Puerto Rico
Puerto Rico is a predominantly Spanish-speaking U.S. territory. Its residents have full citizenship—allowing free movement to the mainland. Currently, more Puerto Ricans live on the mainland (5.8 million in 2023) than on the island (3.2 million). Based on the average of 16 samples, individuals on the island of Puerto Rico have an average European, African, and Amerindian ancestry of 66.67%, 19.80%, and 13.53%, respectively. The samples are summarized in Table 1 below.
Table 1: Admixture Estimates for Puerto Rico
| N | Markers | European % | African % | Amerindian % | Total % | Source |
|---|---|---|---|---|---|---|
| 181 | 44 AIMs | 65.5 | 16.2 | 18.3 | 100 | Salari et al. (2005) |
| 135 | 44 AIMs | 60.2 | 20.2 | 19.6 | 100 | Choudhry et al. (2006) |
| 223 | 104 AIMs | 62.7 | 22.8 | 14.6 | 100.1 | Risch et al. (2009) |
| 310 | 12 AIMs | 69.89 | 24.45 | 5.66 | 100 | Erdei et al. (2011) |
| 642 | 93 AIMs | 63.7 | 21.2 | 15.2 | 100.1 | Via et al. (2011) |
| 133 | 99 AIMs | 70 | 19 | 11 | 100 | Avena et al. (2012) |
| 803 | genome-wide | 67 | 20.6 | 12.4 | 100 | Galanter et al. (2012) |
| 55 | genome-wide | 72.4 | 14.8 | 12.8 | 100 | Gravel et al. (2013) |
| 65 | 20 | 12 | 97 | Vilar (2014) | ||
| 70 | 250800 markers | 78.31 | 12 | 9.68 | 99.99 | Montinaro et al. (2015) |
| 26 | 250800 markers | 69.73 | 21.37 | 8.92 | 100.02 | Montinaro et al. (2015) |
| 53 | genome-wide | 61 | 27 | 12 | 100 | Mathias et al. (2016) |
| 104 | genome-wide | 73.2 | 13.9 | 12.9 | 100 | Martin et al. (2017) |
| 415 | 100 AIMs | 64 | 21 | 15 | 100 | Irizarry‐Ramírez et al. (2017) |
| 425 | 105 AIMs | 61 | 21.1 | 18 | 100.1 | Pérez-Mayoral et al. (2019) |
| 409 | 105 AIMs | 61.3 | 20.7 | 18 | 100 | Pérez-Mayoral et al. (2020) |
| Simple Ave. | 66.56 | 19.77 | 13.5 | 99.83 | ||
| Corrected Ave. | 66.67 | 19.8 | 13.53 | 100 |
Malloy previously reviewed a substantial body of intelligence studies on Puerto Ricans, estimating a territorial IQ of 84.6 based on 19 reasonably representative samples. However, this estimate depends on inclusion criteria and timeframe. In contrast, the Academic Achievement Quotient (ACHQ) was significantly lower, at approximately 71, based on NAEP math test scores from 2003 to 2005. Between 2011 and 2024, NAEP administered a Spanish version of the math test to Puerto Ricans, yielding an ACHQ of 76.06 relative to the U.S. average. Over the same period, mainland Puerto Ricans scored 93.61, while U.S. whites scored 104. The notably low NAEP scores in Puerto Rico remain puzzling. However, in the 2015 PISA study, students on the islands of Puerto Rico scored an equivalent of 85.64 on math and reading tests, leading to a final assigned ACHQ of 80.85 for Puerto Rico (based on the average of NAEP and PISA).
Another intriguing aspect is the minimal NAEP test score differences among Puerto Ricans on the island who identify as White, mixed White-Black, and Black, whereas clear differences exist among these groups on the mainland. Table 2 presents the results, as d-values relative to either the mean for Puerto Rico (in the case of Islanders) or that for the USA (in the case of mainlanders), for 8th graders in math from 2019 to 2024.
Table 2: Race Differences in Grade 8 NAEP Math among Puerto Ricans on the Island of Puerto Rico and on the Mainland
| Puerto Rico | Mainland | |||||
|---|---|---|---|---|---|---|
| Year | PR / PR White | PR / PR BW | PR / PR Black | USA / PR White | USA / PR BW | USA / PR Black |
| d | d | d | d | d | d | |
| 2024 | -0.04 | 0.04 | 0.09 | 0.16 | 0.44 | 0.65 |
| 2022 | -0.02 | -0.16 | 0.06 | 0.17 | 0.30 | 0.61 |
| 2019 | -0.02 | -0.28 | 0.11 | 0.27 | 0.52 | 0.74 |
| Average | -0.03 | -0.13 | 0.09 | 0.20 | 0.42 | 0.67 |
The trivial NAEP differences on the island are probably not due to a lack of difference in admixture between the groups. While only a few studies have reported ancestry percentages by self-reported race of Puerto Ricans, these studies suggest that both on the mainland and the island, White Puerto Ricans are 40% more European than Blacks, a difference similar to that observed among Brazilians. These results are summarized in Table 3.
Table 3: Admixture Estimates for Puerto Ricans by Self/Parent Report Race
| Location | Ethnic Group | N | European % | African % | Amerindian % | East Asians % | Source |
|---|---|---|---|---|---|---|---|
| Mainland USA | White | 125 | 79 | 12 | 8 | 1 | Fuerst & Hu (2023) |
| Mainland USA | White-Black | 13 | 59 | 35 | 4 | 2 | Fuerst & Hu (2023) |
| Mainland USA | Black | 39 | 37 | 55 | 5 | 3 | Fuerst & Hu (2023) |
| Puerto Rico | White/Blanco | 37 | 19 | Gravlee et al. (2009) | |||
| Puerto Rico | Mixed/Trigueno | 31 | 28 | Gravlee et al. (2009) | |||
| Puerto Rico | Black/Negro | 19 | 44 | Gravlee et al. (2009) | |||
| Puerto Rico | Black | 58 | 34.5 | 58.8 | 6.7 | 0 | Nieves‐Colón et al. (2024) |
A potential reason for the minor test score variations by self-reported race on the island might be an educational system so poor that it universally lowers scores. It would be valuable and likely feasible to conduct admixture studies using intelligence tests among Puerto Ricans on the island. Among mainland Puerto Ricans, Fuerst & Hu (2023) found a clear link between European ancestry and intelligence, though these findings may not necessarily apply to the island population.
Puerto Rico datafile.
U.S. Virgin Islands
The U.S. Virgin Islands are a territorial possession of the United States. According to the 2020 census, it has a population of 106,000 and an ethnic composition that is 64.2% Black, 12.7% White, and 18.4% Hispanic. Almost all of the inhabitants live on three main islands: St. Croix, St. John, and St. Thomas.
Due to population shifts driven by migration from Puerto Rico, the Dominican Republic, and the Anglo Caribbeans, estimating the ancestral makeup of the U.S. Virgin Islands is challenging. However, if we assume that Puerto Rican, Dominican, and Mexican migrants to the territory reflect the average ancestry of their countries of origin, that White Virgin Islanders share ancestry similar to White Americans, that Black Virgin Islanders align with the single estimate from Benn-Torres et al. (2013), and that non-Hispanic multiracial individuals represent a blend of White and Black Virgin Islander ancestry, we can formulate an educated guess, as shown in Table 4. Under these assumptions, the island would be approximately 36.02% European, 57.91% African, and 6.04% Amerindian.
Table 4: Admixture Estimates for the U.S. Virgin Islands
| % Population | Afr % | Eur % | Amer % | Other % | Source | |
|---|---|---|---|---|---|---|
| Non-Hispanic Black | 64.2 | 77.4 | 16.9 | 5.6 | 0 | Benn-Torres et al (2013) |
| Non-Hispanic White | 12.7 | 1 | 98 | 0 | 1 | Fuerst & Hu (2023) |
| Non-Hispanic Multiracial | 2.7 | 39.2 | 57.45 | 2.8 | 0.5 | Average (Fuerst & Hu (2023) & Benn-Torres et al (2013) |
| Non-Hispanic Other | 2 | |||||
| Hispanic Puerto Rican | 8.9 | 19.8 | 66.67 | 13.53 | 0 | HVG 2025 |
| Hispanic Dominican Republic | 6.2 | 38.98 | 52.34 | 8.68 | 0 | HVG 2025 |
| Hispanic Mexican | 0.6 | 4.4 | 39.01 | 55.91 | 0.68 | HVG 2025 |
| Hispanic Other | 2.7 | |||||
| Weighted Average | 57.8 | 35.95 | 6.03 | 0.02 | ||
| Weighted Average Corrected | 57.91 | 36.02 | 6.04 | 0.02 |
Malloy previously estimated a territorial achievement quotient (ACHQ) of 79.4 for the U.S. Virgin Islands, while our recalculation using the same NAEP data yields an ACHQ of 84.4; however, both figures underestimate current performance. Since 2014, the Virgin Islands has adopted the Smarter Balanced Assessment, a Common Core-based test primarily used in the North and West, which provides yearly norms allowing for the calculation of d values. We computed these for grades 6, 8, and 11 from 2014-15 to 2016-17, and for grades 6 and 8 from 2018-19 to 2022-23 (as high school scores were not disaggregated by year in later norms). The average d value is 0.71, translating to an ACHQ of 89.36—compared to a U.S. Black/White achievement gap of d = 0.72 for the same period. Note that these gaps are not directly comparable since the former uses the larger USA SD while the latter uses the smaller pooled SD for White and Black Americans. This estimate for the Virgin Islands may underestimate the ACHQ since it is relative to the scores of mostly North and Western states, which tend to perform better than Southern and Southeastern states. Correcting for this without detailed data would be difficult.
Figure 1: Usage of the Smarter Balanced Testing System

In the U.S. Virgin Islands, Hispanics perform slightly worse than Blacks on the Smarter Balanced Assessment, which is unsurprising given that many are Spanish-speaking immigrants from Puerto Rico and the Dominican Republic.

The reports do not provide a distinct category for Whites; instead, they include an “other” group that combines non-Hispanic Whites, Asians, non-responders, and mixed-race individuals. Since most non-responders are likely Black, this grouping underestimates ethnic performance differences. Consequently, the SAT offers a clearer measure of Black/White disparities on the island. We analyzed SAT data from 2016 to 2024, including 3,391 Blacks, 377 Whites, and 120 non-Hispanic mixed-race individuals (typically with Black and White parents), yielding d scores of 0.95 for Black/White differences and 0.31 for two or more/White differences. Results are shown in Table 5. Thus, unlike Puerto Rico, there seem to be pronounced self-identified race differences on the Virgin Islands.
Table 5: SAT Scores and Group Differences in the Virgin Islands (2016-2024)
| Year | VI Black | VI Two or more | VI White | VI Black / White | VI Two or more / White |
|---|---|---|---|---|---|
| N | N | N | d ave | d ave | |
| 2016 | 463 | 14 | 40 | 0.88 | 0.44 |
| 2017 | 529 | 17 | 52 | 0.89 | 0.28 |
| 2018 | 424 | 40 | 1.00 | ||
| 2019 | 448 | 14 | 38 | 1.10 | 0.11 |
| 2020 | 422 | 20 | 45 | 0.81 | -0.12 |
| 2021 | 294 | 14 | 37 | 0.85 | 0.33 |
| 2022 | 243 | 20 | 28 | 0.91 | 0.30 |
| 2023 | 284 | 11 | 43 | 1.00 | 0.82 |
| 2024 | 284 | 10 | 54 | 1.13 | 0.34 |
| Ave d | 0.95 | 0.31 |
US Virgin Islands datafile.
References
Avena, S., Via, M., Ziv, E., Pérez-Stable, E.J., Gignoux, C.R., Dejean, C., … & Fejerman, L. (2012). Heterogeneity in genetic admixture across different regions of Argentina. PLoS One, 7, e34695.
Choudhry, S., Burchard, E.G., Borrell, L.N., Tang, H., Gomez, I., Naqvi, M., … & Risch, N. J. (2006). Ancestry–environment interactions and asthma risk among Puerto Ricans. American Journal of Respiratory & Critical Care Medicine, 174, 1088-1093.
Erdei, E., Sheng, H., Maestas, E., Mackey, A., White, K. A., Li, L., … & Morse, D. E. (2011). Self-reported ethnicity and genetic ancestry in relation to oral cancer and pre-cancer in Puerto Rico. PLoS One, 6(8), e23950.
Fuerst, J., & Hu, M. (2023). Deep roots of admixture-related cognitive differences in the USA? Qeios.
Galanter, J.M., Fernandez-Lopez, J.C., Gignoux, C.R., Barnholtz-Sloan, J., Fernandez-Rozadilla, C., Via, M., … & LACE Consortium. (2012). Development of a panel of genome-wide ancestry informative markers to study admixture throughout the Americas. PLoS Genetics, 8, e1002554.
Gravel, S., Zakharia, F., Moreno-Estrada, A., Byrnes, J.K., Muzzio, M., Rodriguez-Flores, J.L., … & Bustamante, C.D. (2013). Reconstructing Native American Migrations from Whole-Genome and Whole-Exome Data. PLoS Genetics, 9, e1004023.
Gravlee, C. C., Non, A. L., & Mulligan, C. J. (2009). Genetic ancestry, social classification, and racial inequalities in blood pressure in Southeastern Puerto Rico. PLoS One, 4(9), e6821.
Irizarry‐Ramírez, M., Kittles, R. A., Wang, X., Salgado‐Montilla, J., Nogueras‐González, G. M., Sánchez‐Ortiz, R., … & Pettaway, C. A. (2017). Genetic ancestry and prostate cancer susceptibility SNPs in Puerto Rican and African American men. The Prostate, 77(10), 1118-1127.
Malloy, J. (2014, March 13). HVGIQ: U.S. Puerto Rico. Human Varieties.
Malloy, J. (2014, May 28). HVGIQ: U.S. Virgin Islands. Human Varieties.
Martin, A. R., Gignoux, C. R., Walters, R. K., Wojcik, G. L., Neale, B. M., Gravel, S., … & Kenny, E. E. (2017). Human demographic history impacts genetic risk prediction across diverse populations. The American Journal of Human Genetics, 100(4), 635-649.
Mathias, R. A., Taub, M. A., Gignoux, C. R., Fu, W., Musharoff, S., O’Connor, T. D., … & Barnes, K. C. (2016). A continuum of admixture in the Western Hemisphere revealed by the African Diaspora genome. Nature Communications, 7(1), 12522.
Montinaro, F., Busby, G. B., Pascali, V. L., Myers, S., Hellenthal, G., & Capelli, C. (2015). Unravelling the hidden ancestry of American admixed populations. Nature Communications, 6(1), 6596.
Nieves‐Colón, M. A., Ulrich, E. C., Chen, L., Torres Colón, G. A., Clemente, M. R., & Benn Torres, J. (2024). Genetic ancestry in Puerto Rican afro‐descendants illustrates diverse histories of African diasporic populations. American Journal of Biological Anthropology, 185(3), e25029.
Pérez-Mayoral, J., Soto-Salgado, M., Shah, E., Kittles, R., Stern, M. C., Olivera, M. I., … & Cruz-Correa, M. (2019). Association of genetic ancestry with colorectal tumor location in Puerto Rican Latinos. Human Genomics, 13, 1-11.
Risch, N., Choudhry, S., Via, M., Basu, A., Sebro, R., Eng, C., … & Burchard, E.G. (2009). Ancestry-related assortative mating in Latino populations. Genome Biology, 10, R132.
Salari, K., Choudhry, S., Tang, H., Naqvi, M., Lind, D., Avila, P.C., … & Ziv, E. (2005). Genetic admixture and asthma-related phenotypes in Mexican American and Puerto Rican asthmatics. Genetic Epidemiology, 29, 76-86.
Torres, J. B., Stone, A. C., & Kittles, R. (2013). An anthropological genetic perspective on Creolization in the Anglophone Caribbean. American Journal of Physical Anthropology, 151(1), 135-143.
Via, M., Gignoux, C.R., Roth, L.A., Fejerman, L., Galanter, J., Choudhry, S., … & Martínez-Cruzado, J.C. (2011). History shaped the geographic distribution of genomic admixture on the island of Puerto Rico. PLoS One, 6, e16513.
Vilar, M. (2014). Genographic project DNA results reveal details of Puerto Rican history. National Geographic: Changing Planet. Retrieved from https://blog.nationalgeographic.org/2014/07/25/genographic-project-dna-results-revealsdetails-of-puerto-rican-history.
]]>According to [our model], intergenerationally transmitted factors such as genes, epigenes and culture code for individual-level traits related to individuals’ ability to acquire knowledge and to develop better societies (e.g., a cultural appreciation of education and learning affecting the development of cognitive abilities). By this model, BGA acts as a crude index of the lines of descent along which the individual-level traits, the true causal factors, are passed… to deny a priori the possibility of our model, Ibarra equates an intergenerational model with a behavioral genetic one and then, incredibly, adopts a Blank Slate position. This is, of course, a doubly absurd argument. First, we stipulated that our model was an intergenerational, or genealogical, transmission, and not necessarily a behavioral genetic one. We made that point in three separate sections of the [original] paper.
This argument was not purely theoretical. We emphasized our skepticism of a simplistic genetic model by pointing to the exceptional performance of certain Caribbean nations, such as Barbados, which we discussed further:
It is notable that these estimates for Barbados are themselves high given that the country is about 90% West African in ancestry, a percent which leads to predicted national achievement/IQ scores in the low 70s. This is not a problem for our model, per se, since we assume a sticky but non-deterministic relation between BGA and national cognitive abilities. The relation can be so since national scores are not psychometrically equivalent to individual scores (e.g., Täht and Must, 2013). The latter primarily index hereditary general intelligence (at least in developed countries within a given cultural group) and therefore are relatively immalleable; the national level or “Big G” (Rindermann, 2007) scores, on the other hand, are subject to population level amplifiers and depressants that, we presume, work through the educational system and other social institutions.
We went on to explain:
The important question that more reliable Caribbean scores, in addition to more information on the performance of SIRE/BGA groups within nations, can help answer is whether the association between BGA and CA is more of a historic contingency, one that we can not comfortably extrapolate into the future, as would be the case with a purely cultural model, or if it is sticky, albeit elastic, owing to factors more firmly grounded in genealogical lines (e.g., genes or epigenes)
Interestingly, our model is not inconsistent with the anti-racist framework proposed by Lala and Feldman (2024), who argue that differences arise from vertical cultural transmission, enabling disparities to “persist through the legacies of inherited norms and institutions, inherited wealth and power, inherited values and traditions, and inherited environments that vary in their amenities and opportunities.” Why, then, is our model—and the research based on it—labeled abhorrent, while models like Lala and Feldman’s (2024) are praised? The apparent reason is our open-minded approach, which refuses to dismiss a partial genetic hypothesis a priori on moral grounds. However, to philosophers of science like Tabery, not presuming that differences are environmental in origin marks our work as ‘bad-guy science’ rather than ‘good-guy science.'”
Fortunately, outside of academia, we enjoy the freedom to explore diverse theories about the origins of differences with an open mind. Regarding variations in national cognitive scores, our reasoning is as follows: If these differences are primarily environmental in origin, we would expect wealthier Caribbean nations—boosted by tourism or tax-haven economies—to achieve scores similar to those of European countries. Conversely, if differences are primarily hereditary, the scores of Caribbean countries with predominantly African ancestry should mirror those of African nations. It’s important to note, however, that national and regional-level scores are not directly comparable to individual-level scores due to systematic country-level effects. Despite this complication, the general pattern described is what one would typically expect. Among sovereign countries, cognitive achievement data is missing for Barbados and Bermuda. We will consider those countries here in detail.
. . .
Barbados is a small island nation in the Caribbean with a population of approximately 280,000 individuals. Historically, it was a British colony from 1625 until gaining independence in 1966. Its economy was initially driven by sugar production before diversifying into tourism and international business in the 20th century. Today, Barbados ranks 62nd out of 193 countries in the United Nations’ Human Development Index (HDI) as of 2022, with a score of 0.809, placing it in the “very high human development” category—reflecting strong achievements in life expectancy, education, and income per capita.
According to the 2010 census, 92.4% of the population identifies as Afro-Barbadian, while 3.1% identifies as mixed, 2.7% as White, 1.3% as East Indian, and 0.5% as other. At least five published studies have reported on the ancestry composition of Barbadians or Afro-Barbadians. These are summarized in Table 1 below and they indicate that Afro-Barbadians are approximately 85% African and 13% European in ancestry. Treating White Barbadians as fully European and while treating self-reported mixed Barbadians as intermediate between Afro and White Barbadian, we estimate the population as a whole to be about 80% African and 17% European in ancestry. This aligns with the ancestry composition of the British Windward Islands.
Table 1: Admixture estimates for the Barbados
| Author | Ethnicity | N | Weight | % Afr | % Eur | % Amer | % Other |
|---|---|---|---|---|---|---|---|
| Benn-Torres et al. (2007) | Afro-Carib | 95 | 1 | 89.60 | 10.20 | 0.20 | 0.00 |
| Murray et al. (2010) | Afro-Carib | 294 | 1 | 77.40 | 15.90 | 6.70 | |
| Montinaro et al. (2015) | Afro-Carib | 75 | 1 | 87.70 | 11.70 | 0.00 | 0.60 |
| Mathias et al. (2016) | NR | 39 | 1 | 84.00 | 16.00 | 0.00 | 0.00 |
| Martin et al. (2017) | Afro-Carib | 96 | 1 | 88.00 | 11.70 | 0.30 | 0.00 |
| Afro-Barbadian | 85.34 | 13.1 | 0.125 | 1.46 | |||
| All Barbados | 80.05 | 16.60 | 0.10 | 3.25 |
African countries typically score about two standard deviations, or 30 points, lower than predominantly White European countries on academic achievement tests. Considering this disparity and factoring in ancestry, we can estimate that Barbados would score around 76 in comparison to these European countries (given a simple vertical transmission model). However, when adjusting to a scale normed to the USA—where White Americans score about 4 points higher on similar tests—the expected score for Barbados adjusts to approximately 80.
Our data, although limited, indicate a significantly higher capability for Barbadians. Between 2000 and 2020, 619 individuals from Barbados who took the GMAT achieved an average score of 94 compared to the US mean and 92.2 relative to the US White GMAT mean.
Additionally, Becker’s data suggests a measured IQ of 95.75 relative to the US mean. However, Becker’s analysis contains significant flaws, primarily due to the use of overlapping samples, which resulted in double counting. I contributed to this error by providing unclear data. The latest data include samples from the Barbados Nutrition Study (Waber et al., 2014) and their offspring (Waber et al., 2018). These studies followed a cohort born in Barbados from 1967 to 1972, assessing both a malnourished groups (suffering from Marasmus or Kwashiorkor) and a control group, along with the children of both groups. Based on the control group and their children, we estimate a national IQ of 90.83 relative to the American mean. These results are detailed in Table 2 and were calculated using Becker’s Flynn effect correction (FEC) calculator. Notably, while there might be a case for including children of the malnourished group, given the unlikely intergenerational transmission of malnutrition effects, we use only data from the control group and their children.
Table 2: Summary of IQ Data for Samples from Barbados, With and Without Flynn Effect Corrections
| WASI | WRAT-III | WAIS-III DS & LN | |||||||
|---|---|---|---|---|---|---|---|---|---|
| Age | N | Reported M | FEC M | Reported M | FEC M | Reported M | FEC M | Average | |
| Control | 38.13 | 59 | 99.03 | 96.65 | 88.96 | 84.54 | 92.35 | 88.95 | 90.05 |
| Malnutritioned | 38.36 | 77 | 82.83 | 80.45 | 74.59 | 70.17 | 82.35 | 78.95 | 76.52 |
| Children of control | 19.7 | 50 | 99.10 | 96.72 | 91.20 | 86.78 | 91.75 | ||
| Children of malnutritioned | 19.3 | 64 | 89.60 | 87.22 | 86.27 | 81.85 | 84.53 |
Unfortunately, the PIRLS data for Barbados was never published. However, it is feasible to estimate achievement scores based on relative performance in the Caribbean Examinations Council (CXC) exams. Established in 1972, the CXC administers standardized tests for secondary school students across the Caribbean, offering qualifications like the Caribbean Secondary Education Certificate (CSEC) typically taken around ages 16 to 18. These exams cover a wide array of subjects, from mathematics and English to sciences, humanities, and vocational areas, assessing students’ academic and technical skills. Internationally recognized, CXC exams are key to higher education and employment, aligning with the region’s educational standards.
Frequently cited by the World Bank as indicators of educational achievement, the CXC consortium and local ministries report regional and country-specific pass rates, respectively. These pass rate differences can be transformed into deviation scores relative to the Caribbean average. With both international achievement and CXC scores available for many countries, it is possible to compute a national CXC quotient (CXCQ) in a manner similar to Harmonized test scores. Deviation scores were calculated annually relative to the regional average for the years 2010 to 2024 (when available). Summary results are reported in Table 3, with more detailed data accessible via the provided link.
Table 3: Summary of CXC scores
| Altinok et al. ACHQ | MICS FLS | CXC_Math | CXC_English | CXC Ave | Predicted ACHQ | |
|---|---|---|---|---|---|---|
| Cayman Islands | -0.28 | -0.13 | -0.21 | 85.41 | ||
| Brittish Virgin Islands | -0.50 | -0.67 | -0.59 | 91.15 | ||
| Barbados | -0.38 | -0.38 | -0.38 | 87.99 | ||
| Turks & Caicos | 92.12 | 0.06 | -0.07 | 0.00 | 82.37 | |
| Montserratt | -0.22 | -0.17 | -0.19 | 85.24 | ||
| Anguilla | -0.04 | -0.32 | -0.18 | 84.99 | ||
| Trinidad/Tobago | 91.97 | 90.50 | ||||
| Jamacia | 81.30 | 85.29 | ||||
| Guyana | 75.19 | 92.51 | 0.18 | 0.20 | 0.19 | 79.47 |
| St. Kitts | 84.59 | |||||
| Dominica | 83.80 | |||||
| Belize | 71.93 | |||||
| St. Lucia | 85.89 | |||||
| St. Vincent | 81.94 | |||||
| Antigua and Barbuda | 84.28 | |||||
| Grenada | 82.44 | |||||
| Average | 82.33 | 89.43 | 0.00 | 0.00 | 0.00 |
Based on a decade of data, Barbados has achieved a CXC quotient score of 87.99. Averaging this with the GMAT scores yields a tentative academic achievement quotient (ACHQ) of 90.99, which closely aligns with the estimated IQ. This analysis also offers preliminary ACHQ estimates for the British territories of the British Virgin Islands (86.44), Montserrat (88.95), and Anguilla (84.99) — averaging CXC and GMAT results. These estimates are very preliminary and will need updates following the release of the MICS results for the British Virgin Islands and Anguilla.
. . .
The Bahamas, an archipelago in the Caribbean consisting of around 700 islands, has a population of approximately 400,000 according to 2025 estimates. It was under British control from 1718, primarily to combat piracy, until gaining independence in 1973. In 2022, the Bahamas ranked 57th in the Human Development Index with a score of 0.820, reflecting very high human development. The nation’s economy relies heavily on tourism and financial services, with tourism accounting for about 70% of GDP.
According to the 2010 census, approximately 90.6% of the Bahamian population identifies as African descent, 4.7% as White, 2.1% as mixed, and 1.9% as other. Several studies have examined the ancestry composition of admixed Bahamians, though it’s unclear if these include only self-identifying Afro-Bahamians. Summarized in Table 4, these studies show that admixed Bahamians are about 81.5% African and 15% European in ancestry. Assuming that self-identifying White and other Bahamians are unadmixed, the overall population is estimated to be roughly 75.5% African and 18.5% European in ancestry.
Table 4: Admixture estimates for the Bahamas
| Author | Ethnicity | N | Weight | % Afr | % Eur | % Amer | % Other | |
|---|---|---|---|---|---|---|---|---|
| Micheletti et al. (2020) | >5% Afr | 65 | 1 | 79.3 | 19.5 | 0.6 | 0.6 | |
| Godinho (2008) | NR | 157 | 1 | 85.2 | 6.8 | 8 | ||
| Simms et al. (2012) | NR | L. Island | 87 | 5.45% | 65.40 | 26.90 | 0.00 | 7.70 |
| Simms et al. (2012) | NR | Abaco | 111 | 4.20% | 75.00 | 23.50 | 0.00 | 1.50 |
| Simms et al. (2012) | NR | N. Providence | 221 | 74.50% | 79.70 | 19.60 | 0.60 | 0.00 |
| Simms et al. (2012) | NR | Eleuthera | 112 | 2.32% | 80.30 | 13.70 | 6.00 | 0.00 |
| Simms et al. (2012) | NR | G. Bahamas | 133 | 11.70% | 86.70 | 8.80 | 3.90 | 0.50 |
| Simms et al. (2012) | NR | Exuma | 92 | 1.83% | 90.40 | 3.70 | 5.90 | 0.00 |
| w-average | 535 | 1 | 79.75 | 18.47 | 1.15 | 0.54 | ||
| Admixed BHS | 81.42 | 14.92 | 3.25 | 0.57 | ||||
| All BHS | 75.47 | 18.53 | 3.25 | 2.47 | ||||
Regarding cognitive data, between 2000 and 2020, 619 Bahamians who took the GMAT scored an average of 83.35 relative to the US mean and 81.55 relative to the US White GMAT mean. Jason Malloy summarized two IQ studies involving a total of 723 individuals, from which Becker derived a national IQ of 91.01. However, the most recent study is now over 25 years old.
If we are willing to accept a few reasonable assumptions, there is another data source available. To evaluate learning loss post-Covid, the Bahamas government contracted with Renaissance Learning Inc., a US-based company, to administer Star reading and math assessments. Details about this assessment can be found in Wyse et al. (2020). Approximately 30,000 students participated in the first round of testing in 2022. The Minister of Education reported that, on average, 44% of students required “urgent intervention” (ZNS Bahamas, 2023). These Star assessments are normed against US populations, and the “urgent intervention” benchmark corresponds to scoring below the 10th percentile rank.
The 10th percentile corresponds to a Z-score of -1.281 or an IQ equivalent of 80.77. Given that 44% of students scored below this threshold, the estimated mean IQ-metric scores would be 83.04, relative to a US mean of 100. Assessments were normed in 2017, while testing occurred in 2022/2023. There was probably Covid-related learning loss owing to school closures. Based on NAEP data, between 2017 and 2022, White Americans lost 3.05 IQ-metric points. When adjusted for the Bahamas’ score, it results in a mean of 86.09 – similar to the GMAT-based estimate of 83.35. We tentatively take 86.09 as the estimated national achievement score. (Note: The underlying data can be accessed through Freedom of Information Act requests for Native Bahamians. If we find someone to submit a request, we could refine our estimates using the means and standard deviations.)
Bahamians also participated in the 2014 LAPOP survey, which included four political knowledge questions:
• The name of the US President
• The continent on which Nigeria is located
• The length of term for the President, Prime Minister, or Government
• The size of the Lower House
Political knowledge sum scores were computed by self-reported race/ethnicity and interviewer-rated color. These scores, transformed into an IQ metric with a mean of 100, along with the average years of education for each group, are presented in Table 5 below.
Table 5: Distribution of Political Knowledge and Education Levels by Self-Identified Race/Ethnicity in the Bahamas (LAPOP 2014)
| Ethnicity | N | Political knowledge | Years of schooling |
|---|---|---|---|
| White | 92 | 106.57 | 13.04 |
| Indigenous | 11 | 96.95 | 12.64 |
| Black | 3151 | 99.53 | 11.84 |
| Mixed | 153 | 105.65 | 12.79 |
| Other | 13 | 103.98 | 12.32 |
Knowledge sum scores were found to correlate negatively with darker color among Bahamians. The specific correlations for different groups are as follows:
• All Bahamians: r = -0.187 (N = 3404)
• Black Bahamians: r = -0.155 (N = 3128)
• Mixed Bahamians: r = -0.192 (N = 149)
Adjusting for age and sex did not significantly alter these correlations. Additionally, the results were consistent with those observed for years of education, indicating a robust pattern. These findings suggest potential ethnic, color, and ancestry differences in cognitive scores among Bahamians, which may merit further exploration.
References
Fuerst, J., & Kirkegaard, E. O. (2016). The genealogy of differences in the Americas. Mankind Quarterly, 56(3), 425.
Ibarra, L. (2016). Statistics vs scientific explanation. Mankind Quarterly, 56(3).
Lala, K. N., & Feldman, M. W. (2024). Genes, culture, and scientific racism. Proceedings of the National Academy of Sciences, 121(48), e2322874121.
Matthews, L. J., Tabery, J., & Turkheimer, E. (2024). How to diagnose abhorrent science. Hastings Center Report, 54(6), 18-29.
Putterman, L., & Weil, D. N. (2010). Post-1500 population flows and the long-run determinants of economic growth and inequality. The Quarterly journal of economics, 125(4), 1627-1682.
Waber, D. P., Bryce, C. P., Girard, J. M., Zichlin, M., Fitzmaurice, G. M., & Galler, J. R. (2014). Impaired IQ and academic skills in adults who experienced moderate to severe infantile malnutrition: a 40-year study. Nutritional neuroscience, 17(2), 58-64.
Waber, D. P., Bryce, C. P., Girard, J. M., Fischer, L. K., Fitzmaurice, G. M., & Galler, J. R. (2018). Parental history of moderate to severe infantile malnutrition is associated with cognitive deficits in their adult offspring. Nutritional Neuroscience, 21(3), 195-201.
Wyse, A. E., Stickney, E. M., Butz, D., Beckler, A., & Close, C. N. (2020). The potential impact of COVID‐19 on student learning and how schools can respond. Educational Measurement: Issues and Practice, 39(3), 60-64.
ZNS Bahamas (2023, June 16). 2023-24 Budget Debate: Learning Loss. ZNS Bahamas News. https://znsbahamas.com/2023-24-budget-debate-learning-loss/
]]>- Antilok et al.’s Harmonized Test Score (HTS) Dataset: Used to create the World Bank’s Harmonized Test Scores (HTS), this dataset covers all but three sovereign countries—Barbados, the Bahamas, and Suriname. Scores were averaged over 5-year intervals from 2000 to 2020, except for Bolivia, where data from 1995–2000 was used.
- Becker’s 2023 National IQ Scores: These measure a construct distinct from achievement scores and rely primarily on convenience samples.
- GMAT-Based Scores: Previously utilized in an earlier paper, these scores have been updated. They cover 2000–2020 data, except for small territories (e.g., Aruba, British Virgin Islands, Guadeloupe, Martinique, Montserrat, and Netherlands Antilles), where 1980s–2020 data was included due to limited 2000–2020 sample sizes and the absence of a clear secular trend.
The table below presents scores in an IQ-metric format (M = 100, SD = 15) derived from these sources. The U.S. average is standardized to 100.00. For reference, the American White scores were also added. Becker’s National IQs and GMAT scores differ from achievement-based measures: the former reflects convenience sampling, while the latter is based on unrepresentative populations (applicants to English-language MBA programs). Countries and territories lacking achievement test data are highlighted in bold.
Available Cognitive Scores for American Countries and Territories (and Countries with Overseas Territories)
| Country/ Territory | Altinok et al. | MICS6 Grade 2/3 | Becker (2023) | GMAT 00-20* | ||
|---|---|---|---|---|---|---|
| HTS | FLS | QWIQ | ||||
| M | M | M | M | N | ||
| USA White | 104.15 | 103.77 | 101.80 | |||
| USA | 100.00 | 100.00 | 100.00 | 2,111,539 | ||
| Antigua-Barbuda | 84.28 | 88.90 | 222 | |||
| Anguilla | GBR Territory | |||||
| Argentina | 84.25 | 99.58 | 106.90 | 8,761 | ||
| Aruba | NL Constituent country | 85.50 | 126* | |||
| Bahamas | 91.01 | 83.35 | 1,178 | |||
| Barbados | 95.75 | 94.00 | 619 | |||
| Belize | 71.93 | 87.85 | 405 | |||
| Bermuda | GBR Territory | 97.25 | 99.85 | 130 | ||
| Bolivia | 79.63 | 81.41 | 91.45 | 1,571 | ||
| Brazil | 81.88 | 89.13 | 103.30 | 39,174 | ||
| British Virgin Islands | GBR Territory | 81.73 | 90* | |||
| British West Indies | GBR collection of territories | 83.82 | 137* | |||
| Canada | 100.56 | 102.43 | 104.65 | 136,891 | ||
| Cayman Islands | GBR Territory | 94.45 | 119 | |||
| Chile | 85.71 | 93.94 | 104.95 | 9,290 | ||
| Colombia | 82.03 | 89.71 | 94.75 | 17,215 | ||
| Costa Rica | 86.58 | 93.16 | 97.30 | 1,774 | ||
| Cuba | 98.88 | 87.84 | 88.45 | 333 | ||
| Curacao | NL Constituent country | 82.00 | 40 | |||
| Denmark | 101.37 | 101.55 | 102.40 | 2,915 | ||
| Dominica | 83.80 | 70.08 | 84.10 | 335 | ||
| Dominican Republic | 72.86 | 93.21 | 88.30 | 1,932 | ||
| Ecuador | 81.61 | 82.30 | 89.50 | 3,659 | ||
| El Salvador | 82.94 | 93.55 | 1,395 | |||
| Falkland Islands | GBR Territory | 102.85 | 26 | |||
| France | 99.28 | 105.99 | 103.45 | 61,431 | ||
| French Guiana | FR Overseas department | |||||
| Greenland | DK Territory | 98.74 | ||||
| Grenada | 82.44 | 84.25 | 277 | |||
| Guadeloupe | FR Overseas department | 94.15 | 45* | |||
| Guatemala | 79.13 | 65.35 | 93.70 | 1,638 | ||
| Guyana | 75.19 | 92.51 | 85.60 | 555 | ||
| Haiti | 73.90 | 92.66 | 81.55 | 1,236 | ||
| Honduras | 79.58 | 87.70 | 1,583 | |||
| Jamaica | 81.30 | 85.29 | 79.23 | 86.50 | 4,470 | |
| Martinique | FR Overseas department | 91.79 | 137* | |||
| Mexico | 86.87 | 94.50 | 94.90 | 35,595 | ||
| Montserrat | GBR Territory | 92.65 | 45* | |||
| Netherland Antilles | NL Geographic region | 84.07 | 88.35 | 868* | ||
| Netherlands | 101.74 | 104.42 | 97.75 | 23,074 | ||
| Nicaragua | 77.49 | 64.28 | 90.25 | 1,010 | ||
| Panama | 77.40 | 90.10 | 1,489 | |||
| Paraguay | 77.80 | 92.65 | 446 | |||
| Peru | 79.21 | 89.40 | 102.40 | 14,566 | ||
| Puerto Rico | USA Territory | 82.78 | 85.95 | 86.20 | 1,459 | |
| Spain | 97.29 | 96.62 | 106.30 | 22,282 | ||
| Saint Barthélemy | FR Territory | |||||
| Saint Pierre and Miquelon | FR Territory | |||||
| St. Kitts and Nevis | 84.59 | 80.95 | 246 | |||
| St. Lucia | 85.89 | 86.65 | 365 | |||
| St. Martin (French) | FR Territory | |||||
| St. Martin (Dutch) | NL Constituent country | |||||
| St. Vincent & Grenadines | 81.94 | 67.48 | 83.95 | 128 | ||
| Suriname | 78.18 | 84.70 | 145 | |||
| Trinidad/Tobago | 91.97 | 90.50 | 95.35 | 2,938 | ||
| Turks/Caicos | GBR Territory | 92.12 | ||||
| United Kingdom | 100.43 | 103.38 | 108.25 | 37,542 | ||
| Uruguay | 89.72 | 105.55 | 1,226 | |||
| US Virgin Islands | USA Territory | 70.45 | 381 | |||
| Venezuela | 84.82 | 86.43 | 93.85 | 9,048 |
Compiling comparable data for the remaining American countries and territories poses significant challenges. In this and subsequent posts, I will document estimates for these regions in a series of statistical notes. One promising yet underexplored resource is UNICEF’s Multiple Indicator Cluster Surveys (MICS), accessible via IPUMS-MICS and UNICEF. MICS provides nationally representative raw data on foundational learning skills (FLS) for children aged 7–14, based on material typically taught in Grades 2–3 (ages 7–8). The skills are defined as follows:
Foundational Learning Skills (FLS) Definitions
- Reading: A child demonstrates foundational reading skills by:
- Accurately reading at least 90% of words in a Grade 2-level story (word count varies by language and country).
- Correctly answering three literal comprehension questions (e.g., “What did [name] see on [his/her] way home?”).
- Correctly answering two inferential comprehension questions (e.g., “Why is [name] happy?”).
- Numeracy: A child demonstrates foundational numeracy skills by correctly completing:
- Number reading (6 questions, e.g., “Child recognizes symbol: 48”).
- Number discrimination (5 questions, e.g., “Child identifies the larger number: 65 or 67”).
- Addition (5 questions, e.g., “Child correctly adds: 13 + 6”).
- Number pattern recognition (5 questions, e.g., “Child identifies the missing number: 20 – X – 40 – 50”).
Data Availability and Methodology
MICS data is currently available for 46 countries and territories. The raw data includes individual responses, while summary reports provide the percentage of children achieving FLS, broken down by grade and age. Although means and standard deviations could be computed or item-level biases analyzed, this analysis focuses on observed FLS percentages. Given the value of both grade- and age-based metrics, we averaged these percentages and proceeded as follows:
- Combined reading and numeracy FLS percentages.
- Developed regression equations to predict World Bank HTS scores.
For the 40 countries with both HTS and FLS data, correlations between the two measures ranged from 0.64 to 0.65.
HTS Score Estimation
HTS scores were estimated by averaging results from four regression equations:
- Grade 2/3 FLS → HTS
- Grade 2/3 HTS → FLS
- Age 8/9 FLS → HTS
- Age 8/9 HTS → FLS
Since most countries in the dataset are low-scoring, regression equations using FLS as the dependent variable were downwardly biased for high achieving countries, while those using HTS as the dependent variable were upwardly biased for those same countries. This pattern is illustrated in the figures below. To mitigate bias, scores were computed in both directions and averaged.
Results
The dataset includes 46 estimated Harmonized Test Scores (HTS), ranging from 104 for North Korea to 71 for the Central African Republic. These results are detailed in the accompanying data file. Notable findings for countries in the Americas include:
-
-
- Suriname: Functional Literacy Score (FLS) = 78.18.
(no alternative HTS measure is available).
-
-
- Guyana: FLS = 92.51, HTS = 75.19.
-
- Jamaica: FLS = 85.29, HTS = 81.30.
-
- Turks and Caicos: FLS = 92.12 (no alternative HTS measure is available.) However, Jason Malloy identified a single IQ test, estimating an IQ of 89.4 for 150 third graders, based on Australian norms. This estimate closely aligns with the FLS-based estimate, which is calibrated relative to the U.S. mean ACHQ—a standard a few points below Australian norms.
The MICS FLS dataset offers a novel method for estimating national and international test scores, particularly for countries lacking HTS data. Future improvements could involve incorporating additional covariates or investigating item-level biases. The publicly available raw data also presents opportunities to explore hypotheses, such as potential ethnic group differences within countries. MICS surveys have either been conducted or are in preparation for Anguilla, Belize, British Virgin Islands, Cuba, Dominican Republic, Guatemala, Panama, and Saint Lucia, which will provide further data with which to update national score estimates.
CONTENT
- Bad abstracts are intentional and widespread
- So many kinds of misleading reports
- Unintended consequences of publishing regulations
- The inherent “failure” of free markets
- A thought on private funding
It is predictable that the average readers don’t even bother to read more than the abstract, because they “lack” time (but they don’t “lack” time reading and posting memes). On the other hand, it is also more “productive” to cite more studies by merely reading the abstract because most readers are not familiar with the advanced statistics used and even if they are, they might just be “lazy”. Copium prevails, with the belief that the scientists know what they are doing and that the peer reviews are competent enough. The reality is that most research don’t replicate, many reports in the abstract are misleading. Moreover, there is no such a thing as widespread consensus in research, based on the very low inter-rater reliability of journal peer reviews (Bornmann et al., 2010).
My own strategy has always been, for many years, to read the papers, focusing on the method and result sections, and discussion section whenever an alternative interpretation is needed. I use no shortcuts such as reading other review papers because most of the time, they provide very little details and are almost never critical of the studies, and I usually find flaws where other reviews find none. This is however time consuming, and only nerds, freaks or zombies select this route.
1. Bad abstracts are intentional and widespread
Several reports highlighted some serious discrepancies between statements in abstract and the actual findings across various fields or journals, such as psychiatry and psychology (Harris et al., 2002; Jellison et al., 2020), pharmacy (Ward et al., 2004), medicine and biomedicine (Pitkin et al., 1999; Estrada et al., 2000; Boutron et al., 2010; Lazarus et al., 2015; Li et al., 2017), lung cancer (Altwairgi et al., 2012), rheumatology (Mathieu et al., 2012), pediatric orthopedic (Jones et al., 2021; Kamel & El-Sobky, 2023), low back pain research (Nascimento et al., 2020). Misleading abstracts appear to be quite severe in medical journals. In biomedical research, industry-funded publications showed a very high proportion of misleading abstract, while none were found in nonindustry-funded publications (Alasbali et al., 2009). In psychiatry and psychology journals, industry funding is not associated with increased odds of abstract spin (Jellison et al., 2020). Articles reporting negative results are more likely to contain misleading abstract conclusions (Mathieu et al., 2012), probably due to publication bias against negative results (Olson et al., 2002; Fanelli et al., 2010). A non-trivial portion of reproductive medicine studies report p-values without effect sizes in their abstracts (Feng et al., 2024). Statistically significant outcomes have a higher odds of being fully reported (Chan et al., 2004a, 2004b). A more pervasive form of reporting bias is the selective reporting of analyses, which could arise from changes in the specification of the composite outcome between abstracts, methods, and results sections, as well as multiple other discrepancies in methods between protocols and publications (Dwan et al., 2014). Indeed, the focus on positive findings in the abstract is strong whenever multiple outcomes have been studied (Duyx et al., 2019). These problems are compounded by the much higher chance for positive results (i.e., studies with successfully proven hypothesis) to be accepted by journals and to be cited in the literature (Mlinarić et al., 2017; Scherer et al., 2018). Pressure to publish increases bias, since the frequency of positive results in the abstract and/or full-text is higher in more competitive and productive academic environments (Fanelli et al., 2010). The strong focus on positive results in abstracts will also cause bias in systematic reviews due to how systematic search is conducted (Scherer et al., 2018; Duyx et al., 2019). The bias for positive results may explain why 70% of all medical and biological researchers failed to reproduce other researchers’ results (Baker, 2016) or why 50% of top cancer studies fail to replicate (Mullard, 2021).
Boutron & Ravaud (2018) illustrate several malpractices that attempt to present the study more favorably, such as hypothesizing after results are known (HARK) or justifying after results are known (JARK). And more generally:
Rhetoric, defined as language designed to have a persuasive or impressive effect, can be used by authors to interest and convince the readers (5). Any author can exaggerate the importance of the topic, unfairly dismiss previous work on it, or use persuasive words to convince the reader of a specific point of view (40, 41). Based on our and others’ experience (40, 41), a typical article might declare that a certain disease is a “critical public health priority” and that previous work on the topic showed “inconsistent results” or had “methodologic flaws.” In such cases, the discussion will inevitably claim that “this is the first study showing” that the new research provides “strong” evidence or “a clear answer”; the list of adjectives and amplifiers is large. Some of these strategies are actually taught to early career researchers. A retrospective analysis of positive and negative words in abstracts indexed in PubMed from 1974 to 2014 showed an increase of 880% in positive words used over the four decades (from 2% in 1974–1980 to 17.5% in 2014) (42).
2. So many kinds of misleading reports
Boutron & Ravaud (2018) explained that there are many ways to embellish the findings within the article. Misleading displays of figures, which includes scaling, lack of Confidence Intervals, a break in Y-axis, projecting curves, and other advanced alterations of images. Various practices to manipulate the p-values, including an interim analysis to decide whether an experiment or a study should be stopped prematurely, post hoc exclusion of outliers from the analysis, decision to combine or split groups, adjust covariates, perform subgroup analysis, or to choose the threshold for dichotomizing continuous outcomes.
Below is a sample of misleading reports among many that I came across, some of which I suspect to be completely deliberate.
Statistical sleight of hands
A common sleight of hand among economists is the emphasis on relative effect, overshadowing the absolute effect which provides a proper context to evaluate the real effect size. Here’s an example among many. Deming et al. (2016) conducted an experimental study by submitting fictitious resumes to real job openings, and wrote in their abstract that “a business bachelor’s degree from a for-profit online institution is 22% less likely to receive a callback than one from a nonselective public institution”. Reading their result section, this figure in reality is a relative effect, derived from the absolute effects of 9% and 7% callback rate. The difference is much less impressive than “advertised” in their abstract. The likely intent is to show that for-profit colleges perform much worse than public colleges and therefore should be regulated.
P-hacking
Stefan & Schönbrodt (2023) identified 12 p-hacking strategies used to achieve false positive results: selective reporting of the dependent variable, of the independent variable, optional stopping, outlier exclusion, controlling for covariates, scale redefinition, variable transformation, discretizing variables, exploiting alternative hypothesis tests, favourable imputation, subgroup analyses, incorrect rounding. They found that the p-hacking severity increases with the number of tests conducted as well as the dissimilarity between the datasets subjected to the tests, that the combination of p-hacking strategies increases the rate of false positive results, and that effect sizes are overestimated under the presence of p-hacking.
This relates to Bakker et al.’s (2012, Figures 3-4) finding that “the use of several small underpowered samples often represents a more efficient research strategy (in terms of finding p < .05) than does the use of one larger (more powerful) sample”. In their simulation, about half of the investigated psychological studies showed bias (calculated as the difference between the estimated ES and the true ES).
Selective reporting
Bagde et al. (2016) analyzed affirmative action (AA) programs based on a quota system in India. They wrote in the abstract that the “program increases college attendance of targeted students, particularly at relatively higher-quality institutions” but nothing about the outcomes. Yet their results clearly show that college quality had no impact on college graduation. This was not mentioned in their abstract, and not even in their conclusion. It is obvious these authors wanted to promote the idea that AA is beneficial by focusing on the attendance at high quality colleges. There are several similar cases of misreporting that I have covered in a previous article.
Questionable methodology
Borghans et al. (2016) analyzed 4 datasets with diverse measures of IQ and wrote in their abstract that “both grades and achievement tests are substantially better predictors of important life outcomes than IQ”. As I explained in detail before, they achieved this result because they used bad IQ measures and the achievement tests they used were actually much better measures of cognitive ability than their selected IQ measures, due to shady definition of what an IQ test should be.
Misapplied statistical criteria
van Soelen et al. (2011, Table 5) analyzed a longitudinal sample and concluded that the heritability of IQ increases from childhood to adulthood. Their report is overall accurate except for performance IQ, which has a heritability of 0.64 based on the reduced AE model. In the full ACE model, heritability was 0.46 and shared environment 0.17, but because the sample size was very small (224+46) it is no wonder why the C parameter was non-significant despite being clearly different from zero. Dropping this “non-significant” shared-environment component obviously increases the heritability, up to 0.64. But this is misleading.
Warne (2023, Table 4) compared the WISC-III scores of Kenyan Grade 8 students in Nairobi schools to the American norm and the WAIS-IV scores of Ghanaian students who showed English fluency at high school or university to the American norm. Measurement invariance (MI) was said to be tenable for both Ghanaian and Kenyan students. But Warne did not use the appropriate cutoffs suggested by simulation studies. If one applies the recommended cutoff ΔCFI≥.005, MI is rejected for the Kenyan sample.
3. Unintended consequences of publishing regulations

As always, when bad business practices and high pricing occur, the Pavlovian response is to blame the markets and call for regulations. For instance, Emil Kirkegaard (2024, Nov. 9) proposed the adoption of three measures to combat the supposed oligopoly and fix online publishing major issues:
- The research must be open access.
- A ceiling on publication fee.
- Materials (data, code, etc.) must be public.
Proposition 1. The common argument is that accessible research spreads knowledge across the world, ultimately helping researchers in low-income countries with poorly funded institutions. Yet enforcing open access will trigger some unintended consequences typically associated with public policies. Here, the high cost of open-access articles will be fully absorbed by the authors, library funds or research grants. This means that poorly funded universities (especially in low-income countries) and self-funded research (due to the topic being highly controversial) will face serious barriers to entry. There is some truth to it (Borrego, 2023; Frank et al., 2023). Some may even leave academia, as Nabyonga-Orem et al. (2020) observed: “African researchers are often left with no option but to pay out of pocket to cover APCs … Low salaries in African universities is a major reason why researchers leave academia for consultancy or migrate to high-income countries.” This problem is further exacerbated considering that government-funded research is much less sensitive to large fees, favoring institutions with large endowments even more. To make things worse, such a high cost necessarily discourages some types of submissions, such as single case reports, exploratory research, and commentaries.
There is a debate over which publishing model is preferable between the subscription and open-access (OA) approach, because it is argued that OA publishing involves Author Publication Charges (APC) and therefore is a potential threat to the integrity of the peer review. With the OA system, the journal revenues depend on the number of published articles which may ultimately result in predatory practices. When this happens, journals may be labeled as predatory, as was the case for MDPI or Frontiers, which may discourage authors from publishing there. Since poorly-funded researchers can’t bear the cost of APC, there should be a demand for both OA and subscription-based journals (see, Lakhotia, 2015). As explained in Section 4, OA mandates will promote predatory publishing. This is why regulations and moral hazard (created by subsidies) should be removed for the market to adopt the combination of features that produces the best outcome, including whether peer reviews should be eliminated or not (Heesen & Bright 2021; Elton, 2024, October 22). Competition is, after all, best described as a dynamic process under which entrepreneurs keep improving their product through novel methods and strategies. Armentano (1982), Folsom (1991), Yu (1998), and DiLorenzo (2005) provide compelling evidence that entrepreneurs typically thrive by adapting and innovating to accommodate the market’s needs in the absence of regulations or moral hazard driven policies.
A related topic is whether OA journals should also disclose the reviews and comments. Open peer review does not compromise the peer-review process (Chawla, 2019). Evidence indicates that open peer review may sometimes increase the time taken to review and increase the likelihood of reviewers declining to review (van Rooyen et al., 1999; 2010; Walsh et al., 2000).
Proposition 2 is particularly dangerous. Anyone with some basic knowledge on economics immediately understands. Mankiw (2024, pp. 112-116) illustrates why the necessary outcome of such price controls, especially price ceiling, is most likely supply shortage. The most egregious case is the rent control:
In many cities, the local government places a ceiling on rents that landlords may charge their tenants. This is rent control, a policy aimed at helping the poor by keeping housing costs low. Yet economists often criticize rent control, saying that it is a highly inefficient way to help the poor. One economist went so far as to call rent control “the best way to destroy a city, other than bombing.”
The adverse effects of rent control may not be apparent because these effects occur over many years. In the short run, landlords have a fixed number of apartments to rent, and they cannot adjust this number quickly as market conditions change. Moreover, the number of people looking for apartments may not be highly responsive to rents in the short run because people take time to adjust their housing arrangements. In other words, the short-run supply and demand for housing are both relatively inelastic.

Panel (a) of Figure 3 shows the short-run effects of rent control on the housing market. As with any binding price ceiling, rent control causes a shortage. But because supply and demand are inelastic in the short run, the initial shortage is small. The primary result in the short run is popular among tenants: a reduction in rents.
The long-run story is very different because the buyers and sellers of rental housing respond more to market conditions as time passes. On the supply side, landlords respond to low rents by not building new apartments and by failing to maintain existing ones. On the demand side, low rents encourage people to find their own apartments (rather than live with roommates or their parents) and to move into the city. Therefore, both supply and demand are more elastic in the long run.
Panel (b) of Figure 3 illustrates the housing market in the long run. When rent control depresses rents below the equilibrium level, the quantity of apartments supplied falls substantially, and the quantity of apartments demanded rises substantially. The result is a large shortage of housing.
In cities with rent control, landlords and building superintendents use various mechanisms to ration housing. Some keep long waiting lists. Others give preference to tenants without children. Still others discriminate based on race. Sometimes, apartments are allocated to those willing to offer under-the-table payments; these bribes bring the total price of an apartment closer to the equilibrium price.
Economic theory therefore predicts lower supply along with decreased quality control of the papers being submitted to the affected journals. There is some evidence that pricing is correlated with some key causal variables. Siler & Frenken (2020) explained that pricing differences across disciplines happen for several reasons: 1) due to the convention in medicine and natural sciences of hiring professional editors to oversee journals as opposed to social sciences and humanities 2) due to academic research involving collaboration via large-scale organizations being more prominent in medicine and the natural sciences than in social sciences and humanities. Rose-Wiles (2011) argued that differential pricing is driven by differential demand, due to science researchers being more likely to publish and cite articles compared to social science and humanities researchers and due to libraries of science and medicine companies being much better funded. Van Noorden (2013) observed that publishers attempted to justify their high running costs due to, e.g., evaluation, checks for plagiarism, peer reviews, editing, typesetting, graphics, formatting, hosting, yet he also noted that, in the open-access world, the higher-charging journals don’t command the greatest citation-based influence (i.e., impact factor). But this may depend on how the impact factor is measured. Indeed, Björk & Solomon (2015) found a correlation of 0.67 between APC and Source Normalized Impact per Paper when weighted by article volumes. There is no denying such a relationship and no denying that citation is highly desirable, yet citation based stats can be rightfully criticized on other grounds, as Serra-Garcia & Gneezy (2020) found that studies that don’t replicate are cited more than those that replicate, while Severin et al. (2023, Figures 4-5) found that the traditional impact factor does not reliably command better peer reviews, and finally Rose-Wiles (2011) noted that citations can be easily manipulated.
This obviously doesn’t address the underlying question: why do academic journals generate so much profit? An examination of the rise in college cost over time will help understand. As I concluded earlier, the rising cost is best explained by Bennett’s hypothesis which postulates that student aid (from the government) makes it possible for colleges to raise their prices. This allows the institutions to charge more because the students are able to bear the cost. Subsidies shift the demand curve upward. Journal pricing is affected by the same forces, just like in other areas. It is therefore not surprising that Hagve (2020) observed the following: “As in many other countries, most of the research funding in Norway comes from the government. Thereby, the government funds all stages of research production, but must then pay again to access the research results.” Fyfe et al. (2017, p. 9) observed that academic publishing has become highly profitable due to “the growth of academic research and the relatively generous funding available for the expanding university library sector: there was more research to be published, but also more institutions able to purchase it”. This gives rise to an inelastic demand and, by the same token, a reduction in competition. This explains why such a prestige effect prevails since the cost is absorbed by the taxes. Unsurprisingly, Morrison et al. (2021) found that authors choose to publish in more expensive journals while Khoo (2019, Table 1) found that higher APCs are not associated with a decrease in article volumes over time. This proves that authors are not sensitive to prices. Thus, subsidies indirectly reduce competition. Market failure theorists such as Edwards & Shulenburger (2003) who complained about unfair competition and inelastic demand obviously failed to understand this law of unintended consequences.
Perhaps the most important factor is the existence of copyright law which sustains the monopolistic power. Bergstrom & Bergstrom (2004) illustrate the irony as follows: “This market power is sustained by copyright law, which restricts competitors from selling “perfect substitutes” for existing journals by publishing exactly the same articles. In contrast, sellers of shoes or houses are not restrained from producing nearly identical copies of their competitors’ products.” A counter-argument is that innovation is not possible without copyright. But that assertion is false.
Proposition 3. Code sharing makes sense, and there are many reasons to share the code, especially the relevant portion that concerns the analysis (LeVeque, 2013). Data sharing is harder to justify for various reasons. Multiple studies found that data sharing does not reduce errors (Nuijten et al., 2017; Claesen et al., 2023) although one study confirmed the relationship (Wicherts et al., 2011). Papers with access to raw data are cited more often (Piwowar et al., 2007; Colavizza et al., 2020), yet researchers still have little incentives to share the data. Researchers have stated their reasons for not sharing data, which include priority of additional publishing, fear of being challenged after data re-analysis, financial interests and being bound by legal agreements not to reveal sensitive data (Tedersoo et al., 2021). The first point makes sense. The funding agencies expect the researchers to publish many papers, as an indicator of productivity. The second point is also understandable. It is likely that many scientists know this dirty secret: most research fails to replicate. Data sharing puts them at the mercy of future criticism. Yet they are not rewarded for sharing the data. This doesn’t mean scientists should not share data, but they currently lack such rewards.
4. The inherent “failure” of free markets
Predatory practice is best crystallized by Open-Access (OA) publishing, which focuses on quantity over quality due to their profits depending on the quantity of published papers. But upon examination, government and institutional funding often include mandates to publish frequently and in prestigious journals. Consistent with this idea, Shen & Björk (2015) argued that “The universities or funding agencies in a number of countries that strongly emphasize publishing in ‘international’ journals for evaluating researchers, but without monitoring the quality of the journals in question [16, 33], are partly responsible for the rise of this type of publishing.” Moreover, predatory publishing is not viable in the long term due to declining reputation. As Shen & Björk (2015) observed: “For instance, the DOAJ has, since 2014, imposed stricter criteria for inclusion and has filtered out journals that do not meet them [35]. Membership in the Open Access Scholarly Publishers Association (OASPA) is also contingent on meeting quality criteria.”
Competition has been skewed by government meddling. Dudley (2021) observed that OA mandates such as “Plan S” have met with resistance both from publishers and scholars. Larivière & Sugimoto (2018) reported that researchers would cite norms and needs within disciplines as a reason not to comply with OA mandates whereas Frank et al. (2023) reported that some researchers avoid the OA system due to unfairness with respect to low-income countries. Indeed, in a free market economy there would be some competition between OA and non-OA publishing depending on the varying needs and funds of the researchers. One would wonder whether the current situation of science publishing is truly an outcome inherent to free markets when the F1000 website makes the following statement:
A compliant OA publication meets the requirements set out in an OA policy introduced by a funder, institution, or government.
All F1000 publishing venues are fully open access and comply and support international open access mandates. As such, open access, immediate publication, and open data are all hallmarks of our own open access policies. Authors that don’t adhere to the requirements set out may fail our pre-publication checks, and their article may be rejected.
Although Dudley (2021) noted that OA articles are read and cited more often than non-OA, causing more authors and publishers/journals to opt for the OA option, this shift was made possible only because of OA mandates. Indeed, Dudley (2021) further noted that “Importantly, mandates for OA reform have led to an increase in the availability of funding for APCs which has further reinforced the prevalence of the pay to publish OA model.” As a result, poorly funded researchers have no choice but to select OA predatory journals that charge low fees but with little care to quality. By discouraging the subscription-based model, the OA mandate gave rise to predatory OA publishing.
This also explains why OA publishing is often criticized for generating profits that are overly disproportionate considering its costs. As noted before, government funded research reduces price sensitivity among researchers. The issue is amplified by OA requirements, due to generating more demand for OA journals and therefore pushing the price upward. Dudley (2021) reminds us that “since 2008, agencies of the U.S. government require research findings to be available on OA platforms”. Similarly, Butler et al. (2023) argued that the growth of OA publishing coincided with the increase in funder OA mandates and policies (e.g., “Plan S”). And recently, Larivière & Sugimoto (2018) observed that some national institutes such as the NIH and the Wellcome Trust both stated that they will withhold or suspend payments if articles are not made open access.
The attack on OA publishing often disregards the publish-or-perish culture that is “encouraged” (i.e., forced) by public agencies. This tendency allows predatory publishing to be much more prevalent because too many papers are submitted, more than reviewers can even handle. Due to lacking volunteers among potential reviewers, the journal eventually decides to skip the reviewing process. Another take is the supposed lack of regulation. For instance, Frank et al. (2023) observed that the phenomenon of predatory publishers is largely concentrated “in a few middle-income countries, often with lax regulatory environments for publishing of any kind” whereas “[A]cademics in the leading western countries are usually not lured by the Siren songs of the predatory journals, and most of the authors are from Africa and Asia, from countries where advancement requires ‘‘international’’ publication, with no quality checks”. Their observation mirrors the findings by Bohannon (2013) who reported that 80% of the OA journals that accepted his fake paper operated in India and Shen & Björk (2015, Figure 8) who reported that 35% of publications in predatory journals is by Indians. Their conclusion is that lack of regulation is the problem, not OA. Frank et al. either did not bother to do their research well or they failed to understand the adverse effects of current regulations. According to India’s University Grants Commission (UGC), for the 2018 clause, the minimum qualification for a professor includes “(iii) A minimum of 10 research publications in peer-reviewed or UGC-listed journals. (iv) A minimum of 110 Research Score as per Appendix II, Table 2” where the research score depends on the impact factor, while the requirement for various promotions includes “A minimum of seven publications in the peer-reviewed or UGC-listed journals out of which three research papers should have been published during the assessment period.” Relatedly, Raju (2013) & Lakhotia (2015) noted that the introduction of the Academic Performance Indicators (API) in 2010 caused an upsurge in the number of papers published in India, likely because UGC sees the number of publications as the major criterion for appointments and tenure promotions. Moreover, Seethapathy et al. (2016) observed that, in India, “90% and 73% of authors considered research publication as an achievement and has academic pressure respectively to publish research articles because publication gives job securities and promotions”. Once again, publications and high research scores are made mandatory, fueling the publish-or-perish culture.
So-called anti-competitive tactics are also pointed out. Major publishers often propose a “big deal” package of journals that are bundled across journals and across print and electronic versions. This typically involves a library entering into a long-term arrangement to get access to a large electronic library of journals at a substantial discount. According to Edlin & Rubinfeld (2005), bundling can be seen as a strategic barrier to entry (i.e., anti-competitive). This is because whenever an incumbent publisher misprices and loses a sale by pricing too high for a school to buy, an opportunity is created for new competitors. But bundling takes advantage of the law of large numbers to limit such pricing “inaccuracies” and with them the opportunities for entrants. Their discussion is worth quoting in full:
The situation is similar for libraries that come up for renewal of the Big Deal. A library subscribing to the complete Elsevier package can cancel all 1,800 Elsevier titles and buy a la carte. If the alternative publisher is only offering a single new journal, it is unlikely the library would cancel the Elsevier titles to get the new journal. Entry is certainly more difficult, but should the publishers’ behavior be deemed to be exclusionary, or should the publisher be seen as competing on the merits?
We believe that bundling is a good candidate to be judged exclusionary and anticompetitive. Excluding entrants by charging low prices is generally considered competition on the merits: it is favored from a public-policy vantage because customers gain from the low prices. On the other hand, because the total bundle price is so much higher than the sum of the marginal prices, Big Deal bundling excludes entrants without providing this kind of benefit to buyers. A complete answer to the question of whether Big Deal bundling is exclusionary rests in part on whether entry of new journals would be substantially easier if publishers did not bundle and only sold journals on an individual basis. The answer presumably depends in part on the decisions of librarians as to whether and to what extent they would allocate more funds toward new and alternative publications if they could achieve proportionate savings from cancelled subscriptions.
[…] These questions do not have easy answers, in part because the issues raise inherent conflicts between the static efficiency gains associated with bundling and the dynamic efficiency losses associated with a lack of additional entry.
Their reasoning is correct. As Rothbard (1962, ch. 10) explained, a monopoly status is harmless without monopoly pricing. Folsom (1991) provided an excellent illustration: Rockefeller once dominated the oil industry because of increased efficiency and lower prices, which greatly benefitted the consumers. In the case of journal pricing, it would seem that the price is too high. What they omit to say, though, is that government subsidies distort the demand curve by reducing the price sensitivity of the buyer. As a result, packages that include lower-quality journals alongside top-tier ones now appear more appealing. And copyright laws put the final nail in the coffin.
5. A thought on private funding
The attack on the free market is getting old. The main market failure theory is always a combination of the following reasons: asymmetric information, self-fulfilling prophecies, Gresham’s law, negative externalities, conflict of interest, free rider, huge fixed costs to entry, and many other reasons based on these same ideas. Another widespread idea is that some sectors of the economy are “exceptions” that do not comply with the rules of the market. This argument has been used to describe the historical market “failures” of water supply, education, banking system, credit rating agency, and so on. And this argument always failed.
We have similar arguments with respect to scholarly journals. Edwards & Shulenburger (2003) and Fyfe et al. (2017, p. 14) argued that academic publishing does not function as a free market because journals and books cannot be substituted by cheaper alternatives, which means that libraries and readers cannot choose between equivalent goods. Bergstrom et al. (2014) attribute the suboptimal big deal packages paid by libraries to asymmetric information. As explained above, these arguments fall flat when considering subsidies, OA mandates, and copyrights.
Because a free economy has hardly ever existed, it may be difficult to imagine how private agents achieve and manage the commons without government support. A thought experiment would help. Here’s what Bastiat (1850) concluded after observing the success of the private mutual-aid societies in France:
The natural danger that threatens such associations consists in the removal of the sense of responsibility. No individual can ever be relieved of responsibility for his own actions without incurring grave perils and difficulties for the future. [2] If the day should ever come when all our citizens say, “We shall assess ourselves in order to aid those who cannot work or cannot find work,” there would be reason to fear that man’s natural inclination toward idleness would assert itself, and that in short order the industrious would be made the dupes of the lazy. Mutual aid therefore implies mutual supervision, without which the benefit funds would soon be exhausted. This mutual supervision, which is for the association a guarantee of continued existence, and for each individual an assurance that he will not be victimized, is also the source of the moral influence it, as an institution, exercises. Thanks to it, drunkenness and debauchery are gradually disappearing, for by what right could a man claim help from the common fund when it could be proved that he had brought sickness and unemployment on himself through his own fault, by his own bad habits? This supervision restores the sense of responsibility that association, left to itself, would tend to relax.
[…] But, I ask, what will happen to the morality of the institution when its treasury is fed by taxes; when no one, except possibly some bureaucrat, finds it to his interest to defend the common fund; when every member, instead of making it his duty to prevent abuses, delights in encouraging them; when all mutual supervision has stopped, and malingering becomes merely a good trick played on the government? The government, to give it its just due, will be disposed to defend itself; but, no longer being able to count on private action, will have to resort to official action. It will appoint various agents, examiners, controllers, and inspectors. It will set up countless formalities as barriers between the workers’ claims and his relief payments. In a word, an admirable institution will, from its very inception, be turned into a branch of the police force.
References
- Alasbali, T., Smith, M., Geffen, N., Trope, G. E., Flanagan, J. G., Jin, Y., & Buys, Y. M. (2009). Discrepancy between results and abstract conclusions in industry-vs nonindustry-funded studies comparing topical prostaglandins. American Journal of Ophthalmology, 147(1), 33–38.
- Altwairgi, A. K., Booth, C. M., Hopman, W. M., & Baetz, T. D. (2012). Discordance between conclusions stated in the abstract and conclusions in the article: analysis of published randomized controlled trials of systemic therapy in lung cancer. Journal of clinical oncology, 30(28), 3552–3557.
- Baker, M. (2016). 1,500 scientists lift the lid on reproducibility. Nature 533, 452–454.
- Bakker, M., Van Dijk, A., & Wicherts, J. M. (2012). The rules of the game called psychological science. Perspectives on Psychological Science, 7(6), 543–554.
- Bergstrom, C. T., & Bergstrom, T. C. (2004). The costs and benefits of library site licenses to academic journals. Proceedings of the National Academy of Sciences, 101(3), 897–902.
- Bergstrom, T. C., Courant, P. N., McAfee, R. P., & Williams, M. A. (2014). Evaluating big deal journal bundles. Proceedings of the National Academy of Sciences, 111(26), 9425–9430.
- Björk, B. C., & Solomon, D. (2015). Article processing charges in OA journals: relationship between price and quality. Scientometrics, 103, 373–385.
- Bohannon, J. (2013). Who’s afraid of peer review? Science, 342, 60–5.
- Bornmann, L., Mutz, R., & Daniel, H. D. (2010). A reliability-generalization study of journal peer reviews: A multilevel meta-analysis of inter-rater reliability and its determinants. PloS One, 5(12), e14331.
- Borrego, Á. (2023). Article processing charges for open access journal publishing: A review. Learned Publishing, 36(3), 359–378.
- Boutron, I., Dutton, S., Ravaud, P., & Altman, D. G. (2010). Reporting and interpretation of randomized controlled trials with statistically nonsignificant results for primary outcomes. JAMA, 303(20), 2058–2064.
- Boutron, I., & Ravaud, P. (2018). Misrepresentation and distortion of research in biomedical literature. Proceedings of the National Academy of Sciences, 115(11), 2613–2619.
- Butler, L.-A., Matthias, L., Simard, M.-A., Mongeon, P., & Haustein, S. (2023). The oligopoly’s shift to open access: How the big five academic publishers profit from article processing charges. Quantitative Science Studies, 4(4), 778–799.
- Chan, A. W., Hróbjartsson, A., Haahr, M. T., Gøtzsche, P. C., & Altman, D. G. (2004a). Empirical evidence for selective reporting of outcomes in randomized trials: comparison of protocols to published articles. JAMA, 291(20), 2457–2465.
- Chan, A. W., Krleža-Jerić, K., Schmid, I., & Altman, D. G. (2004b). Outcome reporting bias in randomized trials funded by the Canadian Institutes of Health Research. CMAJ, 171(7), 735–740.
- Claesen, A., Vanpaemel, W., Maerten, A. S., Verliefde, T., Tuerlinckx, F., & Heyman, T. (2023). Data sharing upon request and statistical consistency errors in psychology: A replication of Wicherts, Bakker and Molenaar (2011). Plos One, 18(4), e0284243.
- Colavizza, G., Hrynaszkiewicz, I., Staden, I., Whitaker, K., & McGillivray, B. (2020). The citation advantage of linking publications to research data. PloS One, 15(4), e0230416.
- Dudley, R. G. (2021). The changing landscape of open access publishing: Can open access publishing make the scholarly world more equitable and productive?. Journal of Librarianship and Scholarly Communication, 9(1), eP2345.
- Duyx, B., Swaen, G. M., Urlings, M. J., Bouter, L. M., & Zeegers, M. P. (2019). The strong focus on positive results in abstracts may cause bias in systematic reviews: a case study on abstract reporting bias. Systematic Reviews, 8, 1–8.
- Dwan, K., Altman, D. G., Clarke, M., Gamble, C., Higgins, J. P., Sterne, J. A., Williamson, P. R., & Kirkham, J. J. (2014). Evidence for the selective reporting of analyses and discrepancies in clinical trials: a systematic review of cohort studies of clinical trials. PLoS Medicine, 11(6), e1001666.
- Edlin, A. S., & Rubinfeld, D. L. (2005). The bundling of academic journals. American Economic Review, 95(2), 441–446.
- Edwards, R., & Shulenburger, D. (2003). The high cost of scholarly journals:(and what to do about it). Change: The Magazine of Higher Learning, 35(6), 10–19.
- Estrada, C. A., Bloch, R. M., Antonacci, D., Basnight, L. L., Patel, S. R., Patel, S. C., & Wiese, W. (2000). Reporting and concordance of methodologic criteria between abstracts and articles in diagnostic test studies. Journal of General Internal Medicine, 15(3), 183–187.
- Fanelli, D. (2010). Do pressures to publish increase scientists’ bias? An empirical support from US States Data. PloS One, 5(4), e10271.
- Feng, Q., Mol, B. W., Ioannidis, J. P., & Li, W. (2024). Statistical significance and publication reporting bias in abstracts of reproductive medicine studies. Human Reproduction, 39(3), 548–558.
- Frank, J., Foster, R., & Pagliari, C. (2023). Open access publishing–noble intention, flawed reality. Social Science & Medicine, 317, 115592.
- Fyfe, A., Coate, K., Curry, S., Lawson, S., Moxham, N., & Røstvik, C. M. (2017). Untangling academic publishing: A history of the relationship between commercial interests, academic prestige and the circulation of research.
- Heesen, R., & Bright, L. K. (2021). Is peer review a good idea?. The British Journal for the Philosophy of Science.
- Jellison, S., Roberts, W., Bowers, A., Combs, T., Beaman, J., Wayant, C., & Vassar, M. (2020). Evaluation of spin in abstracts of papers in psychiatry and psychology journals. BMJ Evidence-Based Medicine, 25(5), 178–181.
- Jones, C., Rulon, Z., Arthur, W., Ottwell, R., Checketts, J., Detweiler, B., Calder, M., Adil, A., Hartwell, M., Wright, D. N., & Vassar, M. (2021). Evaluation of spin in the abstracts of systematic reviews and meta-analyses related to the treatment of proximal humeral fractures. Journal of Shoulder and Elbow Surgery, 30(9), 2197–2205.
- Kamel, S. A., & El-Sobky, T. A. (2023). Reporting quality of abstracts and inconsistencies with full text articles in pediatric orthopedic publications. Research Integrity and Peer Review, 8(1), 11.
- Khoo, S. Y. S. (2019). Article processing charge hyperinflation and price insensitivity: An open access sequel to the serials crisis. Liber Quarterly, 29(1), 1–18.
- Lakhotia, S. C. (2015). Predatory journals and academic pollution. Current Science, 108(8), 1407–1408.
- Larivière V., & Sugimoto, C. R. (2018). Do authors comply when funders enforce open access to research? Nature, 562, 483–486
- Lazarus, C., Haneef, R., Ravaud, P., & Boutron, I. (2015). Classification and prevalence of spin in abstracts of non-randomized studies evaluating an intervention. BMC Medical Research Methodology, 15(85), 1–8.
- LeVeque, R. J. (2013). Top ten reasons to not share your code (and why you should anyway). Siam News, 46(3), 15.
- Li, G., Abbade, L. P., Nwosu, I., Jin, Y., Leenus, A., Maaz, M., … & Thabane, L. (2017). A scoping review of comparisons between abstracts and full reports in primary biomedical research. BMC Medical Research Methodology, 17(181), 1–12.
- Mankiw, N. G. (2024). Principles of Economics. Cengage Learning.
- Mathieu, S., Giraudeau, B., Soubrier, M., & Ravaud, P. (2012). Misleading abstract conclusions in randomized controlled trials in rheumatology: comparison of the abstract conclusions and the results section. Joint Bone Spine, 79(3), 262–267.
- Mlinarić, A., Horvat, M., & Šupak Smolčić, V. (2017). Dealing with the positive publication bias: Why you should really publish your negative results. Biochemia Medica, 27(3), 447–452.
- Mullard, A. (2021). Half of top cancer studies fail high-profile reproducibility effort. Nature, 600, 368–369.
- Nabyonga-Orem, J., Asamani, J. A., Nyirenda, T., & Abimbola, S. (2020). Article processing charges are stalling the progress of African researchers: a call for urgent reforms. BMJ Global Health, 5(9), e003650.
- Nascimento, D. P., Gonzalez, G. Z., Araujo, A. C., Moseley, A. M., Maher, C. G., & Costa, L. O. P. (2020). Eight in every 10 abstracts of low back pain systematic reviews presented spin and inconsistencies with the full text: an analysis of 66 systematic reviews. Journal of Orthopaedic & Sports Physical Therapy, 50(1), 17–23.
- Nuijten, M. B., Borghuis, J., Veldkamp, C. L., Dominguez-Alvarez, L., Van Assen, M. A., & Wicherts, J. M. (2017). Journal data sharing policies and statistical reporting inconsistencies in psychology. Collabra: Psychology, 3(1), 31.
- Pitkin, R. M., Branagan, M. A., & Burmeister, L. F. (1999). Accuracy of data in abstracts of published research articles. JAMA, 281(12), 1110–1111.
- Piwowar, H. A., Day, R. S., & Fridsma, D. B. (2007). Sharing detailed research data is associated with increased citation rate. PloS One, 2(3), e308.
- Olson, C. M., Rennie, D., Cook, D., Dickersin, K., Flanagin, A., Hogan, J. W., Zhu, Q., Reiling, J., & Pace, B. (2002). Publication bias in editorial decision making. JAMA, 287(21), 2825–2828.
- Raju, N. V. (2013). How does UGC identify predatory journals?. Current Science, 104(11), 1461–1462.
- Rose-Wiles, L. M. (2011). The high cost of science journals: A case study and discussion. Journal of Electronic Resources Librarianship, 23(3), 219–241.
- Scherer, R. W., Meerpohl, J. J., Pfeifer, N., Schmucker, C., Schwarzer, G., & von Elm, E. (2018). Full publication of results initially presented in abstracts. Cochrane Database of Systematic Reviews, 11:R000005.
- Seethapathy, G. S., Kumar, J. U. S., & Hareesha, A. S. (2016). India’s scientific publication in predatory journals: need for regulating quality of Indian science and education. Current Science, 111(11), 1759–1764.
- Severin, A., Strinzel, M., Egger, M., Barros, T., Sokolov, A., Mouatt, J. V., & Müller, S. (2023). Relationship between journal impact factor and the thoroughness and helpfulness of peer reviews. PLoS Biology, 21(8), e3002238.
- Shen, C., & Björk, B. C. (2015). ‘Predatory’ open access: a longitudinal study of article volumes and market characteristics. BMC Medicine, 13, 230.
- Serra-Garcia, M., & Gneezy, U. (2021). Nonreplicable publications are cited more than replicable ones. Science Advances, 7(21), eabd1705.
- Siler, K., & Frenken, K. (2020). The pricing of open access journals: Diverse niches and sources of value in academic publishing. Quantitative Science Studies, 1(1), 28–59.
- Stefan, A. M., & Schönbrodt, F. D. (2023). Big little lies: A compendium and simulation of p-hacking strategies. Royal Society Open Science, 10(2), 220346.
- Tedersoo, L., Küngas, R., Oras, E., Köster, K., Eenmaa, H., Leijen, Ä., Pedaste, M., Raju, M., Astapova, A., Lukner, H., Kogermann, K., & Sepp, T. (2021). Data sharing practices and data availability upon request differ across scientific disciplines. Scientific Data, 8, 192.
- Van Noorden, R. (2013). The true cost of science publishing. Nature, 495, 426-429.
- Van Rooyen, S., Godlee, F., Evans, S., Black, N., & Smith, R. (1999). Effect of open peer review on quality of reviews and on reviewers’ recommendations: a randomised trial. BMJ, 318(7175), 23-27.
- Van Rooyen, S., Delamothe, T., & Evans, S. J. (2010). Effect on peer review of telling reviewers that their signed reviews might be posted on the web: randomised controlled trial. BMJ, 341, c5729.
- Walsh, E., Rooney, M., Appleby, L., & Wilkinson, G. (2000). Open peer review: a randomised controlled trial. The British Journal of Psychiatry, 176(1), 47–51.
- Wicherts, J. M., Bakker, M., & Molenaar, D. (2011). Willingness to share research data is related to the strength of the evidence and the quality of reporting of statistical results. PloS One, 6(11), e26828.