


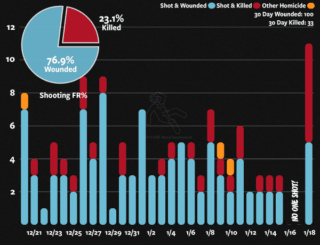
January To Date
Shot & Killed: 19
Shot & Wounded: 55
Total Shot: 74
Total Homicides: 21
| CARVIEW |
Select Language
HTTP/2 200
server: nginx
date: Tue, 20 Jan 2026 05:19:54 GMT
content-type: text/html; charset=UTF-8
vary: Accept-Encoding
link: Chicago Crime, Murder & Mayhem | Criminal Infographics | HeyJackass! | Illustrating Chicago Values


All years counted through date shown at the bottom of the table. Fatality rate (FR%) is total people fatally shot / total people shot.


2009-2012 stats account for on duty CPD incidents only. 2013-2025 may include other police forces within Chicago, such as the Illinois State Police, Cook County Sheriff, various 3 lettered state/federal agencies, suburban departments or university police forces. On-duty as well as off-duty incidents are included. Historical data pulled from the Civilian Office of Police Accountability.
Stats do NOT include on/off-duty police or other law enforcement and are not limited to firearm related incidents; fatal stabbings are also included. Previous years’ stats reflect totals for entire year.

Note: The Chicago Police Department defines a mass shooting as three or more shooting victims (non-fatal and fatal) per incident. This definition is based on the Investigative Assistance for Violent Crimes Act of 2012, signed into law in January 2013.
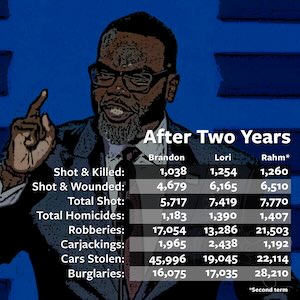
Note: Lightfoot’s tally is 12p, May 20, 2019 – 11:59a, May 15, 2023. Brandon Johnson’s tally started at 12p, May 15, 2023.


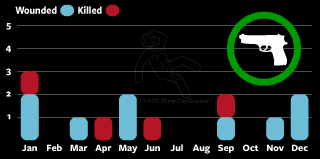
Week in Progress (1/18 – 1/24)
Shot & Killed: 6
Shot & Wounded: 5
Total Shot: 11
Total Homicides: 6
Final 2025 Totals (vs 2024)
Shot & Killed: 362 (-32%)
Shot & Wounded: 1592 (-35%)
Total Shot: 1954 (-34%)
Total Homicides: 433 (-29%)
Year In Review
 We speculated at the end of 2024 that “maybe the less cops, less tools, more rules has been the winning formula missing for all these years”. Possibly that along with a State’s Attorney that actually enforces the law has pulled off a decade low in hi-speed lead-related incidents despite the Kakistocratic leadership that runs the city and state.
2025: 433 killed, 1,592 wounded
2024: 613 killed, 2,444 wounded
2023: 650 killed, 2,500 wounded
2022: 740 killed, 2,936 wounded
2021: 856 killed, 3,745 wounded
2020: 800 killed, 3,472 wounded
2019: 521 killed, 2,291 wounded
2018: 592 killed, 2,465 wounded
2017: 685 killed, 2,935 wounded
2016: 808 killed, 3,658 wounded
2015: 513 killed, 2,546 wounded
2014: 465 killed, 2,239 wounded
Avg: 658 killed, 2,839 wounded
A breakdown of the year’s non-demonizable, silly decisions because they’ve been starved of opportunities in their own communities where law enforcement is a sickness that needs to be eradicated shows:
- 362 shot & killed
- 30 stabbed
- 20 beaten
- 21 killed via other means
- 18.5% shooting fatality rate
- 22 shot by police, 8 fatally
- 13 self defense, 4 fatally
- 89 homicide-linked arrests
- Averaged 5.4 people shot per day
- 26 mass shootings – 136 shot, 8 fatally
- 358/365 days recorded a shooting
- 123 days were homicide-free
- 376 in serious or critical condition
- 366 (89%) males killed vs 67 females
- 327 (75.5%) Blacks, 85 Hispanics, 21 other
- Average age of a homicide victim – 32
- Average age of a shooting victim – 31
- 21 children 12 and younger shot, 1 fatally
- Homicide age range: 0-80
- Team Austin won w/ 172 total shot
- 11th District led w/ 240 people shots/li>
- 6th District led w/ 47 homicides
- 8 expressway shootings, 0 fatal
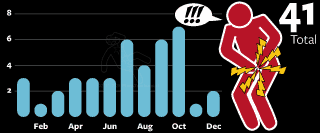
- 88 grazed
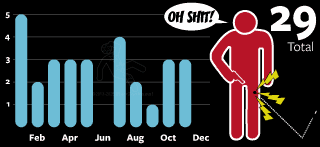
- 29 selfies
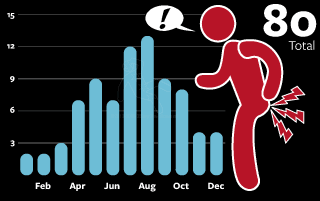
- 80 Shot-In-The-Ass
We mistakenly believed we had bottomed out in 2024, only to watch the downward trend persist through 2025. In hindsight, we underestimated the significance of replacing a pro-criminal State’s Attorney with one who simply enforces the law as written (despite pro-criminal judges still being a persistent issue).
It’s no secret that most of what’s on this site is driven by a small number of low-IQ ne’er-do-wells who’ve done well by becoming their own protected victim class from 2016-2024. Removing even a portion of them from the streets creates a noticeable ripple effect on overall numbers. Despite that, enough of these retards remain active to the point where we believe we’ll be hanging around the 430-480 homicides, 1800-2200 total people shot levels for some time to come.
There is also the ever-present possibility of a lifelong, drug-addled wife-beater getting taken out by a cop somewhere and the media will try and whip up some ist-a-phobe-related violence (see 2014, 2016 & 2020). In fact, we’re past due for such an event.
As always, many thanks to everyone who visited, liked, retweeted, emailed, hit the tip jar and/or picked up some tees or other crap this past year. If you haven’t done so yet, maybe add it to the very bottom of your list of New Year’s resolutions. Have yourself a safe and prosperous new year.
View all Enlightening Commentary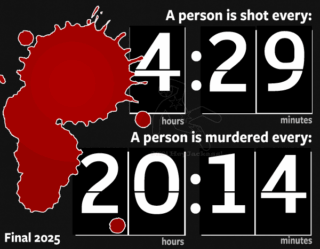
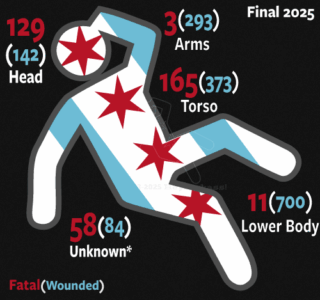
2025 Shot Placement
| Placement | Killed | Wounded |
|---|---|---|
| head | 101 | 70 |
| chest | 88 | 92 |
| back | 26 | 112 |
| abdomen | 17 | 96 |
| face | 14 | 45 |
| neck | 14 | 26 |
| side | 6 | 38 |
| other/unknown | 96 | 1,113 |
| As of 1/1/26 |
2025 Homicide Map
| N'hood | Homicides | Wounded |
|---|---|---|
| Austin | 46 | 135 |
| Garfield Park | 24 | 131 |
| Englewood | 21 | 121 |
| North Lawndale | 22 | 85 |
| South Shore | 24 | 83 |
| Grand Crossing | 22 | 61 |
| Auburn Gresham | 20 | 58 |
| Humboldt Park | 19 | 59 |
| Chatham | 14 | 54 |
| Near West Side | 19 | 49 |
| Roseland | 16 | 48 |
| Little Village | 14 | 38 |
| South Chicago | 9 | 42 |
| Near North Side | 13 | 35 |
| New City | 6 | 38 |
| All Others | 144 | 555 |
| As of 1/1/26 |
2025 Homicide Trend
| Year | Homicides | Wounded |
|---|---|---|
| 2024 | 613 | 2,444 |
| 2023 | 650 | 2,500 |
| 2022 | 740 | 2,936 |
| 2021 | 856 | 3,745 |
| 2020 | 800 | 3,472 |
| 2019 | 521 | 2,291 |
| 2018 | 592 | 2,465 |
| 2017 | 685 | 2,935 |
| 2016 | 808 | 3,658 |
| 2015 | 513 | 2,546 |
Previous year data is reflective of year end totals.
2025 Total Shot Trend
| Year | Killed | Wounded | Total | FR% |
|---|---|---|---|---|
| 2025 | 362 | 1,592 | 1,954 | 18.5% |
| 2024 | 536 | 2,443 | 2,979 | 18.0% |
| 2023 | 577 | 2,500 | 3,077 | 18.8% |
| 2022 | 667 | 2,936 | 3,603 | 18.5% |
| 2021 | 798 | 3,745 | 4,543 | 17.6% |
| 2020 | 726 | 3,472 | 4,198 | 17.3% |
| 2019 | 464 | 2,291 | 2,755 | 16.8% |
| As of 1/1/26 | ||||

Brandon’s Bodies
| Date | Killed | Wounded | FR% |
|---|---|---|---|
| 9/23/24 - 1/12/26 | 36 | 35 | 50.7% |
In conjunction with CWB Chicago’s “Brandon’s Bodies” series, the above illustrates Mayor Brandon Johnson’s decision to terminate the City’s relationship with ShotSpotter. Fatality rate (FR%) is total people fatally shot / total people shot.
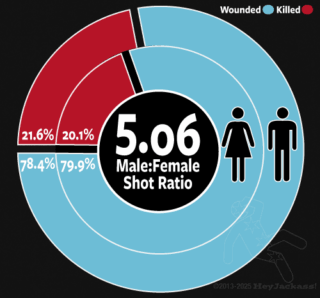
2025 Gender of Victim
| Gender | Killed | Wounded |
|---|---|---|
| Male | 366 | 1,325 |
| Female | 67 | 267 |
| As of 1/1/26 |
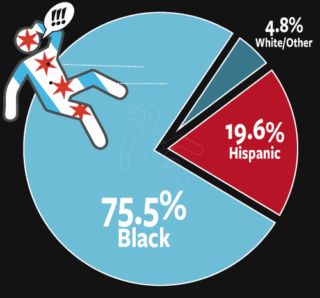
2025 Race of Victim/Assailant
| Race | Victim | Assailant |
|---|---|---|
| Black | 327 | 63 |
| Hispanic | 85 | 17 |
| White/Other | 21 | 3 |
| As of 1/1/26 |
2025 Cause of Death
| Cause | Homicides | % |
|---|---|---|
| Gunshot | 362 | 83.6% |
| Stabbing | 30 | 6.9% |
| Trauma | 20 | 4.6% |
| Arson | 4 | 0.9% |
| Child Abuse | 4 | 0.9% |
| Drowning | 4 | 0.9% |
| Asphyxia | 2 | 0.5% |
| Auto | 2 | 0.5% |
| Toxicity | 2 | 0.5% |
| Unknown | 2 | 0.2% |
| Maternal Death | 1 | 0.1% |
| As of 1/1/26 |
4 Months of Premium for $0
 Spotify Fun fact: we racked up an impressive 64,000 minutes of listening time in 2025 — putting our account among the absolute heavy-hitters worldwide for total minutes streamed this year. It’s pumping for at least 8-10 hours a day, everyday. If you’d like to try and top our ranking, join and get 4 months of Premium for $0.00! We in turn get a little something to offset our music listening habit. Thank you!
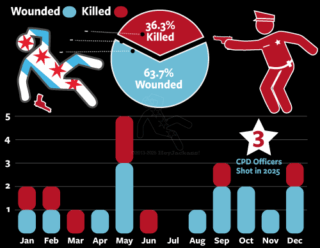
2025 Police-involved Shootings
| Year | Killed | Wounded |
|---|---|---|
| 2025 | 8 | 14 |
| Previous Year Totals | ||
| 2024 | 3 | 6 |
| 2023 | 5 | 5 |
| 2022 | 2 | 21 |
| 2021 | 9 | 13 |
| 2020 | 7 | 13 |
| 2019 | 6 | 6 |
| 2018 | 6 | 15 |
| 2017 | 11 | 12 |
| 2016 | 11 | 14 |
| 2015 | 9 | 16 |
| 2014 | 17 | 28 |
| 2013 | 13 | 30 |
| 2012 | 8 | 49 |
| 2011 | 23 | 37 |
| 2010 | 13 | 33 |
| 2009 | 19 | 42 |
| CPD Shot | 1 | 2 |
2009-2012 stats account for on duty CPD incidents only. 2013-2025 may include other police forces within Chicago, such as the Illinois State Police, Cook County Sheriff, various 3 lettered state/federal agencies, suburban departments or university police forces. On-duty as well as off-duty incidents are included. Historical data pulled from the Civilian Office of Police Accountability.
2025 Self Defense
| Year | Killed | Wounded |
|---|---|---|
| 2025 | 4 | 9 |
| Previous Year Totals | ||
| 2024 | 8 | 19 |
| 2023 | 8 | 15 |
| 2022 | 9 | 16 |
| 2021 | 5 | 7 |
| 2020 | 11 | 9 |
| 2019 | 6 | 9 |
| 2018 | 4 | 14 |
| 2017 | 13 | 8 |
| 2016 | 12 | 10 |
| 2015 | 5 | 3 |
| As of 1/1/26 | ||
Substack, IG, X & Others
 We’ve set up a Substack channel where we occasionally post longer form content that doesn’t necessarily work on the site. Subscribe if you like, or not. We spend most of our social media capital on Twitter/X. We sometimes post on Instagram which does little to help our official influencer status, but only if influencer means having no influence. We’ve also set up a TikTok account but rarely use it. Finally we have a toehold on a number of smaller, alternative social media platforms to be used primarily as “just-in-case” backups: Odysee, Rumble, Minds and GETTR.
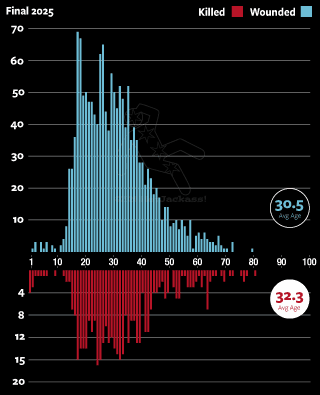
2025 Age of Victim
| Cohort | Killed | Wounded |
|---|---|---|
| Kids (0-12) | 14 | 20 |
| Teens (13-17) | 35 | 165 |
| Young Adults (18-35) | 233 | 894 |
| Middle Aged (36-54) | 113 | 372 |
| AARP (55+) | 38 | 70 |
| Unknown | - | 71 |
| As of 1/1/26 |
2025 Mass Shootings
| Victims | Incidents | Killed |
|---|---|---|
| 18 shot | 1 | 4 |
| 7 shot | 4 | - |
| 6 shot | 1 | 1 |
| 5 shot | 4 | - |
| 4 shot | 16 | 3 |
| Hat Trick | 43 | 25 |
| 2 shot | 165 | 67 |
| As of 1/1/26 |
Gallery
 Aside from the occasional live stream and videos some platforms find acceptable, most of our video content can now be found on Odysee. Warning: some of the images found within the Gallery may be graphic. View full Gallery
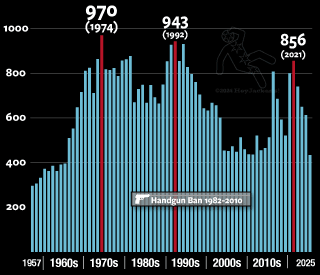
Homicide Trend (1957-2024)
| Mayor | Term | Homicides |
|---|---|---|
| Richard J. Daley | 1955-1976 | 10,910 |
| Michael Bilandic | 1976-1979 | 2,408 |
| Jane Byrne | 1979-1983 | 3,202 |
| Harold Washington | 1983-1987 | 3,295 |
| Eugene Sawyer | 1987-1989 | 978 |
| Richard M. Daley | 1989-2011 | 14,653 |
| Rahm Emanuel | 2011-2019 | 4,535 |
| Lori Lightfoot | 2019-2023 | 2,958 |
| Brandon Johnson | 2023-Dec25 | 1,473 |
Police Scanner Frequencies
As more and more CPD frequencies move towards encryption, scanners are becoming useless. Check out CrimeIsDown’s Live Audio Feeds to listen to any zone that hasn’t been encrypted (yet) or use the official feeds with a 30+ minute delay on Broadcastify.
Chicago Reads
Sites we like.
Support, Tips & Donations
As a small percentage of jagoffs ventilate one another with reckless abandon, we diligently record, document and illustrate every misconception, downward trending, mostly peaceful event. Your support in any amount is greatly appreciated.
If you’d like to support others in the Chicago Scanner community, we ask that you please support those who provide everyone with up to the minute news and information including – Spot News, Chicago Scanner, CrimeIsDown.com & Solutions & Resources Street Pastors
Hosting: Tired of shitty hosting services? We moved over to Liquid Web years ago and have had nothing but a positive experience. It’s never too late to start that cat blog you’ve been dreaming about. This referral link helps pay for our hosting fees and in turn you get a quality host.
Email: You get what you pay for and that includes email. Proton Mail is a quality email platform with an ad-free privacy bent. This referral link helps pay for our email fees and in turn you’ll get a free month of service.
Ad Blockers: We do make a few pennies from ad revenue, so if you wouldn’t mind whitelisting us if you run an ad blocker that would be super.
Brave Users: click on the BAT triangle in the address bar to either send a tip or make a monthly standing contribution. If you’re not using the Brave browser, you should be.
*Source Data & Editor’s Note
We compile our own dataset using the following sources: Chicago Tribune, Chicago Sun-Times, Homicide Watch Chicago (no longer updated), DNAInfo Chicago (out of business), Chicago Redeye Homicide Tracker (long gone), NBC5 Chicago, Chicago Tribune’s Shooting Tracker (no longer updated) & Homicide Tracker (declared dead), Sun-Times Homicide Tracker, Cook County Medical Examiner, CPD’s Historical Data Set, City of Chicago Data Portal, Chicago Police Department Arrest Record Search, CPD CLEARMAP, Various CPD Dashboards, ISP Expressway Shooting Dashboard, CPD’s Media Major Incident Notifications and the needlessly woke Chicago Violence Reduction Dashboard.
Community areas and neighborhoods are determined by Crimeisdown.com’s most excellent Incident Map or the Chicago Tribune’s Boundaries App.
Editor’s note: All murders are homicides, but not all homicides are murders. We count homicides, whereas the CPD counts murders. A homicide, or a non-fatal shooting, regardless of type or by whom, within the city limits of Chicago counts towards our total metric, including anything on the expressways. CPD-involved, ISP-involved and justifiable homicides all count. Reckless homicides may count if the Medical Examiner rules that the cause of death was a homicide. Suicides do not count. Additional definitions can be found on the Glossary page.
All statistics, metrics, charts, graphs and other visualizations are preliminary based on the data available at the time. All incidents are subject to further analysis or change.
Copyright © 2026 HeyJackass All Rights Reserved
Powered by Sarcasm, Stats & Booze