You signed in with another tab or window. Reload to refresh your session.You signed out in another tab or window. Reload to refresh your session.You switched accounts on another tab or window. Reload to refresh your session.Dismiss alert
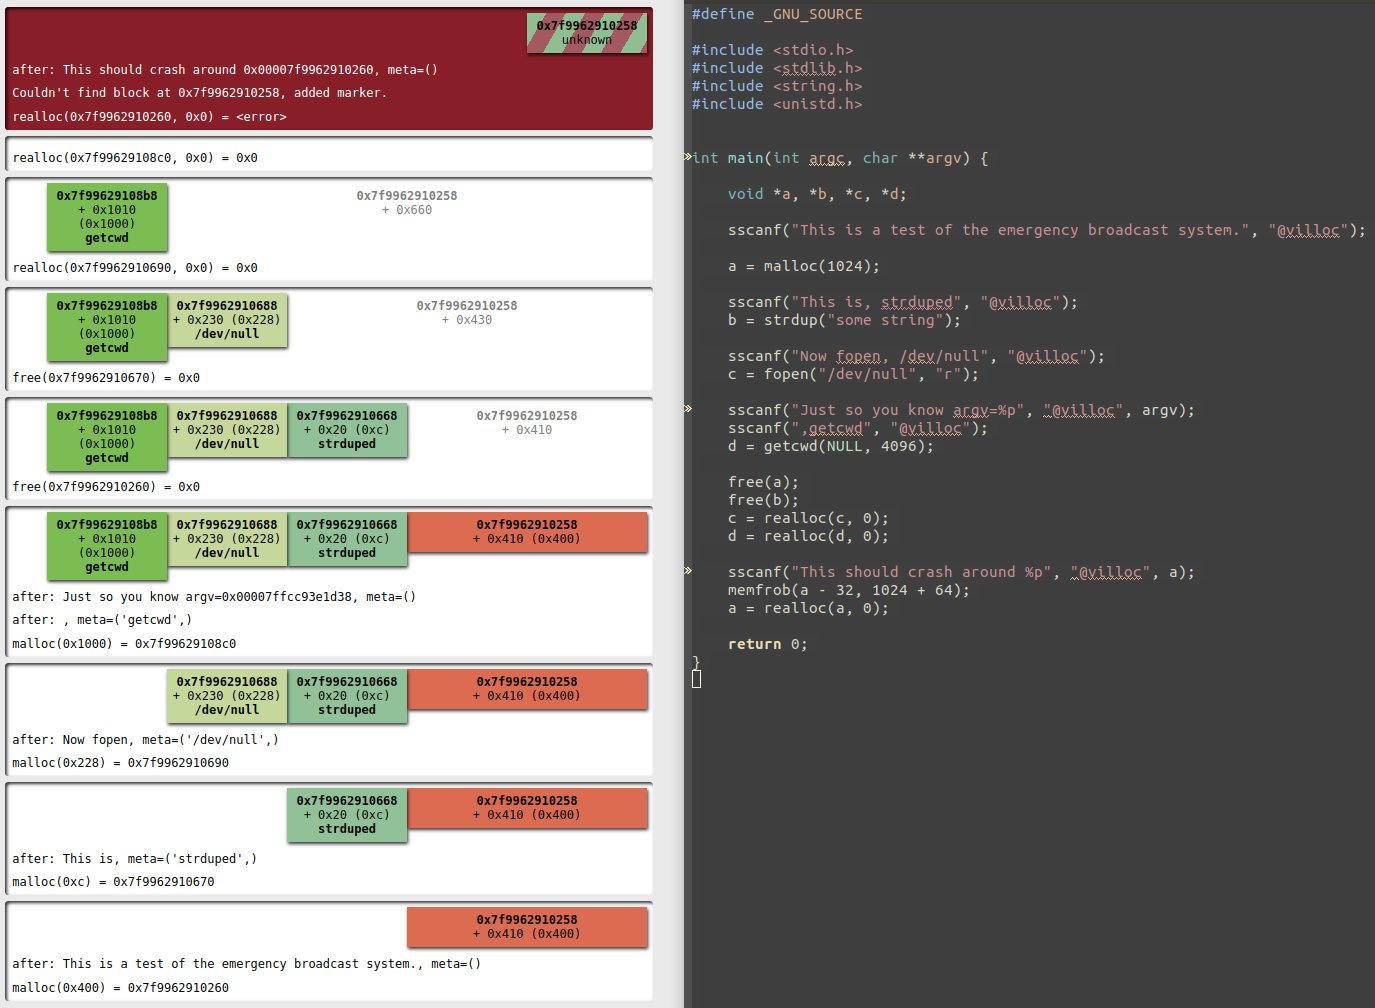
Villoc is a heap visualisation tool, it's a python script that renders a static
html file. An example can be seen here: https://wapiflapi.github.io/villoc/, this
is villoc running on an exploit of PlaidCTF 2015's challenge PlaidDB.
How to
The easiest way to use villoc is probably to run the following command and open
out.html in a browser.
ltrace ./target |& villoc.py - out.html;
It is probably a good idea to disable ASLR for repeatable results and to use a
file to pass the ltrace to villoc because otherwise the target's error output
will be interleaved and might confuse villoc sometimes.
Villoc's input should look like ltrace's output, other tracers should output
compatible logs. Villoc also listens to annotations of the following form:
@villoc(comma separated annotations) = <void>`
When using this it's possible to mark certain block as being significant which
makes analyzing villoc's output that much easier.
Annotations from C code through DynamoRIO.
When using the dynamorio tracer there is a hack to easily inject annotations
from a target's source code:
Will inject Format string 1 2 into villoc's log and add the FOO
and BAR tags to the block affected by the next memory operation.
Which malloc
This has been made with glibc's dl_malloc in mind. But it should work for other
implementations, especially if you play with the --header and --footer
options to indicate how much overhead the targeted malloc adds to the user data.