You signed in with another tab or window. Reload to refresh your session.You signed out in another tab or window. Reload to refresh your session.You switched accounts on another tab or window. Reload to refresh your session.Dismiss alert
html file with interactive specificity graph for CSS
necessary JS files to run graph
Options
Flag
Description
-o --output
name for generated directory (default: specificity-graph)
-b --browser
auto launch browser to view generated chart
-h --help
Help
Node module
var specificityGraph = require('specificity-graph');
specificityGraph(directory, css, function(directory){
  console.log('specificity-graph files created in ' + directory);
});
Via JavaScript
First get the specificityGraph accessible in your code:
Using Browserify (or similar)
Just require('specificity-graph').
Standalone (no module loader)
Add <script src="specificity-graph-standalone.js"></script>,
this will expose specificityGraph as a global variable.
JSON object with css specificity data. CLI write a JSON in this format, as does the lib/lineChart's create function'
Create options
Create option name
Description
svgSelector
Selector for svg element to draw specificity graph inside. Defaults to .js-graph.
width
default 1000. You should set a viewBox value on the SVG element to match width and height, f.e. viewbox='0 0 1000 4000'.
height
default 400
showTicks
Boolean. Show scale and ticks. Default false.
xProp
(possible values: 'selectorIndex', 'line'). What to base the x dimension, 'location in stylesheet' in graph on: index of selector in CSS, or line number for selector in CSS. Default 'selectorIndex'.
yProp
default 'specificity'
About
Generate interactive Specificity Graphs for your CSS

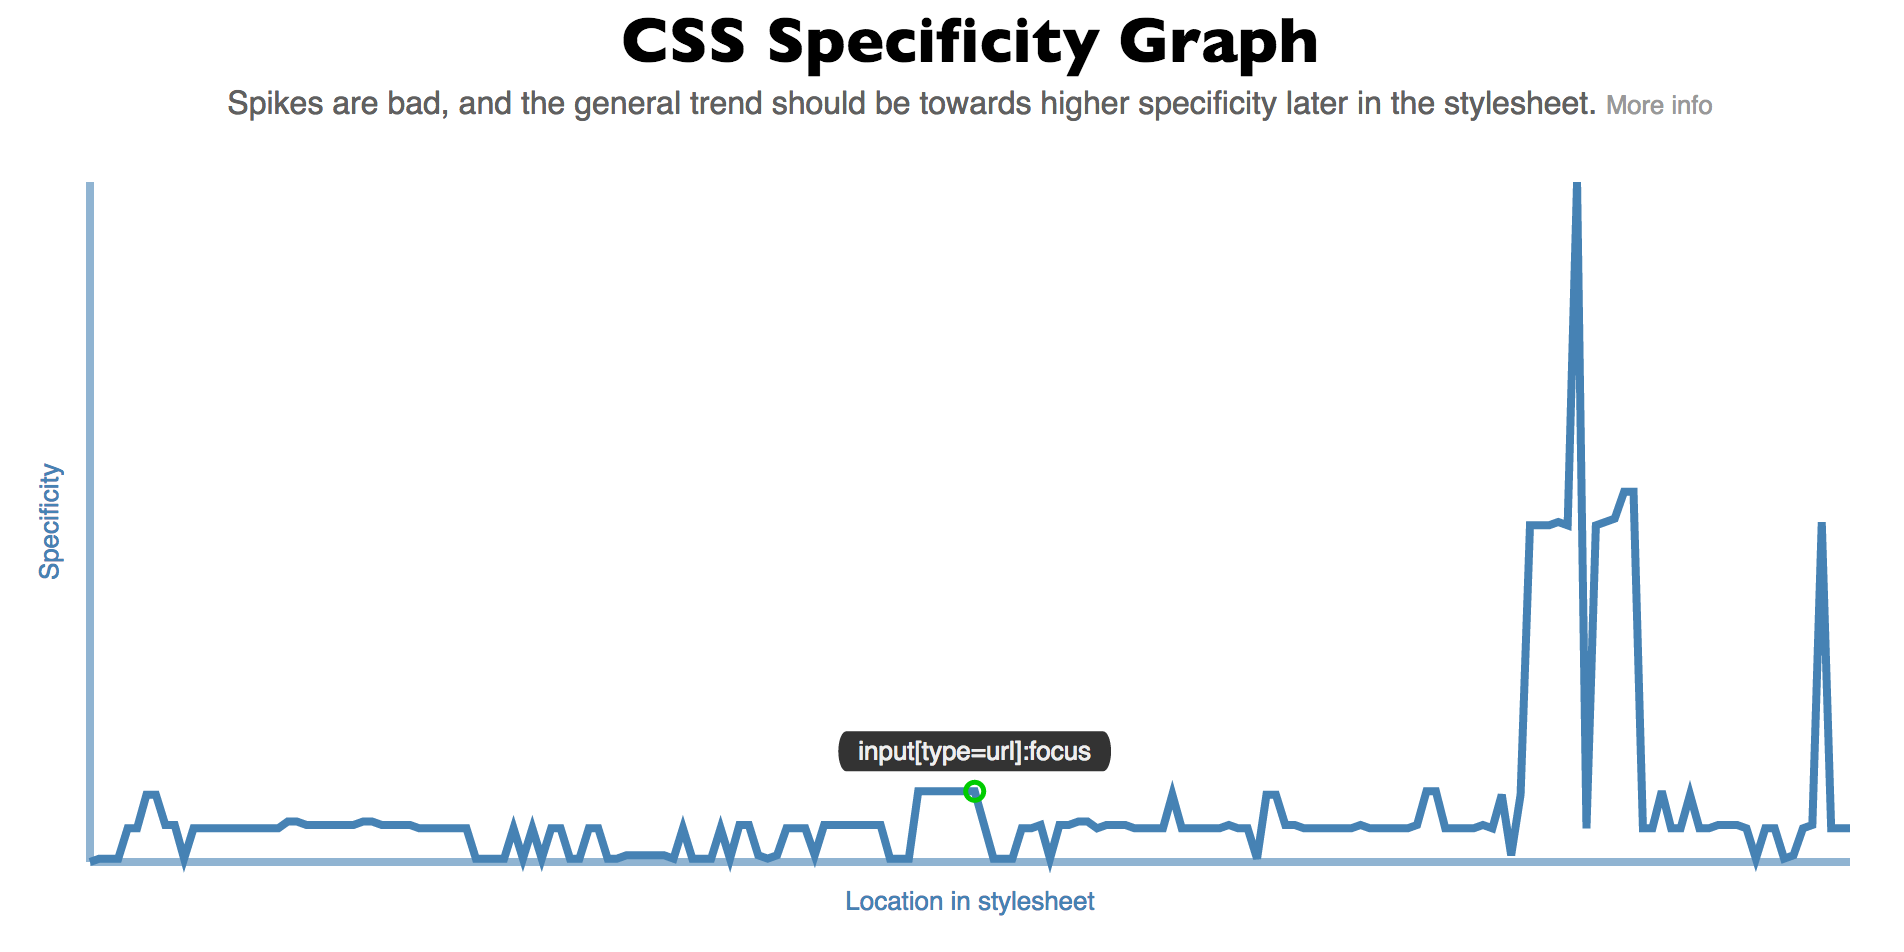 Generate an interactive line graph showing the specificity in your stylesheet. Uses d3, css-parser, and specificity.