You signed in with another tab or window. Reload to refresh your session.You signed out in another tab or window. Reload to refresh your session.You switched accounts on another tab or window. Reload to refresh your session.Dismiss alert
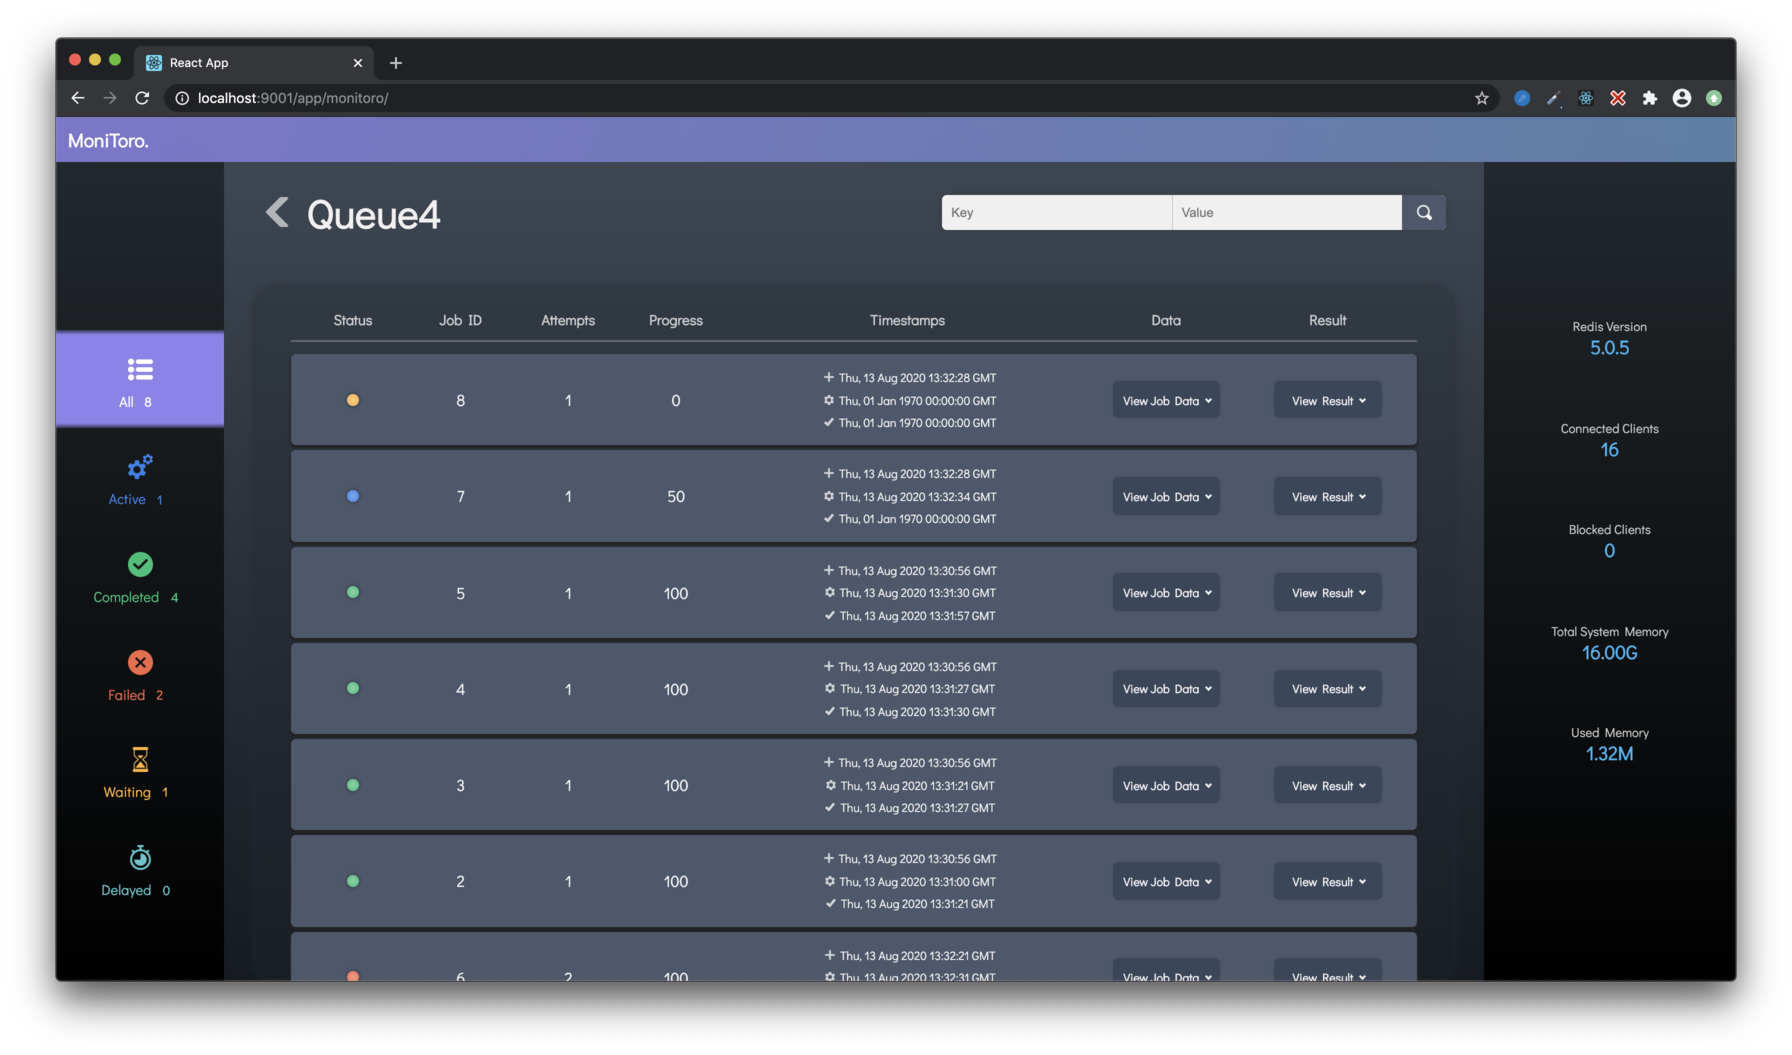
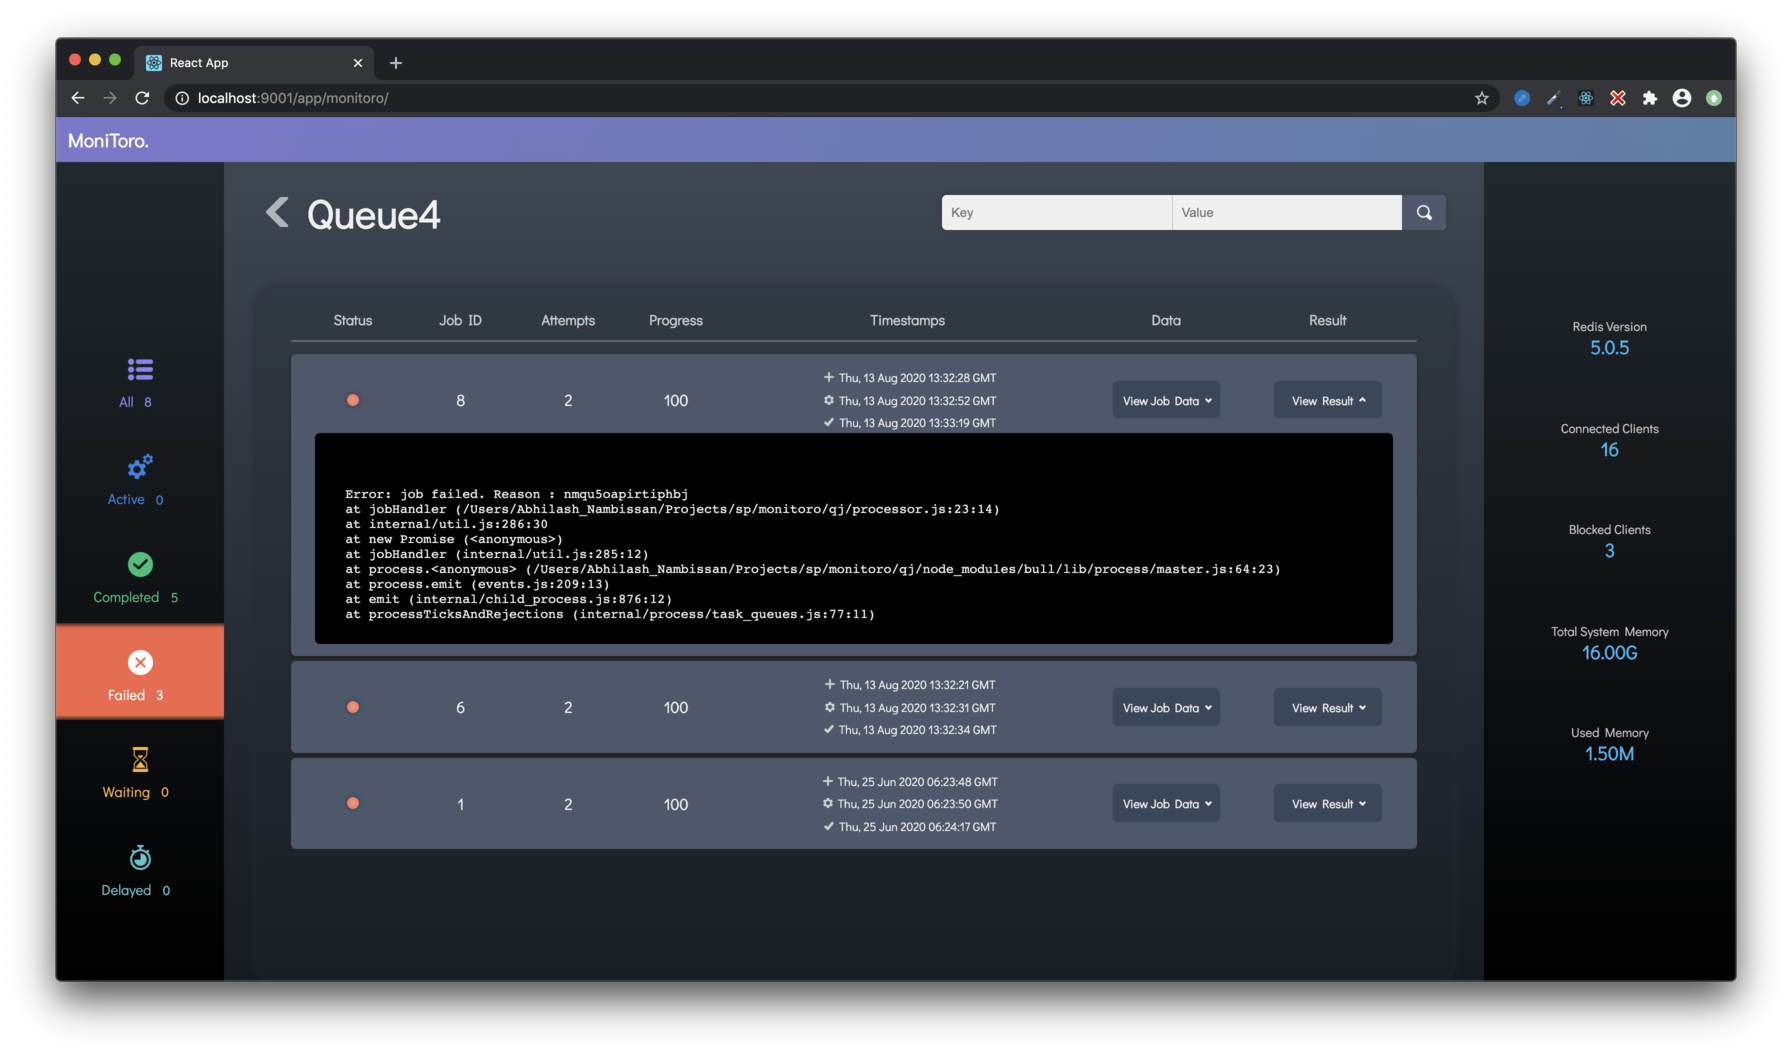
Filter jobs based on state: active, completed, failed, waiting, delayed
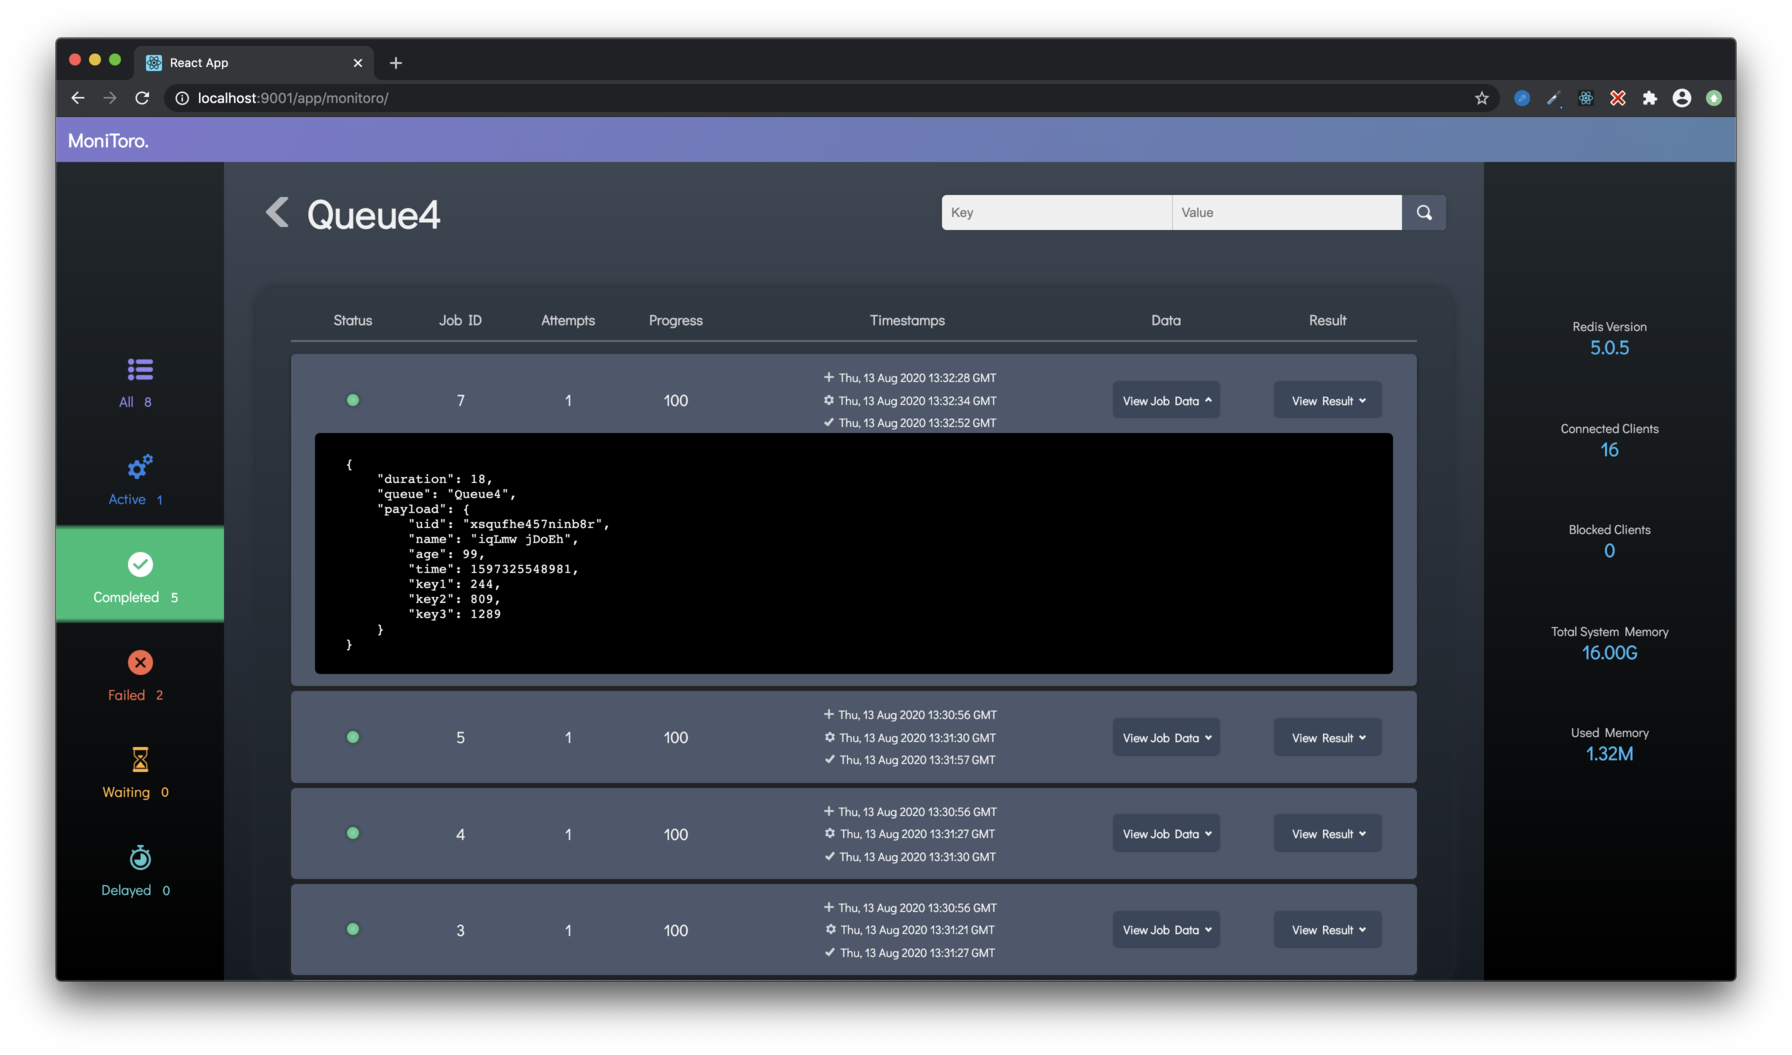
Key-Value based search on job data for finding specific jobs.
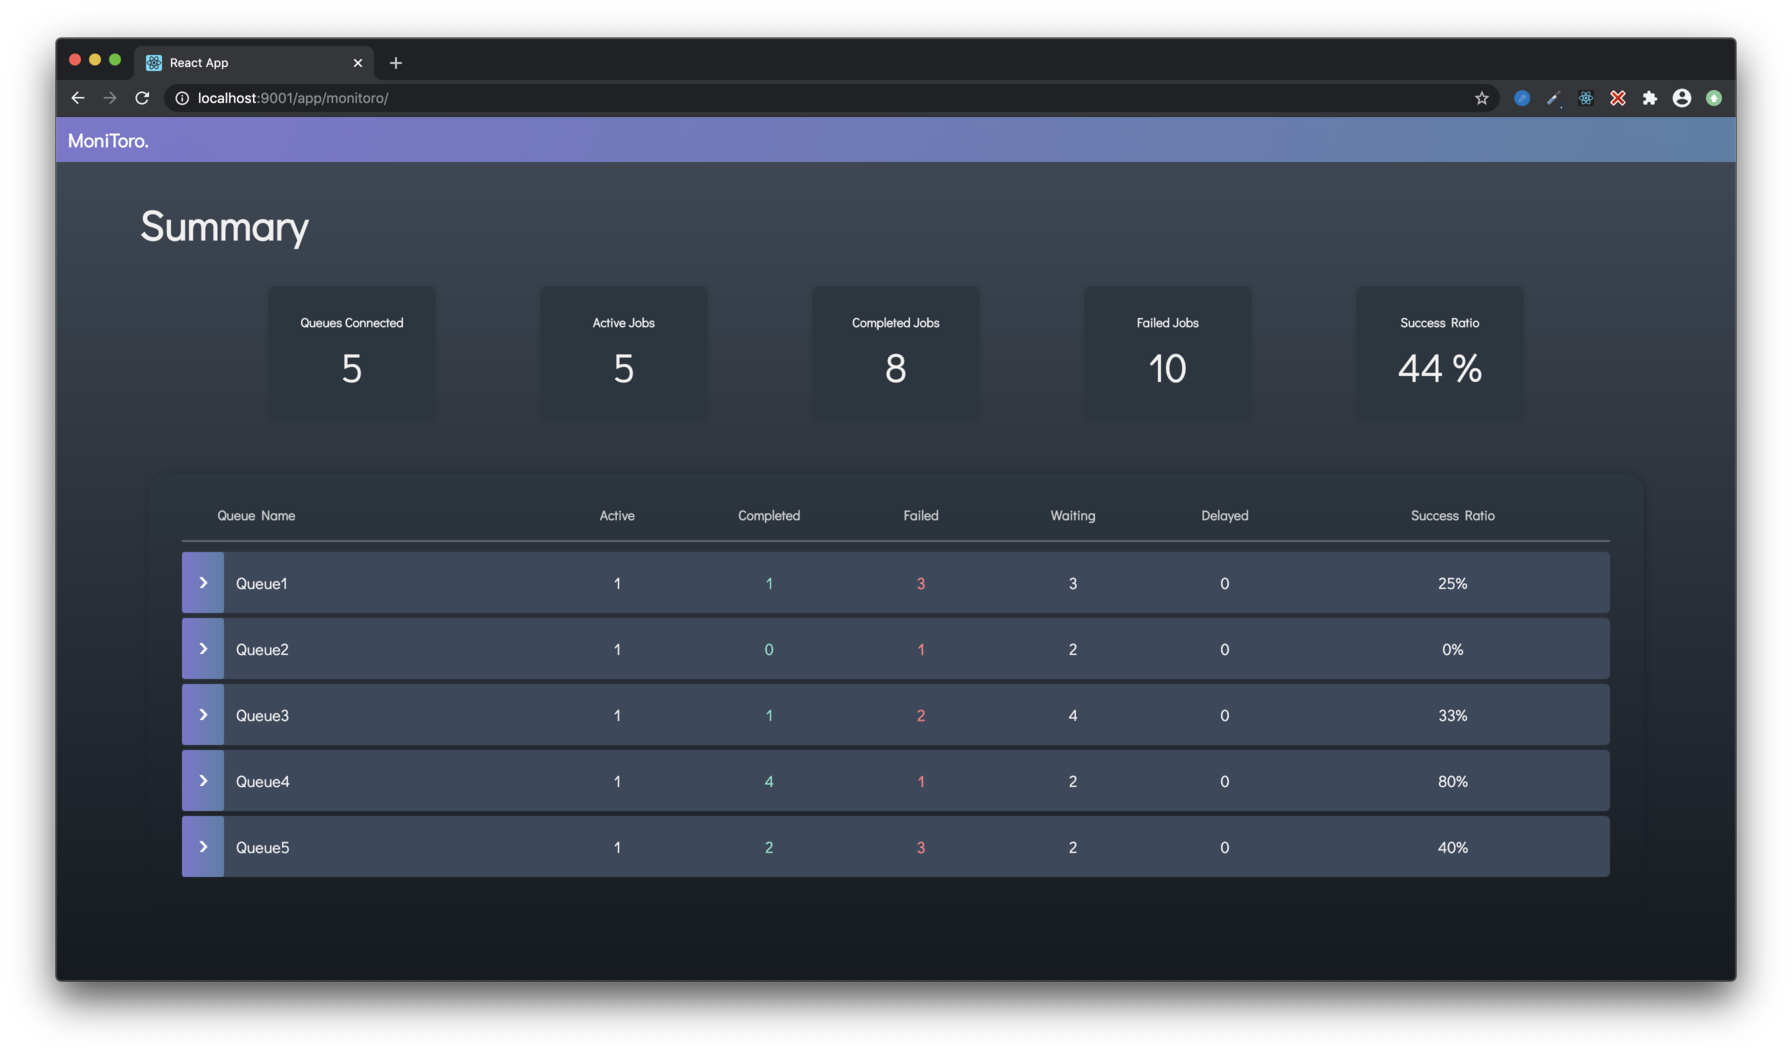
Simple stats to highlight queue performance/health.
Does not interfere with your existing way of working with bull. This dashboard can be deployed as a self contained middleware in your existing express server or on a separate server entirely.
Currently only supports monitoring tasks. Adding/deleting/retrying jobs is not possible from this dashboard in the current version.
Planned features:
Search based on job results
Pagination+lazy-load to handle large number of jobs
Delete/Retry job from the UI
Usage
Install the module npm install monitoro
Import it in your express app
constmonitoro=require('monitoro')
Add your queue config array to app.locals.MonitoroQueues
app.locals.MonitoroQueues=queueConfigArray
where queueConfigArray is an array of queue config objects of type
{
    "name": "<name of the bull queue>",
    "url": "<url to the redis instance>"
}
For an example queueConfigArray check server/devServer.js
Use the module as middleware for the route at which you want the dashboard to be available. For example, if I want to make the dashboard available at /foo in my Express app,
app.use('/foo',monitoro)
subdirectories can also be used:
app.use('/foo/bar',monitoro)
Check server/devServer.js for a simple example of usage
Development
To run it locally for development:
clone the repo
run npm run dev:fe to start the react dev server for the frontend
run npm run dev:server to start the express dev server
Open https://localhost:3000 in your browser
Contribution
All bug fixes, feature ideas, feedback, etc. are welcome!
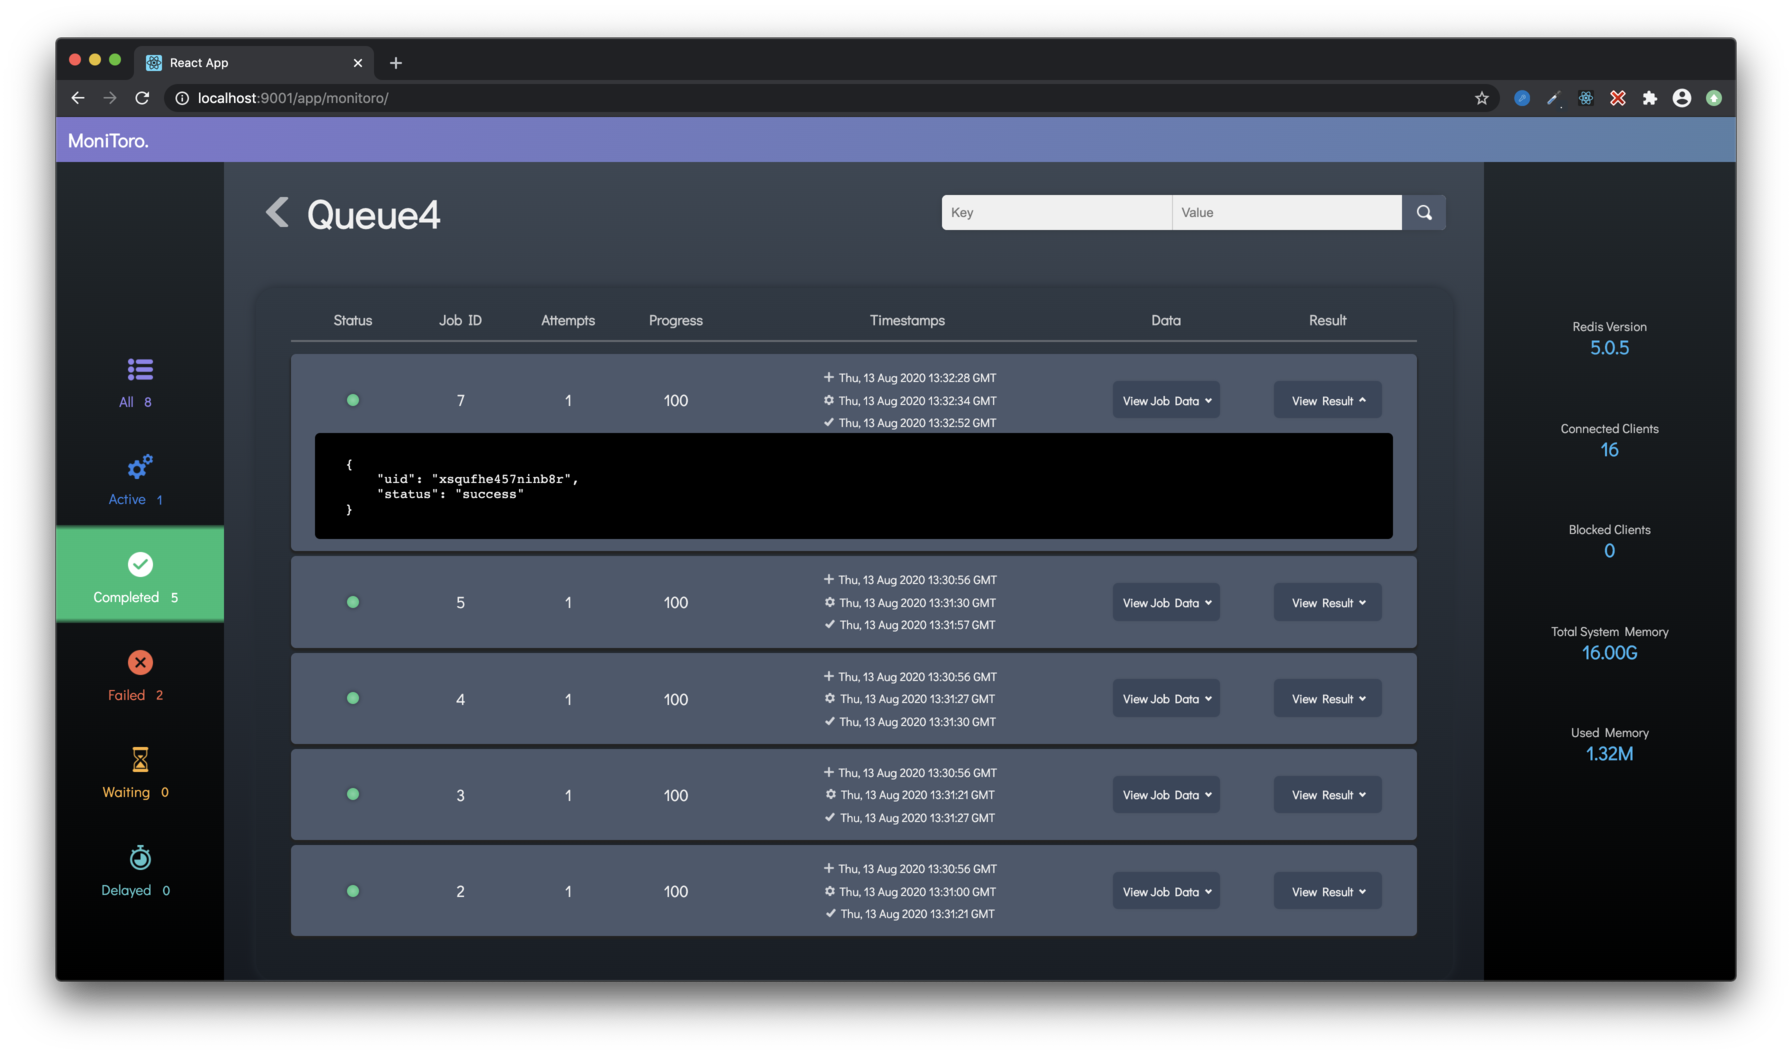
Screenshots
About
Dashboard for monitoring Bull queues, built using Express and React.