HTTP/2 200
date: Thu, 22 Jan 2026 10:40:50 GMT
content-type: text/html; charset=UTF-8
server: cloudflare
x-frame-options: SAMEORIGIN
x-content-type-options: nosniff
expires: Wed, 11 Jan 1984 05:00:00 GMT
cache-control: no-cache, must-revalidate, max-age=0
pragma: no-cache
link:
; rel=shortlink
vary: Accept-Encoding
strict-transport-security: max-age=31536000; includeSubDomains; preload
x-xss-protection: 1; mode=block
nel: {"report_to":"cf-nel","success_fraction":0.0,"max_age":604800}
report-to: {"group":"cf-nel","max_age":604800,"endpoints":[{"url":"https://a.nel.cloudflare.com/report/v4?s=iyqSImcn3iRPuKhg5nJU4eM8I7teZhOysBJUWj2qqcxfyu3Fxx7jihUMfOG4uc%2FxythrjpgbM7PzY6ZLrmVWV%2BMGJZmBXUlCljxtNOvL"}]}
cf-cache-status: DYNAMIC
content-encoding: gzip
cf-ray: 9c1e6f77ee0df473-BLR
Courses – FlowingData
Courses
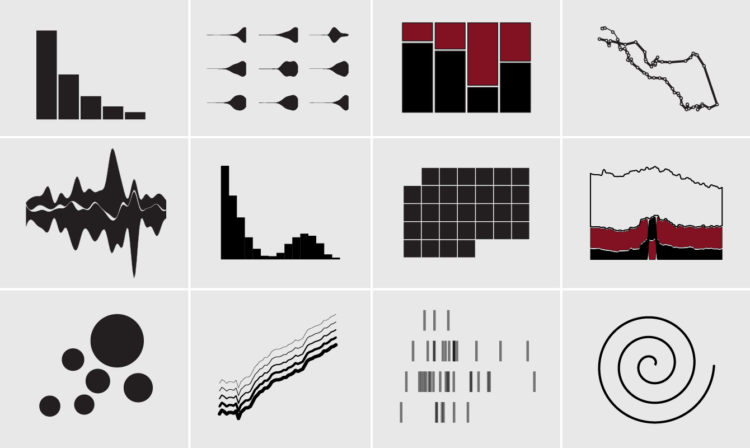
Learn the process of visualizing data, step-by-step from beginning to finished charts.
Help people understand what data has to say, because it rarely speaks for itself.
Learn the fundamentals. Then make any chart with your own data.
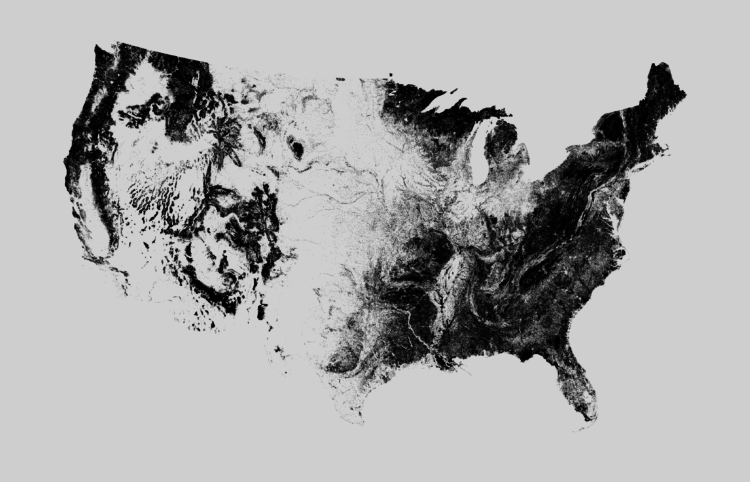
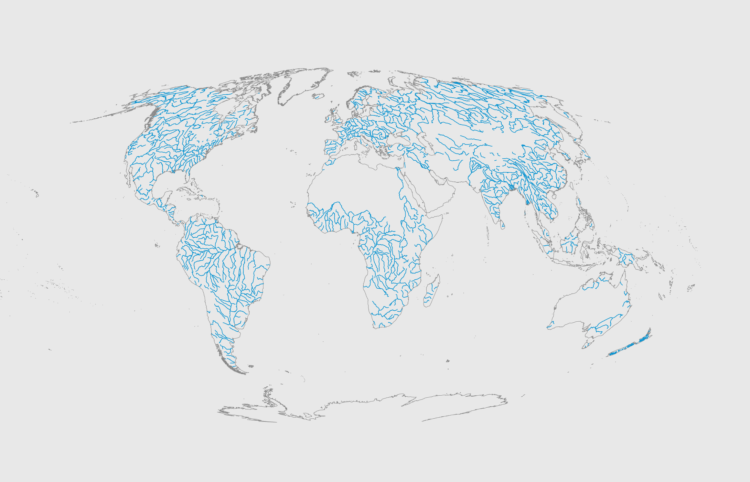
There are many ways to map geographic data in R, and with all the packages available, it can seem like a hodgepodge of items with no clear spot to begin. This doesn’t have to be the case.
Step-by-step instructions on how to work with geographic data and make different kinds of maps, in a familiar package.
Everything you need to know to see and show patterns over time, from basic chart types to the more advanced.