| CARVIEW |
Select Language
HTTP/2 200
date: Wed, 21 Jan 2026 00:09:16 GMT
content-type: text/html; charset=UTF-8
server: cloudflare
x-frame-options: SAMEORIGIN
x-content-type-options: nosniff
expires: Wed, 11 Jan 1984 05:00:00 GMT
cache-control: no-cache, must-revalidate, max-age=0
pragma: no-cache
link: Dot Density Map – Chart Types – FlowingData
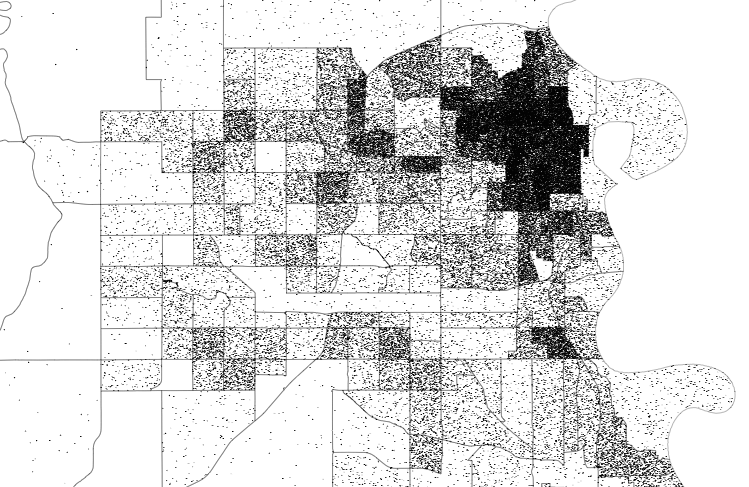
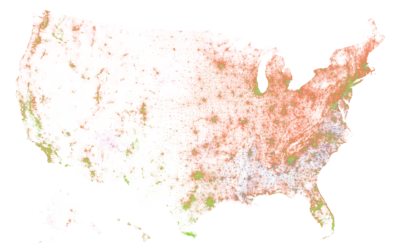
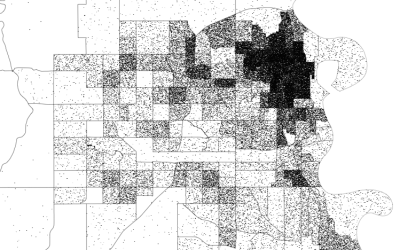
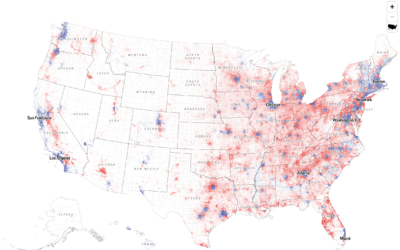
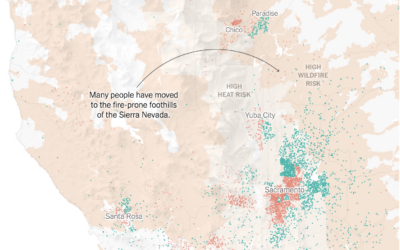
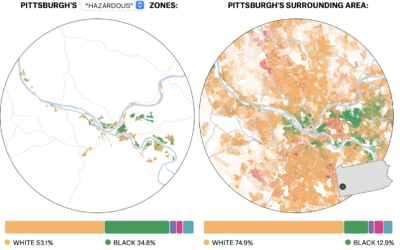
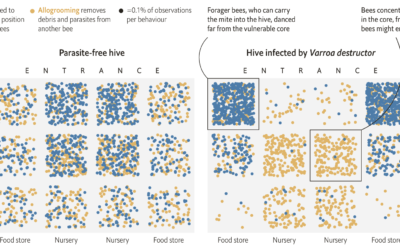
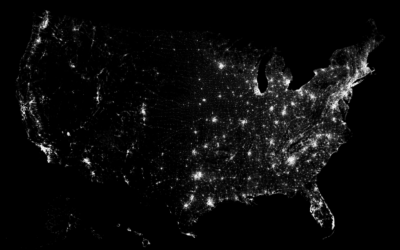
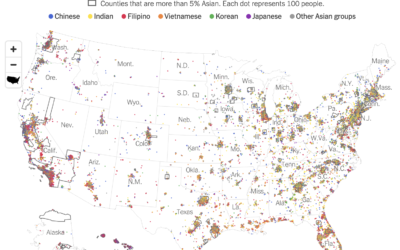
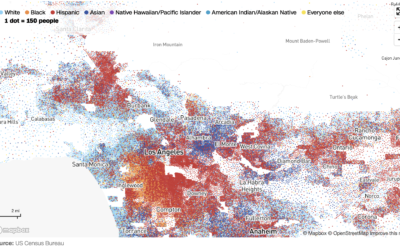
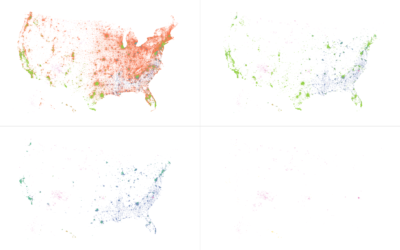
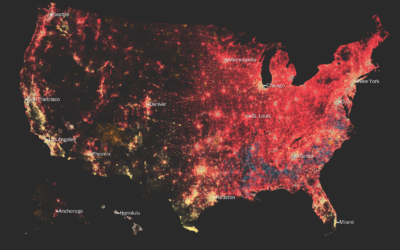
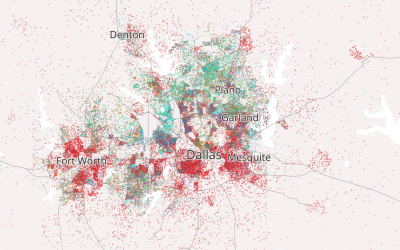
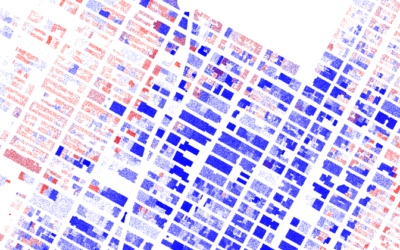
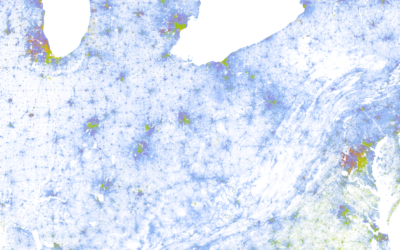
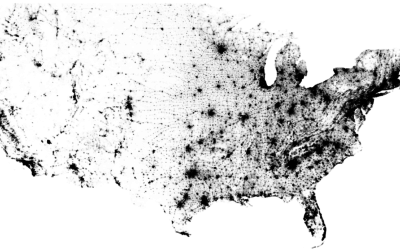
Dot Density Map
Dots are placed randomly within regions to show the density of populations. The dots and spacing allow for multiple groups to be shown at once.