Stating the obvious, the U.S. president has made lucrative business deals while in…
| CARVIEW |
Select Language
HTTP/2 200
date: Tue, 20 Jan 2026 18:01:22 GMT
content-type: text/html; charset=UTF-8
server: cloudflare
x-frame-options: SAMEORIGIN
x-content-type-options: nosniff
expires: Wed, 11 Jan 1984 05:00:00 GMT
cache-control: no-cache, must-revalidate, max-age=0
pragma: no-cache
link: ; rel="alternate"; title="JSON"; type="application/json"
vary: Accept-Encoding
strict-transport-security: max-age=31536000; includeSubDomains; preload
x-xss-protection: 1; mode=block
nel: {"report_to":"cf-nel","success_fraction":0.0,"max_age":604800}
report-to: {"group":"cf-nel","max_age":604800,"endpoints":[{"url":"https://a.nel.cloudflare.com/report/v4?s=QC24KsInvWhw25hE6c3x%2FRcshjkjzdVQklVu7iFtpc9YDi7ztw9xqBKwCKwJQY5CaL6uaCWVbiz%2FRpOf8CFzfreWyviKw2xVyq0cYMNN"}]}
cf-cache-status: DYNAMIC
content-encoding: gzip
cf-ray: 9c107a0a0ae89ac4-BLR
Network Visualization – FlowingData


Network Visualization
Fun with links, nodes, and edges.
-

Network of presidential business deals
-

Trump business network spreads
For the Wall Street Journal, David Uberti, Juanje Gómez, and Kara Dapena mapped…
-

More OpenAI circular deals
For the New York Tiems, Jacqueline Gu and Cade Metz break down the…
-

Circular deals among AI companies
The big AI companies are making deals with each other, promising and distributing…
-
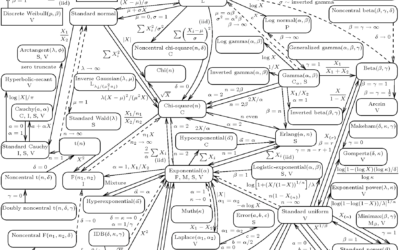
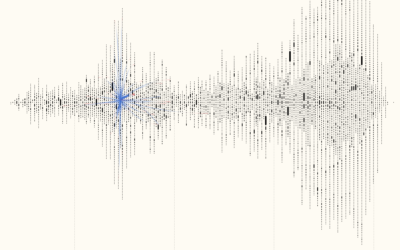
Network of statistical distributions
The network of 76 probability distributions show how they are connected:
Solid lines… -
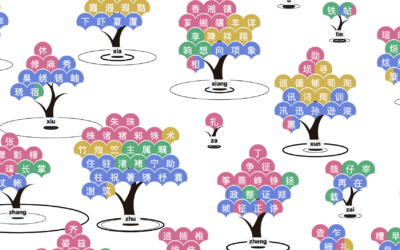
Chinese names lost in translation
Liuhuaying Yang aims to clarify the names and sounds that get lost when…
-
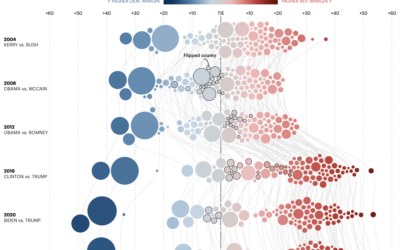
Margin of victory over past elections, in Minnesota
For the Minnesota Star Tribune, Yuqing Liu and C.J. Sinner show how the…
-
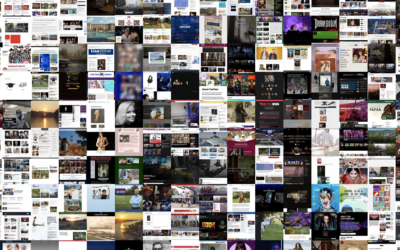
One million screenshots of the web’s homepages in a single layout
One Million Screenshots, by Urlbox, is a collection of 1,048,576 homepage screenshots in…
-
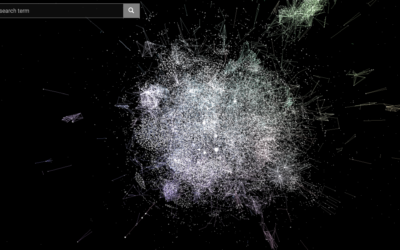
Visually navigate code as stars and galaxies
Andrei Kashcha visualized major software packages as galaxies that you can fly through.…
-
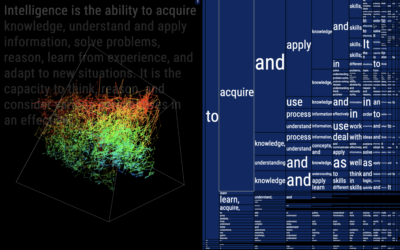
Visualizing the statistical connections behind ChatGPT
To gain a better understanding of how ChatGPT works under the hood, Santiago…
-
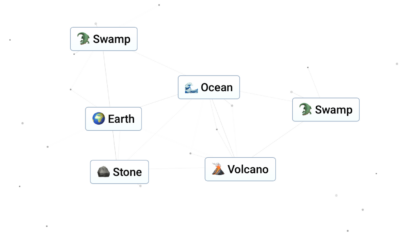
Infinite Craft with large language model
Start with water, fire, wind, and earth and see what you can craft…
-
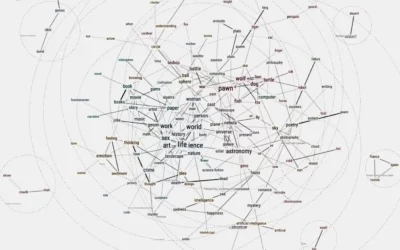
Friend simulation system, with ChatGPT
Philippe Vandenbroeck and Santiago Ortiz were curious about a system that incorporated knowledge…
-
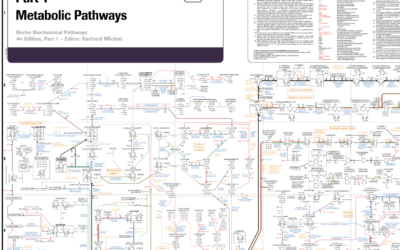
Big diagram of metabolic pathways
The contents of this diagram is not in my scope, but it is…
-
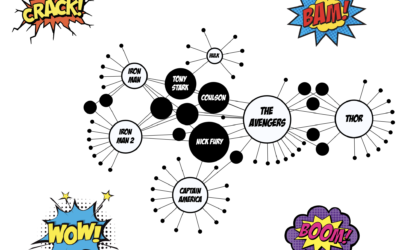
Network for Marvel Cinematic Universe
With a fun view of the Marvel Cinematic Universe, Tristan Guillevin walks through…
-
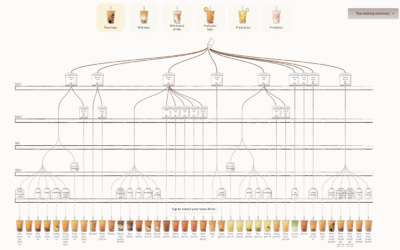
Bubble tea combinations, a visual breakdown
Walk into a boba shop and usually you’ll see a large menu that…
-
Visualizing 16th century letter correspondence of the Tudor government
Kim Albrecht, Ruth Ahnert, and Sebastian Ahnert visualized the network of communications over…
-
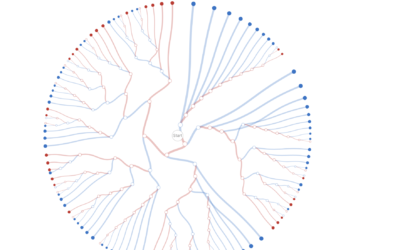
Decision tree for the presidential election result
While we’re on the topic of election scenarios, Kerry Rodden provides a radial…
-
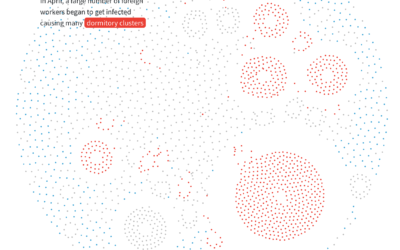
Anatomy of an outbreak
For Reuters, Manas Sharma and Simon Scarr animated a coronavirus outbreak in Singapore…
Recently for Members
Second Edition
 Visualize This: The FlowingData Guide to Design, Visualization, and Statistics (2nd Edition)
 Visualize This: The FlowingData Guide to Design, Visualization, and Statistics (2nd Edition)
New tools, refined process.
Browse by Chart Type See All →