Today, let’s add to the collection with this image from the Committee to Unleash Prosperity that compares twenty states, all of which had no income tax back in 1960.
The red line shows the share of U.S. income earned in 11 states that imposed income taxes at some point after 1960. The blue line shows the share of U.S. income earned in the 9 states that have avoided that mistake.
The changes in relative prosperity are amazing (and confirm some research I shared in 2012).
To be sure, there are many policies that determine long-run growth, so the above chart is not just about state income taxes.
Once again, we see New York and California losing while Texas and Florida are winning.
But it’s not just people. Businesses also move, as illustrated by this chart. California and New York have the biggest dark-blue bars, representing out-migration. Florida and Texas, by contrast, are reaping the biggest rewards, as measured by the light-blue bars.
This data should not be a surprise.
But what is remarkable, however, is the source. The chart comes from a report by Tej Parikh for the U.K.-based Financial Times, a publication that normally leans to the left.
Here are some excerpts from his column.
New York and California have long propelled the American economy. But momentum in both coastal powerhouses is fading. …In the past decade, the states have faced an exodus of businesses. California and New York have, by far, the highest net outflow of domestic companies across the US since the start of 2015… New York and California hold the top spots for the number of regulatory restrictions across the US, based on data collated by George Mason University’s Mercatus Center. First-ranked California has more than three times the US average. New York and California boardrooms often complain about onerous permitting rules, licence requirements and reporting standards that raise costs, crimp innovation and slow expansion. Both states have among the highest minimum wage rates, too. A complex web of high taxes makes matters worse. …The loss of businesses and workers puts strain on California and New York’s economic model. …Both states are struggling to balance the books. New York faces an estimated cumulative three-year budget deficit of $34.3bn. California has a projected $18bn shortfall for the new fiscal year. …the continued loss of cornerstone taxpayers isn’t sustainable. In the decade between 2011 and 2021, New York lost $111bn in net adjusted gross income due to interstate migration, and California lost $102bn… As California and New York demonstrate, taxpayers can and do vote with their feet.
Wow. Not only is the FT acknowledging problems for big-government states, it’s also correctly identifying why those states are in trouble.
For instance, the article includes this graph showing that California and New York have the most red tape and rank at the bottom for tax policy.
Even more surprising, the article also includes this chart showing New York and California are among the most profligate states for social welfare spending.
The bottom line is that California and New York are on a downward trajectory.
And while it’s noteworthy that a left-leaning outlet like the Financial Times has the right diagnosis, I’m very doubtful that the politicians in either Sacramento or Albany (the respective state capitals) have the desire or ability to change direction.
So I fear the decline can’t and won’t be reversed.
Honest leftists (the “Okunites“) generally acknowledge that laissez-faire policies deliver more growth, but they nonetheless favor high taxes and redistribution because they argue that social equality matters a lot.
However, according to this chart, there’s a negative relationship between bigger government and social welfare indicators such as health, education, unemployment, and exclusion.
Looking specifically at labor markets, you see a negative relationship between bigger government and good results.
This holds true even for workers with only a basic level of education.
The two charts come from a new book (available online for free from the London-based Institute of Economic Affairs) by Nina Sanaddaji and Stefan Stefan Fölster.
Here’s how the authors summarize their findings.
A group of low-tax countries has moved to the top in terms of most measures of welfare quality, surpassing high-tax countries such as the Nordics. is is relevant, not least since for a long time the Nordic high-tax models were considered internationally as the best model for welfare delivery. Yet even the Nordic social and economic success was built during periods of low taxes, and stagnated in relative terms after shifting to high taxes. …At the core of this book is a systematic analysis of the available statistical measures that capture the quality of welfare in higher-income countries. …In the overall ranking, Switzerland, Japan and South Korea occupy the top spots. All of these are low-tax coun tries, with a tax burden between 26 and 32 per cent of GDP. By comparison, a high-tax country like Sweden now ranks 12th in terms of overall welfare, …Low taxes are not sufficient on their own to ensure good welfare outcomes.
Given my interests, I especially liked Chapter 7, which investigated the relationship between economic performance and the size of government.
The authors did something I haven’t seen before, which is to measure that relationship by decade.
For what it’s worth, the strongest link was during the 1980s, which may have been caused by both convergence among Asian nations and the pro-growth policies of Thatcher and Reagan.
The relationship was still there, albeit not as strong, in the first decade of this century.
At this point, we’re probably looking at a few examples of anti-convergence.
That’s the good news. The bad news is that average growth rates for everyone are lower, which is almost surely due to the fact that public policy has moved in the wrong direction this century.
Mr. Demos of Pnyx speculated that China would be as backward as India today if the communists has not prevailed in that nation’s civil war about 75 years ago.
To which Mikita responded that Taiwan’s economic success is evidence to the contrary. That’s where the KMT wound up after losing the war and Taiwan is now one of the world’s most-successful economies.
This has motivated me to take a closer look at Taiwan’s economic performance.
Back in 2014, I looked at per-capita GDP from Maddison and asserted that Taiwan is the success story, not China.
Since 11 years have passed, I went to the same database to show updated numbers.
Lo and behold, Taiwan has almost caught up to the United States.
Needless to say, there’s a big gap between having the 7th-highest level of economic liberty and being mired at #108.
I suspect China’s per-capita GDP will struggle to reach $25,000 in the absence of further reform (in other words, caught in the middle-income trap). Taiwan, meanwhile, may very will pass the United States in the near future.
One very admirable feature of Taiwanese economic policy is that the burden of government spending is less than 20 percent of economic output, which is similar to Hong Kong and Singapore.
And it has enjoyed periods of significant spending restraint. I already noted significant spending restraint between 2001 and 2006.
The IMF data shows an even longer period of spending restraint between 2010 and 2019.
Taiwan has slipped a big since 2019, but the burden of spending is still less than 18 percent of GDP, which is very impressive compared to other rich nations.
I’ll close by observing that all the “Asian Tigers” have had reasonably good pro-market policies. Taiwan is simply the least-appreciated member of that club.
Here’s a map showing how states are ranked. It’s good to be light green and it’s bad to be dark blue.
It would have been nice if the Tax Foundation’s map identified and numbered the states to make it easy to identify the best and worst.
Though the report obviously has all that information. Readers who are familiar with state tax issues won’t be overly surprised to see Top-5 and Bottom-5 jurisdictions.
The report is based on several variables, such as business taxes, sales taxes, and property taxes.
A good rule of thumb, however, is that a state will score highly if it does not have an income tax (which is the case for the Top-5 jurisdictions).
In addition to knowing which states are the best and worst, I also think it’s important to know which states are improving and deteriorating over time.
So I dug into the Tax Foundation’s archives and identified the states that have enjoyed the biggest jumps as well as the ones that suffered the biggest declines since 2011.
As you can see, the state of Washington is a train wreck, as are Illinois and Oregon. Kudos to North Carolina for a huge jump, and special mention for Iowa and North Dakota.
Keep in mind that some states have always been good (like Florida and South Dakota) and some have always been bad (such as New York and California), so they would not show up in a table measuring relative changes.
P.S. One final comment is that I don’t think Wyoming deserves to be highly ranked. It has a bloated state budget, but most of that spending is financed by energy severance taxes, which are not counted in the rankings. I think Alaska is over-ranked for the same reason.
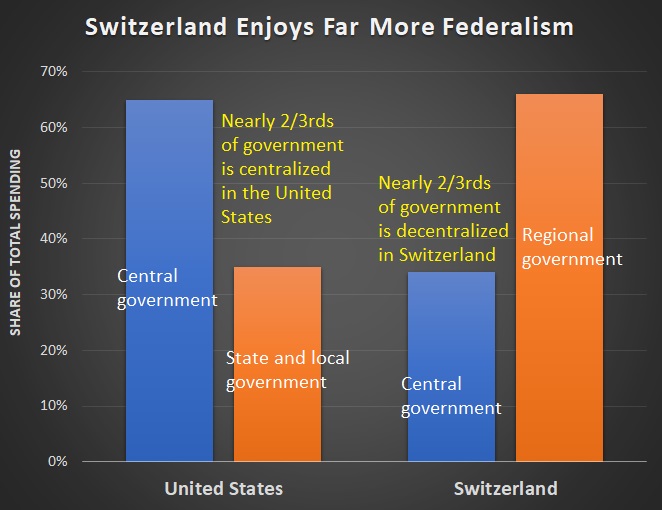
Today, let’s heap more praise on the Alpine Republic.
Some of it, surprisingly, from an article in the New York Times by Ruchir Sharma.
Here are some excerpts.
There is…a country far richer and just as fair as any in the Scandinavian trio of Sweden, Denmark and Norway. But no one talks about it. This $700 billion European economy is among the world’s 20 largest, significantly bigger than any in Scandinavia. It delivers…lighter taxes, smaller government, and a more open and stable economy. Steady growth recently made it the second richest nation in the world, …with an average income of $84,000, or $20,000 more than the Scandinavian average. …This less socialist but more successful utopia is Switzerland. …Capitalist to its core, Switzerland imposes lighter taxes on individuals, consumers and corporations than the Scandinavian countries do. In 2018 its top income tax rate was the lowest in Western Europe at 36 percent, well below the Scandinavian average of 52 percent. Government spending amounts to a third of gross domestic product, compared with half in Scandinavia. …The Swiss have become the world’s richest nation by getting it right.
I’m not sure why the author wrote that Switzerland is “less socialist” while then soon after noting that the country is “capitalist to its core.”
That seems like “not socialist” to me, but overall, a fair article.
The Swiss also got some positive attention from the U.K.-based Economist, which ranked Switzerland as having the world’s most innovative economy.
And the OECD ranks Switzerland as having the best combination of political efficiency and democracy satisfaction.
By the way, I’m assuming the slender Swiss document is in multiple languages, so the above image actually understates Switzerland’s advantage.
Last but not least, here’s a potential explanation for why Switzerland is so far ahead of its neighbors.
There are some versions of “right” that I don’t particularly like, so the most important part of the above visual is the last sentence.
In my simple way of thinking about the world, Switzerland is a case study for why “classical liberalism” is the best role model. Though nowadays it would be called small-government conservatism (or Reaganism) in the United States and “neoliberalism” in Europe.
P.S. As I wrote in 2011, I nonetheless prefer the United States over Switzerland.
Earlier this month, I shared some research about the economic cost of ambiguous laws, which I called clutter.
Today’s column will do something similar, except the term used will be “anti-competitive market distortions.”
Here’s a visual from a new report by the Growth Commission.
The authors (13 economists from all over the world) explain that bad government policies create distortions that make hinder growth and dynamism.
The report measures the impact of these distortions and also ranks the world’s 20 most-cluttered and least-cluttered economies.
Here are the most laissez-faire nations. The chart is confusing because countries are listed based on their 2010 scores. But if you look at the 2019 scores in Appendix B, the top-3 nations are Singapore, New Zealand, and Denmark (some of you may be surprised by Denmark, but this confirms my assertions that Nordic countries are very pro-market when looking at variables other than fiscal policy).
Based on Appendix B, the United States is #7, which is an improvement compared to 2010. Though, as the authors note, the U.S. score is “essentially unchanged” while other countries dropped.
Now let’s look at the worst nations (at least among the ones that were ranked since hellholes such as Cuba, North Korea, and Venezuela otherwise would be the worst of the worst). In this case, the authors did rank nations based on 2019 scores, so no need for any mental gymnastics.
Chad wins the booby prize, followed by Madagascar and Bolivia.
Though Appendix B lists Chad, Zimbabwe, and Madagascar as the three worst, so the report could still use a bit of copy-editing.
I’ll close with four final observations.
The report speculates that Trump’s protectionist policies may have a positive effect because they will encourage nations to get rid of their “anti-competitive market distortions.” I hope that is correct, but I’m very skeptical.
Ukraine isn’t actually one of the 20-worst nations if you look at Appendix B, but it is still very bad, which is why I hope western nations eventually will demand radical pro-market reforms as a price of economic and military aid.
Argentina was also one of the worst nations based on 2019 scores, ranking only a few spots above Ukraine. This underscores the huge economic barriers that Javier Milei needs to overcome to help his country prosper.
The report lists 16 Findings, one of which is that nations should use “mutual recognition” for international economic relations to enhance regulatory competition. My only complaint is that this should have been the #1 finding.
P.S. I should do a new version of my Laissez-Faire Index. I’m guessing it will track closely with the results of this report.
I put a lot of focus on “convergence” and “divergence” because economic theory says rich countries should not grow faster than poor countries.
So when there are examples of divergence, especially when looking at decades of data, we can learn very important lessons about economic policy.
Those lessons, in every single case, teach us that free markets and limited government are a recipe for faster long-run growth and higher living standards.
Today, let’s consider another example. And we’ll start with this chart from Sam Bowman, which shows that Americans are getting richer faster than Europeans are getting richer.
The chart comes from an article he wrote for Reason on the prosperity gap between the United States and Europe.
Here are some excerpts, starting with some comparative statistics.
Europe may be beautiful, but it has become a byword for economic malaise… Most of us in Europe don’t own ice makers. …air conditioning is still a luxury across the continent. …Like most Europeans, I don’t own a dryer. The average American could stop working in the first week of October and still will have earned more than the average Frenchman working until the end of the year. In Western Europe, GDP per capita—the average economic output per person—is about $63,000 per year, adjusted for the cost of living. In the United States, it is $86,000. …For roughly two decades, Western Europe, home to the continent’s largest economies, has stagnated. In 1995, its labor productivity—the value of goods and services produced per hour worked—was 95 percent of what it was in the United States, having risen from just 22 percent in 1945. By 2023, it was down to 80 percent. …the median American household has a disposable income that is 16 percent higher than the median German household, adjusted for purchasing power.
He then looks at potential reasons for Europe’s lagging performance.
He touches on several areas. I especially liked his discussion of labor market red tape.
What explains this gap between Europe and the U.S.? There are many factors, from rigid labor markets to energy restrictions to trade barriers to burdensome regulations on tech companies. The connecting thread is that Europe is poor because of specific policy choices. Europe is poor because it chose to be poor. …what really separates European companies from American ones is Europe’s high cost of business failure, rooted in its inflexible labor laws. …In markets where companies have to take risks, mass layoffs can be unavoidable. But in the United States, layoffs are usually quick and relatively low-cost; in the E.U., they can take months or even years.
Rather than trying to harmonize regulations with a single rule book written in Brussels, trust that rules that are good enough for Swedish consumers are acceptable for Spanish ones too. If something is legal in one European country, you should be able to trade it and use it in all the others, provided it is clear where it comes from. “Mutual recognition” of this kind was supposed to be the basis of the single market. Restoring it would be one of the biggest trade liberalizations in world history.
Just like I’ve done in previous years (2024, 2023, 2022, etc, etc), it’s time share some highlights from the Tax Foundation’s annual report on state tax competitiveness.
The 2025 version has been released and this map shows states with better tax systems (light colored) and worse tax systems (darker is bad).
Wyoming, South Dakota, and Alaska win the gold, silver, and bronze medals. The booby prizes go to New York, New Jersey, and California.
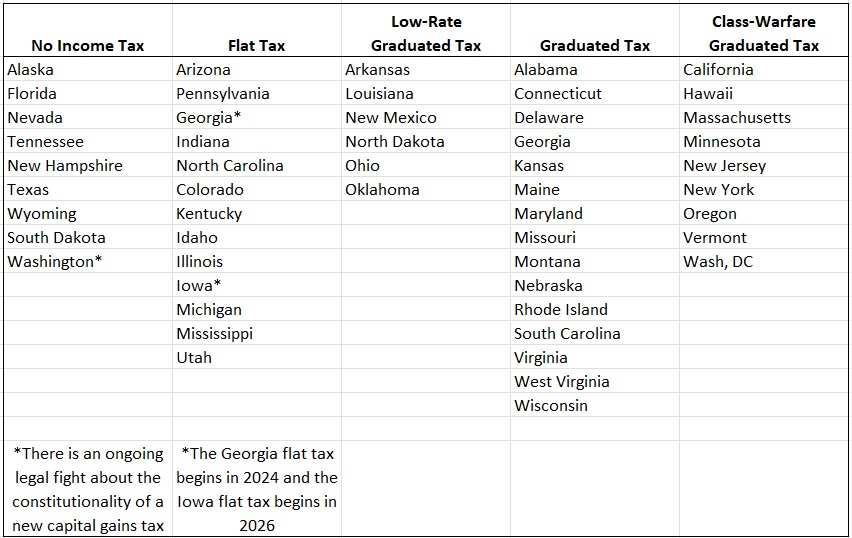
Unsurprisingly, states with no income taxes tend to score highly, followed by states that belong to the Flat Tax Club.
States with class-warfare systems, by contrast, are near the bottom.
What I find fascinating is the list of states that have risen of fallen in the rankings.
Here are states that enjoyed the biggest improvements between 2020 and 2025.
+27 Tennessee
+24 Iowa
+9 Arkansas
+6 Idaho
+6 Kansas
+5 Oklahoma
I’m a bit surprised by Tennessee’s big increase. Yes, it cemented its no-income-tax status by getting rid of levies on interest and dividends, but I would think more than that would be necessary for such a big improvement.
And here are states that suffered the biggest declines, with the Pacific Northwest clearly in a downward spiral.
-37 Washington
-21 Oregon
-10 Colorado
-7 Massachusetts
-7 New Mexico
-5 Maryland
-5 Virginia
I’m guessing that the state of Washington plummeted because it enacted a capital gains tax (contrary to the state’s constitution, but aided and abetted by a partisan judiciary).
Though that seems like a huge decline, as does Oregon’s big drop.
I’ll close with some nit-picking. The Tax Foundation’s Index is based on corporate income taxes, personal income taxes, sales taxes, property taxes, and unemployment insurance taxes.
It does not include a variable for total tax collections. If it did, Wyoming and Alaska would be ranked much lower since both of those states finance bloated public sectors with taxes on their energy sectors.
Another minor quibble is that rankings only give relative scores (i.e., Florida is better than Illinois). It would be interesting if the Tax Foundation also gave grades using some sort of absolute metric, especially since there has been a big shift toward better tax policy in many states.
Which is why I personally think South Dakota has the nation’s best tax system.
One final comment is that the Tax Foundation is looking only at the tax side of the fiscal equation. For readers interested in the spending side of the fiscal ledger, I did some rankings back in 2020 that gave high marks to Idaho (not my first guess, but also not surprising) and Connecticut (so shocking I wonder if I made a mistake).
In Part I of this series, I explained that Singapore’s pro-market policies allowed it to catch up – and then surpass – the United States.
Let’s start Part II with a video explaining the country’s climb to prosperity.
I’m motivated to write about Singapore today after seeing a chart showing how Singapore is doing dramatically better than its former colonial master, the United Kingdom.
The answer is that the nation enjoys very high levels of economic liberty. It ranks #1 in the Index of Economic Freedom and ranks #2 in Economic Freedom of the World (and almost surely will be #1 when the new edition is released).
Given my background as a fiscal policy economist, I often cite Singapore’s fiscal policy when explaining why it is richer than the United States or United Kingdom
Simply stated, it has a small-sized public sector. Here’s a chart based on IMF data showing a much-lower burden of government spending in Singapore.
While Singapore’s economic policy is admirable, it is not perfect.
Indeed, it may even be exaggerated and not as good as conservatives and libertarians sometimes believe.
Here are some excerpts from an analysis by Pradyumna Prasad.
Singapore from the statistics looks as if it is one of the least interventionist states in the world. Tax rates are low, and it is extremely easy to set up a business in the city-state. …But this focus on taxes and government spending as the measure of the size of government obscures an important fact in understanding Singapore’s government: it owns several companies… Out of the 25 largest companies listed on the Singapore Exchange (as of 26th June 2023, excluding real estate investment trusts) 9 companies were started by the government. It still maintains at least a minority stake in all of them and a majority stake in Singapore Airlines and ST Engineering. For most of them, it is still the largest shareholder. …Along with this, the government of Singapore owns the vast majority of land in Singapore… Nearly 80% of Singaporeans live in government built housing.
And even the good parts of Singapore’s fiscal policy data might not stay good forever.
I warned about slippage in 2019, and there was an unfortunate tax increase a couple of years ago.
Here are some excerpts from a report by Kok Xinghui in the South China Morning Post.
Singapore will roll out its long-delayed 2 percentage point increase in sales tax next year. …the goods and services tax (GST) hike would take place in two steps – with an increase from the current 7 percent to 8 percent on 1 January 2023, and subsequently to 9 percent on 1 January 2024. Alongside this rate hike, Wong also announced plans to increase personal income, property and vehicle taxes – measures aimed at the ultra-wealthy. …The country’s current S$% per tonne carbon tax also will rise fivefold in 2024, and subsequently be increase until in reaches S$80 per tonne by 2030.
Since the top income tax rate is now 24 percent, it would be wrong to call Singapore a class-warfare jurisdiction.
But it’s still bad news that taxes are trending in the wrong direction.
In a 2022 column for National Review, Jacob Hjortsberg wrote about Singapore’s imperfect capitalism.
There are three main elements of the Singaporean system that…demonstrate that the country is far from a free-market paradise. Element 1: …a National Wages Council was…founded — a tripartite organization consisting of labor representatives, employer representatives, and representatives from the government, tasked with formulating central wage guidelines for the Singaporean labor market. …Element 2: …the second element of Singapore’s social democracy was in place: a corporatist class compromise according to which zero-sum class struggle was exchanged for positive-sum cooperation, with the one-party state taking it upon itself to subordinate the interests of capital and labor to the unified “national interest.” …Element 3: …we get to the heart of Singaporean social democracy. Rather than being based on taxation, Singaporean social democracy is based on getting the citizens invested as shareholders in the state as a profitable corporation, with each citizen gaining access to the welfare services provided by the state based on their individually accumulated savings.
For what it’s worth, I think the above article mostly shows paternalism rather than statism.
Though it certainly is true that Singapore is not a libertarian society.
Speaking of which, let’s close with some passages from Mike Rigg’s 2021 article for Reason.
Singapore has combined classical liberal policies such as free trade, an open port, and low taxes with an authoritarian single-party government that centrally plans large swaths of the island’s economy and infrastructure, plays the role of censor in practically every media sector, canes petty criminals, and executes drug offenders. …Are there practical policies that Americans broadly and libertarians specifically can adopt from a country that combines free markets with forced collectivism? …Singapore is complex, but its core tension comes from the pairing of highly effective public and private institutions that take into account how people respond to incentives while engaging in shocking incursions on personal liberty… George Mason’s Garett Jones…asks readers whether they would “be willing to support longer terms for politicians, tightened voter eligibility, and a single, hegemonic political party in exchange for a 300% raise.” Jones later points out that a majority of Singaporeans have done just that. They’re 23 times richer per person today than they were six decades ago; the country’s GDP exploded from just under $1 billion in 1960 to $372 billion in 2019. “It’s worthy to discuss how to get to Denmark,” Jones writes of the Nordic nation, which funds a massive welfare state with high taxes and a market economy, “but it’s wise to discuss how to get to Singapore.”
For those who read my column last December about the Human Freedom Index, it’s hardly a surprise to see that Singapore is not a libertarian paradise.
The purpose of today’s column is to observe that it’s not a free-market paradise either.
But it’s still very good by global standards.
My final two cents is that Singapore’s biggest strength is low tax rates and the absence of a western-style welfare state. Those are the policies that other nations should be emulating.
P.S. Singapore’s retirement system is better than the U.S. Social Security system, but it would be better to copy the approach used by nations such as Australia and Chile.
Back in July, I used a trip to China as a springboard to write three columns (here, here, and here) about economic issues involving that nation.
One of my core messages (which I’ve been explaining for more than 15 years) was that China is not meeting its potential.
Why?
Because China stopped liberalizing about 20 years ago and is now backsliding toward more statism.
I want to build on those observations today by sharing three images that capture the current state of affairs.
Let’s start with this chart from Our World in Data, which I first saw as part of this Instagram presentation.
The good news is that China is doing much better today than in 1980.
The bad news is that China could be – and should be – much more prosperous.
But that would require a second stage of economic liberalization.
But that’s not happening. And to give you some evidence, here’s a chart showing how private entrepreneurship – as measured by company creation – has collapsed in China.
That’s one of the most depressing charts I’ve ever seen.
Last but not least, here’s a visual from a new IMF study showing the extent of industrial policy (IP) in China.
Since some people may look at this final visual as a good thing (“China is helping its companies”), I want to conclude today’s column by sharing some excerpts from the study.
We’ll start with a description of what the authors (Daniel Garcia-Macia, Siddharth Kothari, and Yifan Tao) wanted to do.
Industrial policies (IP)…have been widely used around the world, particularly in recent years. In China, IPs have long been a centerpiece of economic policy. The government has used an array of policy tools, including (but not limited to) cash subsidies, tax benefits, subsidized credit, subsidized land, trade and regulatory barriers, and industry coordination to promote certain economic sectors… This paper aims to shed light on…two issues. First, it quantifies the size of the main IP instruments in China using data from financial reports of listed firms and the land registry. Second, it estimates the impact of IP on domestic factor misallocation and aggregate productivity.
Since the above chart shows the degree of government subsidies, let’s focus on the second issue.
Here are the estimates of how industrial policy is affecting China’s economy.
The estimation results show that IP affects the allocation of production factors, but the different instruments do so in opposite ways. Subsidies are associated with excess production relative to a no-distortions benchmark, while trade and regulatory barriers limit production, possibly by increasing the market power of incumbents. Overall, factor misallocation from IP is estimated to reduce domestic aggregate TFP by about 1.2 percent relative to a no IP baseline, and this channel could reduce the level of GDP by up to 2 percent.
For those not familiar with economic jargon, TFP is productivity.
So the authors found that China’s government is undermining the nation’s prosperity by reducing productivity and lowering economic output (GDP).
That doesn’t surprise me (see here, here, and here).
What is surprising, however, is that some people in America want to copy China’s industrial policy. That’s a recipe for cronyism, corruption, and stagnation.
Part II explained the need to liberalize labor markets. This new video, Part III in the series, points out that Argentina needs better tax policy.
The video cites a couple of very depressing statistics.
First, a recent OECD report notes that the aggregate tax burden in Argentina is the fourth highest in Latin America and the Caribbean in 2023.
And second highest (behind only the basket case of Brazil) when looking just at Latin America.
In either case, that’s bad news for Argentina.
Especially when you consider that people are not getting good value.
Which brings us to the second grim statistic.
As I noted earlier this year, Argentina is the world’s third-worst country in the 1841 Foundation’s Tax Hell Index. Which means a country that has a heavy fiscal burden combined with very poor scores for governance (bad rule of law, for instance).
The good news is that President Milei has been very successful in reducing the burden of government spending. This should give him some leeway to lower tax rates and (as shown in the video) eliminate a wide range of nuisance taxes.
Hopefully that will soon happen, especially if Milei’s libertarian-oriented party gains seats in the mid-term elections later this year (I’m cautiously optimistic).
I’ll close with an analogy to show what’s happened in Argentina. Imagine going to a doctor and finding out you have all sorts of health problems because you weigh 400 lbs.
You decide you need to get serious (the diet-and-exercise equivalent of electing Milei) and you weigh 300 lbs. at your next appointment.
The doctor is very impressed and happy with your progress, but he reminds you that you still need to lose at least another 100 lbs.
P.S. Never forget that 100-plus leftist economists warned that Milei would produce disaster if he became president. Have a group of people ever been so wildly wrong?
But I need to add Rich States, Poor States, which is published by the American Legislative Exchange Council.
Here’s a look at the rankings from ALEC’s most-recent report. Congratulations to Utah, which is in first place (and it’s been in first place ever since 2008), with Tennessee and Indiana rounding out the top 3.
Since I’m a fiscal wonk, I can’t resist pointing out that Utah and Indiana have flat taxes and Tennessee has no state income tax.
More broadly, what’s interesting about the ALEC report is how the rankings differ compared to my go-to indices.
In Economic Freedom of North America and Freedom in the 50 States, Florida, New Hampshire, and South Dakota get top scores.
But Utah, Tennessee, and Indiana top the ALEC report.
Yet all three indices are methodologically sound. Here are the variables in the ALEC report.
One final comment is that it’s disappointing that my state of Virginia is only #32.
P.S. All of the indices should start measuring the presence of school choice, which is now a major difference with some states being very good and others being awful (i.e., controlled by teacher unions).
Since I’m patriotic (in the proper sense), I like seeing this kind of data. I want everyone to get richer, but I can’t resist wanting Americans to do better than everyone else.
That being said, my guy instinct is that there’s something quirky in the data. Simply stated, I question whether France, Germany, and U.K. were almost as rich as the United States in 2008. And I also question whether we’ve grown that much faster than those nations since then.
Lo and behold, this chart (all numbers in this case based on inflation-adjusted 2011 dollars) shows that my skepticism is warranted. The United States has always enjoyed an economic advantage, but the lead is not expanding at a rapid rate.
However, I admit to some misgivings about this chart, especially when looking at Germany’s comparatively strong economic performance.
My gut instinct is that policy has significantly deteriorated in recent years (more spending and green energy), so I wouldn’t expect Germany to out-perform the U.K. and France.
Interestingly, the IMF’s data is much closer to the World Bank data in the first chart.
Though there are differences. The World Bank numbers preposterously showed France ahead of the U.S. in one year, while the IMF numbers (almost as preposterously) show occasional leads for Germany and the United Kingdom.
The bottom line is that I don’t know which numbers are most accurate. Maybe somewhere in between all three data sources.
Regardless, all of the numbers lead to the same conclusion, which is that it would be very smart for the U.S. to avoid becoming more like Europe. Which is why yesterday’s column was so critical of Senator Josh Hawley.
I’m currently in Finland for meetings with various people and I learned that the country’s bloated public sector and expensive welfare state are imposing a very heavy cost on the economy.
How heavy of a cost?
According to IMF data, there’s been no growth in per-capita GDP over the past 18 years.
Why is Finland stagnating?
There presumably are several reasons, and some of them may have nothing to do with economic policy.
But I very much suspect that fiscal policy is one of the reasons. Here’s a chart showing how the burden of government has increased since 2007.
The government budget has grown faster than inflation and grown faster than the private economy. The net result, as shown in the chart, is that government is now consuming 57 percent of the economy’s output rather than 47 percent of GDP.
Needless to say, bad spending policy is correlated with bad tax policy.
And these excerpts from a report in the Helsinki Times are good evidence.
The emigration statistics of Finns with significant capital gains are indicative of attempts to avoid capital gains taxes, states Finnwatch. …The report examines emigration trends in different wealth brackets in 2014–2018 based on data from Statistics Finland. It indicates that people with more than 50,000 euros in capital gains are statistically more likely to move to countries where taxes on investment earnings are either not taxed or qualify for partial or full tax exemptions. …Portugal, Luxembourg, Singapore and Switzerland were identified as the most likely destinations for people with more than 50,000 euros in capital gains.
But even a well-designed tax code will be oppressive if politicians want to grab more than half of of the economy’s output.
So rich people are getting pillaged (and some of them are moving), but ordinary Finns are getting pillaged as well (and it’s much harder for them to escape).
I’ll close by noting that bad spending policy also tends to be correlated with bad debt policy. And that’s true for Finland.
While I cheer the shift to better tax policy, I’ve been disappointed that no state in recent years (or recent decades) has made the ultimate leap and joined the no-income-tax club.
That may be about to change.
State lawmakers in Mississippi have passed a law designed to phase out the income tax over 15 years.
Mississippi has joined a small club of nine other states in passing legislation eliminating the state income tax—an outcome that will benefit Mississippians and hopefully encourage other states to follow suit. …The new legislation will gradually lower Mississippi’s state income tax, currently sitting at 4.4 percent, to 3 percent by 2030. Further annual cuts depend on “growth triggers” linked to state revenue. …States with low-income taxes enjoy greater economic prosperity. Just compare Texas, which has no personal income tax, and Oklahoma, which has a top rate of 4.75 percent. Last month, the Tax Foundation found that Texas’ economy grew roughly 35 percent faster than Oklahoma’s over the last two decades, with Texas’ personal incomes and gross state product being notably higher too. A 2008 longitudinal study that analyzed economic growth in the States from 1964 to 2004 found that states with higher income taxes stifled economic growth, entrepreneurialism, and access to capital.
Douglas Carswell of the Mississippi Center for Public Policy played an important role in the reform.
In a column for the Foundation for Economic Education, he writes about this important development.
Mississippi has made history as the latest state (and the first since Alaska in 1980) to pass legislation banning a state income tax. …Beginning next year, Mississippi’s income tax rate will drop in 0.25% increments, sliding from 4% to 3% by 2030. After that, further reductions will hinge on the state’s budget surplus. Given Mississippi’s recent track record of substantial surpluses, the income tax could vanish entirely by the mid-2030s. …The push to eliminate the income tax has been a cornerstone of Governor Reeves’s agenda, with serious legislative efforts kicking off in 2022 under then-House Speaker Philip Gunn. Gunn’s genius was to simplify the state’s variable tax rates into a flat 4% on income above $10,000. While this didn’t eliminate the tax outright, it leveled the playing field for Mississippi households, setting the stage for broader support of full elimination. …this is great news for our state. Already there is evidence that in 2024, by some measures, Mississippi performed well economically, and may have been one of the fastest growing states in America that year. This tax reform will only add to this Mississippi momentum.
Let’s also look at some excerpts from an editorial in the Wall Street Journal.
Gov. Tate Reeves signed a bill last month that puts Mississippi on a path to zero income tax, albeit in about 14 years. Yet the messaging is right, as the state tries to lure business investment. Mississippi is sandwiched between two economic powerhouses, Texas and Florida, which don’t tax their residents’ incomes. Neither does Tennessee next door. …a law passed in 2022 is already set to cut that next year to 4%. But under the bill Mr. Reeves signed, the plan is to keep going to 3% by 2030. Reductions after that, until the tax is phased out, are conditioned on hitting revenue triggers. …The important point is that the path to zero is now enshrined in law, which is a big deal that workers and employers won’t fail to notice. The economic success of the eight states that don’t tax personal income has created a race in GOP-run states to join them, or at least to cut rates and get as close as politically possible.
Last but not least, Russ Latino’s column in National Review celebrates the abolition of the income tax and other good reforms.
Under the Build Up Mississippi Act, the Magnolia State will become the tenth state to operate without a tax on work. Only one other state, Alaska, has ever eliminated an income tax once in effect. The particulars aren’t all that sexy. The state’s flat income tax will phase down to 3 percent by 2030, marking an annual cut of some $647 million by conclusion of the phase-in. From there, revenue growth triggers will be used to pare the rate down to zero. …Since the passage of Bryant’s education reforms in 2013, Mississippi leads the nation in both math and reading gains on the National Assessment of Education Progress tests. Once last, Mississippi’s fourth graders now rank ninth in reading and 16th in math. …When you start behind, there’s a lot of room for improvement. That certainly remains true here. Getting off the bottom requires taking risks that require intestinal fortitude. But conservative ideas are working, and Mississippi has momentum.
By the way, all of the above articles note that the bill contains a typo that actually makes it easy to meet the aforementioned revenue triggers.
I’ll close, however, by focusing on an issue that is far more important.
I like that the Magnolia State has a goal of eliminating the income tax. Such a reform would be great for jobs and growth.
But what will really determine success is not a typo in the bill, but rather a commitment to long-run spending restraint.
Here is a look at the state’s performance in recent years. As you can see, the fiscal constraint last decade evaporated this decade.
Part I of this series showed higher wages and better housing in the United States, while Part II showed an ever-larger GDP advantage for America.
Part III will begin with this John Stossel video.
Sven Larson is an Associate Scholar at the Center for Freedom and Prosperity, so I’m not surprised that he did an excellent job of describing the negative impact of his country’s welfare state.
For my contribution to today’s discussion, I’ll begin my analysis with four mostly favorable observations about Europe.
While there is a lot to admire in European nations, the main policy problem – compared to the U.S. – is a bigger fiscal burden of government.
At the risk of understatement, Point #4 is what matters. Fiscal policy is the biggest difference between the U.S. and Europe. Unfortunately, many folks on the left (as well as some big-government Republicans) want America to copy European-style fiscal policy.
But that’s a recipe for European-style economic anemia.
If you don’t believe me, I already linked to the two previous editions in this series and here’s the column I usually cite when showing that Americans have much higher living standards than Europeans.
And if that’s not enough, here are two relevant columns from 2023 (here and here) and three more columns from 2022 (here, here, and here).
If you want fresh evidence against Europe’s redistributionist model, here’s what’s been happening with per-person economic output in the United States, the European Union, and the EU-15 (basically Western Europe).
Next, here’s a new chart (part of an excellent thread on Twitter/X) showing sluggish financial markets, which presumably is an indication of investor expectations for weak future growth and dismal future GDP.
If you’re not sufficiently depressed by that data, Allister Heath’s analysis in the Telegraph is grim reading.
Here are some excerpts, though the title almost tells you what you need to know.
Once the world’s richest, most advanced continent, Europe is finished… Its self-inflicted pathologies – catastrophic economic failure…and a gaping democratic deficit – have now metastasised. …Any young, ambitious European would be better off moving to America, especially anti-woke Florida or Texas. They will pay less tax. They will live better, happier, freer lives. …Their living standards will be drastically higher. …unlike in Paris, Berlin, Rome or Brussels, enough remains of its capitalist spirit, its dynamism, its entrepreneurialism, its love of science, meritocracy and technology, to see it through its current troubles. …there is no way back for a European continent that has embraced…the politics of envy, that believes that saving the planet requires shutting down successful industries and impoverishing its people, …and that won’t reform its welfare state. …Welfare states will implode, with taxes rocketing on the young to pay for healthcare and pensions for the old. …The gulf in living standards between America and Europe keeps on widening. …The continent’s high-tax, high regulation model has caused decades of under-performance.
A Wall Street Journalcolumn by Edward Conard is similarly blunt. Here’s some of what he wrote, focusing on America’s more successful entrepreneurial climate and the dangers of soak-the-rich class warfare.
America excels relative to Europe… While Europe has created 14 companies worth more than $10 billion in the past 50 years, with about $400 billion of market value in total, Americans have created nearly 250 such companies, worth $30 trillion. …The median disposable U.S. household income, according to the OECD, is now 25% greater than the median German household and 60% greater than the median household in Italy. Europeans’ incomes would be even lower if they weren’t free-riding on American innovation, defense spending and higher drug prices… The argument that we can heavily tax the tail of the distribution of payoffs without discouraging prudent risk-taking…fails to recognize that outsize payoffs at the tail of the distribution critically drive overall expected risk-adjusted returns above break-even. …When entrepreneurs capture as little as 5% of the value they create for others, it makes little sense to encourage successful risk-takers to quit working long before they achieve outsize success.
Here’s one final chart, showing how Europeans responded to the collapse of the Soviet Union.
As you can see, they got a peace dividend. Defense spending has been flat.
But domestic spending has relentlessly expanded, rising faster than the private economy.
Every president in this century, however, has increased the burden of domestic spending. And there are plenty of politicians in Washington who want to accelerate that worrisome trend.
The European version, by contrast, has been more focused on making energy more expensive by forcing consumers to use wind and solar. And, on that basis, this chart shows that it has been very effective.
But in a bad way.
Electricity prices are two to three times more expensive than they are in the United States (and about three to four times more expensive than they are in India and China).
At the risk of sounding alarmist, this is a slow-motion form of economic suicide.
The chart comes for a Wall Street Journalcolumn by Bjorn Lomborg. Here are some excerpts.
The claim that green energy is cheaper relies on bogus math that measures the cost of electricity only when the sun is shining and the wind is blowing. Modern societies need around-the-clock power, requiring backup, often powered by fossil fuels. That means we’re paying for two power systems: renewables and backup. …The International Energy Agency’s latest data (from 2022) on solar and wind power generation costs and consumption across nearly 70 countries shows a clear correlation between more solar and wind and higher average household and industry energy prices. …At least climate-obsessed European governments are generally honest about solar and wind costs and raise electricity prices accordingly.
Some of our friends on the left applaud these outcomes as part of their campaign to discourage fossil fuels.
But what they don’t understand (or don’t care about) is that these policies make Europe very uncompetitive.
Germany is a good example of what’s happening. Though maybe I should say it’s a bad example.
Writing in National Review last November, Peter Cleppe of Brusselsreport.euexplained the consequences of “net zero” extremism. Here are a few of the relevant passages.
Ahead of the traditional October summit of EU leaders, Germany’s leading business association, BDI, launched a stern warning that deindustrialization was no longer a risk but a reality. …It is not hard to understand why German industry is struggling. …there’s the European Union’s Emission Trading Scheme (ETS), a de facto climate tax that is so high that it exceeds the full U.S. natural-gas price. …scrapping the EU’s ETS system remains an absolute taboo, despite the dire consequences this approach is having for Europe’s economic well-being. …Europeans are wary that the incoming Trump administration will start a trade war, but at the moment, it is the EU that is introducing new tariffs under the pretext of climate policy, with its new Carbon Border Adjustment Mechanism… The logic of the EU is that because the rest of the world refuses to follow its self-damaging energy policies, imports into the EU should be burdened with this new tariff.
Almost every year (2023, 2022, 2021, 2020, 2019, etc), I review the Fraser Institute’s annual report on Economic Freedom of North America.
The 2024 version has just been released, so let’s look at some key findings.
Since three-fourths of my readers are from the U.S., I’ll start with the subnational ranking of American states. New Hampshire is in first place (a common occurrence), followed by South Dakota and Florida.
It’s worth noting that the five best states have no income tax (followed by several states with flat taxes).
I’m sure readers are hardly surprised to see that New York is the worst state, followed by California.
Now let’s look at all of North America, which means measuring economic liberty in American states, Canadian provinces, and Mexican states.
New Hampshire is the freest jurisdiction in North America, though the order of other states changes a bit.
What I find interesting is that only one Canadian province (circled in red) is in the top quartile.
And even when you include the second quartile, only one other Canadian province (also circled in red) appears.
The bottom line is that Prime Minister Pierre Trudeau’s tax-and-spend agenda has been very bad news for Canadians.
Now let’s look at the third quartile.
Except instead of calling attention to Canadian provinces that are above average, I’ve circled in red the American states (and Puerto Rico) that rank way below average.
In this case, Delaware is the worst state (which may explain something about Joe Biden), though New York and California continue to get poor scores.
I’m not going to bother showing the fourth quartile because it is nothing but Mexican states.
Though I will point out that the worst place for economic liberty in all of North America is Mexico City. So it’s probably not good news for Mexico that the country’s new president, Claudia Sheinbaum, is the former mayor of that benighted locality.
Let’s close by sharing some important information from executive summary of the 2024 report.
Among those North American jurisdictions that were in the bottom 25% for all-government economic freedom (averaged from 2013 to 2022) income per person in 2022 was US$2,997. But among those jurisdictions that were in the top 25% on all-government economic freedom, income per person was US$62,184. In other words, incomes in the freest North American jurisdictions were 21 times higher than in the least-free jurisdictions. Incomes are not only higher in economically free places, but they tend to grow faster in these places as well. From 2013 to 2022 total income in the freest 25% of North American jurisdictions grew 29% after adjusting for inflation. In the least-free jurisdictions, however, inflation-adjusted income fell 13%. The same patterns hold when we compare jurisdictions within countries. In those places that were the most-free relative to the rest of their country, incomes were, on average, about 3% higher than in the rest of the country. But among those places that were the least-free relative to the rest of their country, incomes were 6.8% below the country average. Among the freest US states, population grew 10 times faster than it did in the least-free from 2013 to 2022. Total employment in these states also grew about three times faster than in the least-free states over this time.
The answer is bad public policy. Both Economic Freedom of the World (China ranked #111) and the Index of Economic Freedom (China ranked #151) quantify the nation’s bad policies.
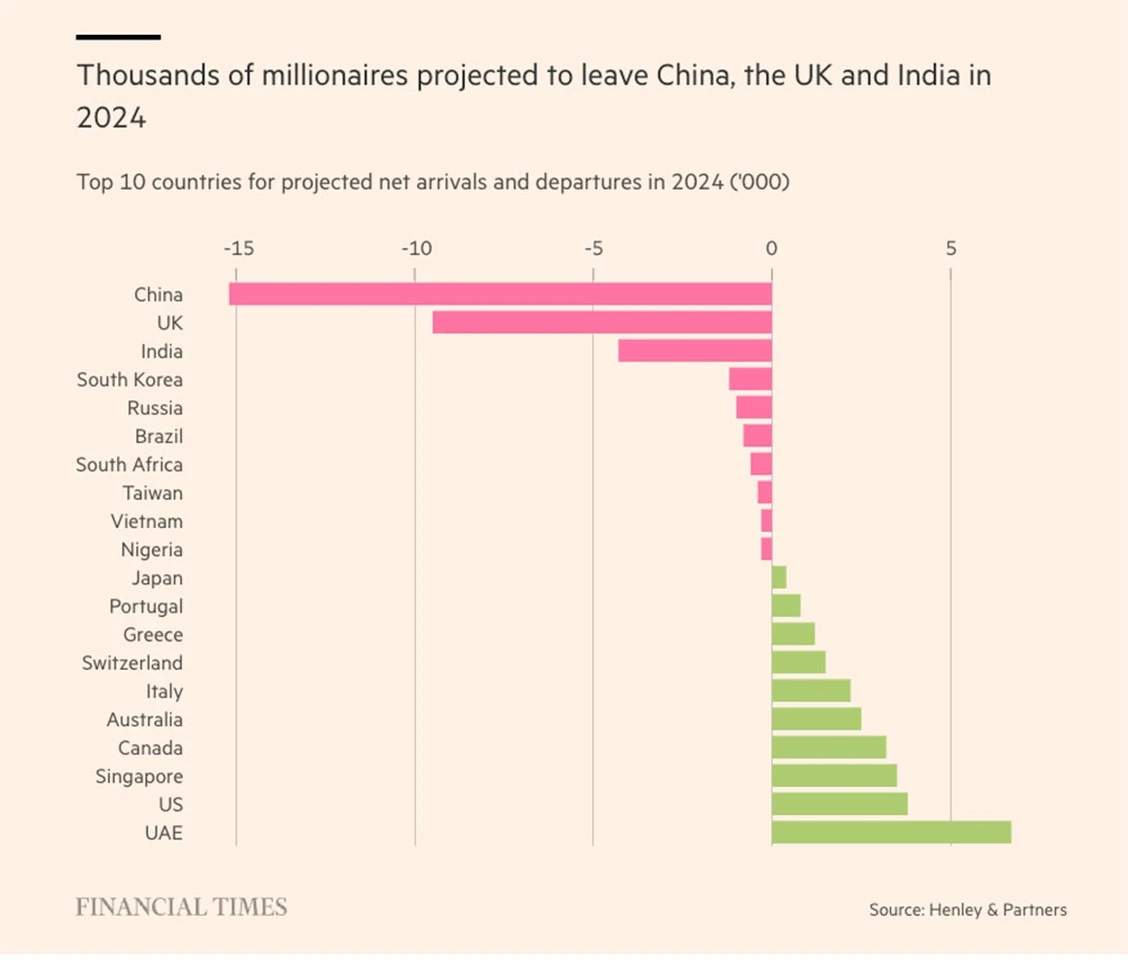
But I have a shortcut way of showing the bad news. When people manage to get rich in China, they often want to escape to countries with better policies and brighter futures.
That’s a proverbial canary in the coal mine.
That’s the bad news. The good news is that the Chinese government knows that changes are needed.
But now we are back to bad news. According to a story in today’s Washington Post by Christian Shepherd and Anna Fifield, the government is proposing more government intervention. Here are some excerpts.
China’s financial authorities unleashed…the most significant stimulus package since the pandemic struck almost five years ago. These measures…include cutting interest rates and supporting the beleaguered property and stock markets… Chinese authorities have been struggling to boost demand and stem a fall in prices amid widespread gloom about the economic outlook. …Recent data has revealed the Chinese economy is slowing faster than expected: Growth in industrial output and retail sales has slowed, while the stock market and investment in real estate took a nosedive. Unemployment is up, and deflation remains an urgent issue.
My two cents is that the so-called stimulus will fail because the Chinese government is trying to keep bubbles inflated.
In other words, the government made mistakes when it created stock and property bubbles, and now it is making mistakes by trying to keep the bubbles from deflating.
China needs more capitalism, not more intervention.
Let’s not look at some other recent articles.
A column in the New York Times last month, authored by Peter Beckley, has more bad news.
China’s boom, as we now know, was unsustainable. It was fueled in large part by years of inefficient stimulus spending at home, which has saddled China with a crushing debt hangover of its own. President Xi Jinping has stifled entrepreneurship, resisted reform and provoked a protectionist response from the United States. Since Mr. Xi took over a decade ago, Chinese economic growth has slowed significantly; some experts believe it is barely growing at all. …China is, of course, not solely responsible for weakness in the global economy, which has been buffeted by a pandemic, wars and trade tensions. But the country is making things worse at a delicate time.
Another article last month confirmed China’s unfortunate trajectory. Here are excerpts from Melissa Lawford’s article in the U.K.-based Telegraph.
Foreign investors have pulled a record £12bn out of China in an economic blow for President Xi Jinping. …It was…a massive swing from the net $10bn pumped into the country during the first three months of the year. …Foreign direct investment in China last turned negative in the autumn of 2023, when investors pulled out $12bn. Chinese companies also invested a record $71bn overseas between April and June, up 80pc year on year. Combined, this meant China suffered a record net outflow of $86bn in direct investment.
Let’s close with an article by Don Boudreaux about the failure of industrial policy.
Written for the American Institute for Economic Research, it includes some discussion of China’s misguided effort to subsidize electric vehicles.
The government in Beijing is keen on picking industrial ‘winners’ for that country, and one such chosen winner in recent years is the electric-vehicle industry. Using a variety of means, Chinese Communist Party officials and mandarins in Beijing have directed substantial resources into EV production… But as matters are developing, this ‘winner’ in China is turning into a loser. …This development is unsurprising. No matter how smart and clever are President Xi and his lieutenants, they cannot work miracles. If the Chinese have no comparative advantage at producing EVs on a scale as large as the one desired by these government officials, diverting resources on this scale into EV production is likely to backfire — as it’s now doing. …It’s impossible for officials in Beijing to know which Chinese industries their EV subsidies are destroying. It’s also impossible for them to know if the advantage that China will gain if and when it gets a comparative advantage at producing EVs will have been worth the cost. Indeed, because the money spent by government officials isn’t their own, and because these officials are not directed in their economic decisions by market prices, it’s almost certain that government-engineered economic outcomes are worse than would be the outcomes generated by freer markets.
By the way, Don’s article also explains that industrial policy in the United States is a big mistake. As a Canadian economist wisely observed, “Governments are not great at picking winners, but losers are great at picking governments.”
But let’s not digress.
Returning to China, I’ll conclude by calling attention to the four-part series I wrote while visiting China in July (see here, here, here, and here).
Less than two weeks ago, I wrote about anemic economic performance in Europe. So I was very interested to see that the European Commission just issued a report about improving European Competitiveness.
Here’s one of the first charts in the 65-page report, and it shows the big gap between U.S. and E.U. when comparing per-capita GDP.
Unfortunately, the Draghi report is also like Zakaria’s column in that it has a decent diagnosis about what’s wrong, but a largely misguided prescription of how to fix the problems.
Here’s some of what Draghi wrote in the foreword.
…a wide gap in GDP has opened up between the EU and the US… On a per capita basis, real disposable income has grown almost twice as much in the US as in the EU since 2000. …The only way to meet this challenge is to grow and become more productive… And the only way to become more productive is for Europe to radically change. … This report identifies three main areas for action to reignite sustainable growth. … First – and most importantly – Europe must profoundly refocus its collective efforts on closing the innovation gap with the US and China, especially in advanced technologies. … The second area for action is a joint plan for decarbonisation and competitiveness. … EU companies still face electricity prices that are 2-3 times those in the US. Natural gas prices paid are 4-5 times higher. … The third area for action is increasing security and reducing dependencies. …we will need a genuine EU “foreign economic policy” to retain our freedom.
These are mostly reasonable observations.
And the report is quite sound when analyzing the problem of excessive red tape. Here are some more excerpts.
…we continue to add regulatory burdens onto European companies, which are especially costly for SMEs and self-defeating for those in the digital sectors. More than half of SMEs in Europe flag regulatory obstacles and the administrative burden as their greatest challenge. …The stock of regulation remains large and new regulation in the EU is growing faster than in other comparable economies. While direct comparisons are obscured by different political and legal systems, around 3,500 pieces of legislation were enacted and around 2,000 resolutions were passed in the US at the federal level over the past three Congress mandates (2019-2024). During the same period, around 13,000 acts were passed by the EU. … a Business Europe gap analysis of 13 pieces of EU law flagged duplication across 169 requirements, including differences (29%) and outright inconsistencies (11%).
That’s the good news.
Now let’s focus on the bad news by grading the policies listed (or ignored) in the report.
Fiscal policy: Europe’s biggest economic weakness is an excessive burden of government spending, accompanied by stifling taxation and heavy debt. Based on current trends, another fiscal crisis is very likely, probably starting with Italy. Remarkably, there is no discussion of this looming problem in the report. That’s sort of like writing the history of World War II and making no mention of Pearl Harbor or D-Day! To make matters worse, the report actually endorses a bigger fiscal burden, calling for more “investment-related government spending.” Most worrisome of all, it calls for ” joint funding of investment at the EU level” financed by “issuance of common safe assets” (all of which exacerbates the over-spending problem at the national level with more spending at the pan-European level).
Grade: F
Monetary policy: The report makes no mention of the European Central Bank and there is no discussion of monetary policy, even though inflation has been a major problem in the eurozone thanks to reckless and short-sighted decisions by the European Central Bank. This is a sin of omission. As an aside, Mario Draghi is infamous (or should be infamous) for sacrificing the European Central Bank’s independence when he was in charge. His “do-whatever-it=takes” commitment was supposedly about saving the euro, but he actually diminished the currency by making good monetary policy secondary to propping up the eurozone’s welfare states. In Draghi’s defense, he can’t be as bad as the current head of the ECB.
Grade: F
Regulatory Policy: As cited above, the report correctly points out that red tape is a major problem in the European Union. And the report calls for the creation of a Commission Vice President for Simplification. This person supposedly would “streamline” regulation and create some sort of system for measuring the cost of new rules. Unfortunately, the report also embraces more centralization of regulatory authority. Worst of all, it fails to endorse “mutual recognition,” which would give businesses the ability to operate under the rules of the E.U. countries with less red tape. Last but not least, the report mentions that energy prices in Europe are much higher than in the United States, yet the report says the E.U. should double down on costly green energy (does Draghi not know what happened in Germany?).
Grade: C
Trade Policy: There are two main trade-related issues covered in the report. The first deals with the role of China, which is hard to grade because there are national security implications, as well as the vexing issue of how to respond to China subsidizing its exporters. But the second issue, industrial policy, is easy to grade because there is so much evidence that governments do a terrible job of picking winners and losers. Sadly (but predictably), the Draghi report embraces industrial policy.
Grade: D
Quality of governance: The report does not address issues such as property rights, the quality of court systems, or the level of government corruption (factors are important if the goal is to have strong economic performance). I am worried that some of the policies in the report – most notably fiscal centralization and industrial policy – will enable and encourage more corruption. That being said, let’s give Draghi the benefit of the doubt.
Massachusetts used to have a flat tax, but I warned back in 2019 that it was in danger. Sadly, my fears were warranted.
In 2022, the state’s misguided voters approved a referendum to replace the flat tax with a system based on class warfare (a choice that made my list for the “worst news of 2022“).
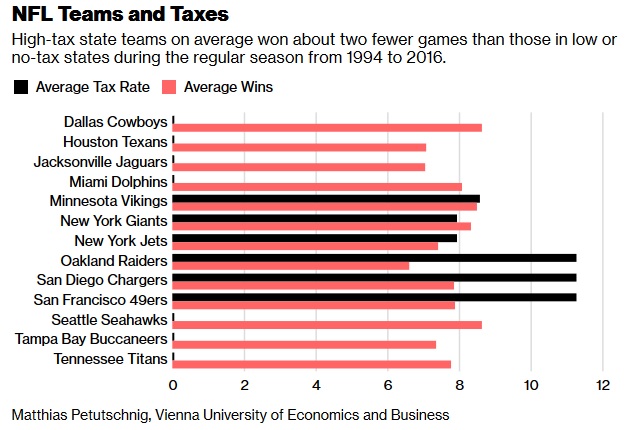
But if those voters are fans of the New England Patriots, they cut off their noses to spite their faces.
Is this just idle speculation by a couple of guys who don’t know what they’re talking about?
Hardly. According to academic research, football teams in high-tax states are at a disadvantage. On average, they lose two more games per season that teams in low-tax states.
Sticking to football, the Wall Street Journalopined on the issue last week. Here are some excerpts.
For the latest evidence that state tax policy influences taxpayer decisions, take a look at the National Football League. …states with millionaire surtaxes like Massachusetts are at a disadvantage in attracting the best free-agent players. …It’s “just another thing you’ve got to contend with in negotiations up there,” Mr. Belichick added. “It’s not like Tennessee or Florida or Nevada or some of these teams that have no state income tax.” …Massachusetts used to have a 5% flat tax on all incomes above $8,000. But in 2022 the state imposed a four percentage point surtax on incomes over $1 million. …A player making $50 million would pay $4,968,457 playing for Minnesota Gov. Tim Walz’s home-state Vikings compared to $586,902 on that same contract at the Dallas Cowboys. …Those are eye-watering numbers, but the same tax calculations exist for all taxpayers. High-income earners have more flexibility than most to relocate. Democrats who think surtaxes on the affluent make good policy might reconsider that line of scrimmage.
Since I’m a fan of the New York Yankees, I’m not happy.
New York has a terrible state tax system, so that makes it harder for my Yankees to reclaim their rightful spot as world champions.
The good news is that many of those people have the ability to escape. The bad news is that the rest of us don’t have the same flexibility to move across borders.
In 2022, I wrote a two-part series (here and here) about fiscal decay in Illinois.
I’m motivated to add Part III today because of this chart from Chris Edwards, which shows how many upper-income taxpayers are moving into a state compared to how many are escaping.
As you can see, the worst-ranked state is Illinois.
This data matters because these are the kinds of taxpayers that are the big net payers.
They also are very mobile. If they feel they are mistreated by their state governments, they have the ability to migrate. And it’s no surprise to see that high-tax jurisdictions are suffering the biggest outflows.
At the risk of understatement, it is a very bad indicator to be near the bottom. And the state at the bottom must be a basket case.
If you want to understand why Illinois is in last place, check out these excerpts from George Will’s latest column in the Washington Post.
Formerly the Land of Lincoln, now the Land of Blue State Governance Blues, Illinois…population has declined for 10 consecutive years. …Since 2000, more than 1.5 million have fled, costing an estimated $3.6 billion in income tax revenue in 2022 alone, a year the net loss of 87,000 residents subtracted $9.8 billion in adjusted gross income. In the past six years, $47.5 billion AGI has left. …Fewer Illinoisans are employed than when Democrat J.B. Pritzker became governor in 2019. The state’s 5 percent unemployment rate is the nation’s third-worst; its Black unemployment rate is second-worst. …Last year, more than 140,000 government workers and retirees in Illinois received more than $100,000 in salaries or pensions. …its unfunded state pensions liability has, according to the state, grown under Pritzker from $137 billion to $142 billion. …according to Moody’s, state pension debt is nearly $300 billion, and state and local shortfalls reached $530 billion four years ago.
By the way, it’s not just horrible fiscal policy.
You can make a strong argument that Illinois is even worse when it comes to education policy.
Under billionaire Pritzker, who sends his children to private schools…, Illinois this year became the first state ever to retreat from school choice (18 have created or expanded choice programs since 2023), killing, to please teachers unions, a small tax-credit scholarship program that served mostly poor and minority pupils. …although Illinois spends almost $24,000 per pupil (up 97 percent since 2007), only 35 percent of pupils read at grade level (1.2 million do not) and only 27 percent are proficient in math (1.4 million are not). In Decatur, 7 percent can read at grade level; in Peoria, 15 percent. In 67 schools, no child recently tested proficient in math; in 37, none were proficient in reading. Yet officials celebrate the state’s high (87.6 percent) graduation rate. …school administrators (18 superintendents made more than $300,000 in 2022) have increased 70 percent since 1998 while enrollments have declined about 100,000.
You may be wondering why Illinois lawmakers tolerate such results. Well, it all makes sense when you consider the 1st Theorem of Government.
P.S. No wonder Illinois has a big lead in the poll asking people to predict the state that will be the first to go bankrupt (and when that happens, it will be critical to stop politicians in DC from providing a bailout).
I’ve been writing about China this week (see here and here) because I’m teaching economics at Northeastern University in Shenyang.
But, regardless of my location, I probably would be writing about China this week anyhow because the country’s leadership has been having high-level meetings to address the problem of slowing growth.
To give you a sense of what’s happening, here’s the IMF data showing actual and projected growth rates from 2007-2029.
Not a pretty picture.
To put this data in context, let’s consider some good news and bad news.
The good news is that China has enjoyed some dramatic growth since liberalizing its economy starting about 40 years ago.
The bad news is that a lot more growth is needed for China to catch up to nations in North America and Western Europe.
Let’s review some reports and analyses of China’s current outlook.
We’ll start with some passages from Simone McCarthy’s article for CNN.
…top officials from China’s ruling Communist Party are gathering in Beijing this week to signal the direction forward for the world’s second largest economy as it faces major economic challenges and friction with the West. Stakes are high for the meeting, which takes place every five years and is known as China’s third plenum. …China is grappling with a property sector crisis, high local government debt and…flagging investor confidence… Economic problems on the back of years of stringent pandemic controls have triggered mounting social frustration, as well as questions about the direction of the country… About 200 members of the party’s Central Committee leadership body as well as 170 alternate committee members are gathering in Beijing to approve a document laying out a plan on “deepening reform” and advancing “Chinese-style modernization,” according to state media. …Observers will be watching for fiscal reforms, especially around taxation and government spending… Many also say the government should take steps to…expand social safety nets in a country grappling with high medical costs and a rapidly aging population.
For what it’s worth, it’s ludicrous to think an expanded safety net will boost China’s economic performance.
But let’s set that issue aside and look at another article.
Here are some excerpts from a report in the Economist.
Ever since China’s housing slump began in the middle of 2021, economists have worried that the world’s second-biggest economy might follow in the footsteps of Japan, which suffered a lost two decades… China’s retail sales…grew by only 2% in nominal terms in June, compared with a year earlier. Vehicle sales shrank by more than 6%. The slump in property rumbles on. …Could policy signals from the third plenum come to the rescue? Although the meeting, which takes place only twice a decade, is supposed to be about long-term reform not short-term stimulus, the distinction between the two is not absolute. …some structural reforms could make China’s cyclical problems worse. Local governments, for example, need new sources of revenue to replace dwindling proceeds from selling land. One answer is an annual tax on the value of property. But introducing such a tax now would seem perverse in the midst of a property slump. Another proposal discussed in recent months is expanding China’s consumption tax, which falls mainly on luxuries, like jewellery and cars, and sinful goods, like booze and cigars. Again, expanding the consumption tax would only further depress weak retail sales.
Just like more social welfare spending would be a bad idea, higher taxes also would be misguided.
But analyzing policy is not the purpose of today’s column.
Instead, we want to understand the extent to which China needs economic rejuvenation.
Regarding that question, Desmond Lachman of the American Enterprise Institute has the most pessimistic perspective.
Chinese economic growth has slowed…the Chinese economy is in deep trouble and that its economic growth model is now well past its sell-by date. Unless the Chinese government introduces major structural economic reforms…, China could experience a Japanese-style lost economic decade. …The root cause of China’s present economic problems is the highly unbalanced economic model that it has pursued over the past 30 years. Not only did China excessively rely on investment in general and on housing investment in particular to drive economic growth. It also became overly dependent on exports… There is now the clearest of evidence that China’s housing and credit market bubble has burst. House prices have now been declining for the past year, an estimated 65 million housing units are unoccupied, a host of large property developers, including Evergrande, have defaulted on their loans, and many housing projects have been abandoned. …All of this puts the Chinese government in an unenviable position to deal with the bursting of the country’s epic housing and credit market bubble. It knows that flooding the market with increased liquidity and resorting to fiscal pump priming will only add to the country’s long-term debt problem.
The takeaway from these three articles is that there are reasons to be concerned about China’s economic policy and economic outlook. Chinese policy makers realize that changes are needed and most external observers have the same perspective.
However, based on what’s being mentioned in the articles (an IMF-style mix of higher spending and higher taxes), I am not overly optimistic that concerns will lead to better public policy.
When these people move, their income moves with them. And this chart shows that the cumulative impact can be very large.
Notice, by the way, that most of the states gaining taxable income (all but South Carolina) don’t have state income taxes.
By contrast, the states losing taxable income consistently rankverylow when measuring fiscal policy.
The chart comes from the Wall Street Journal, which opined about this trend based on some new IRS data.
The pandemic lockdowns accelerated flight from Democratic-run states with onerous taxes and a high cost of living. The latest data from the Internal Revenue Service shows that the exodus has continued after life got back to quasi-normal. …California ranked, again, as the biggest income loser ($23.8 billion) in 2022, followed by New York ($14.2 billion), Illinois ($9.8 billion), New Jersey ($5.3 billion) and Massachusetts ($3.9 billion). The top gainers were Florida ($36 billion), Texas ($10.1 billion), South Carolina ($4.8 billion), Tennessee ($4.7 billion) and North Carolina ($4.6 billion). …the flight from progressive states far surpassed pre-pandemic levels. California lost nearly three times as much income in 2022 to other states as it did in 2019. New Jersey’s net income loss hit a record in 2022… If Americans living in incorrigibly progressive states want change, they will have to vote with their feet and wallets.
What’s the moral of the story?
The geese with the golden eggs can fly away when they’re mistreated.
And that’s very bad news for certain states. It may even be a recipe for eventual bankruptcy.
It’s almost as if politicians on both sides of the Atlantic are having a race to see who can do the most damage to prosperity.
Perhaps because they started with more statism, it appears that European politicians are winning. Which means that the European people are losing.
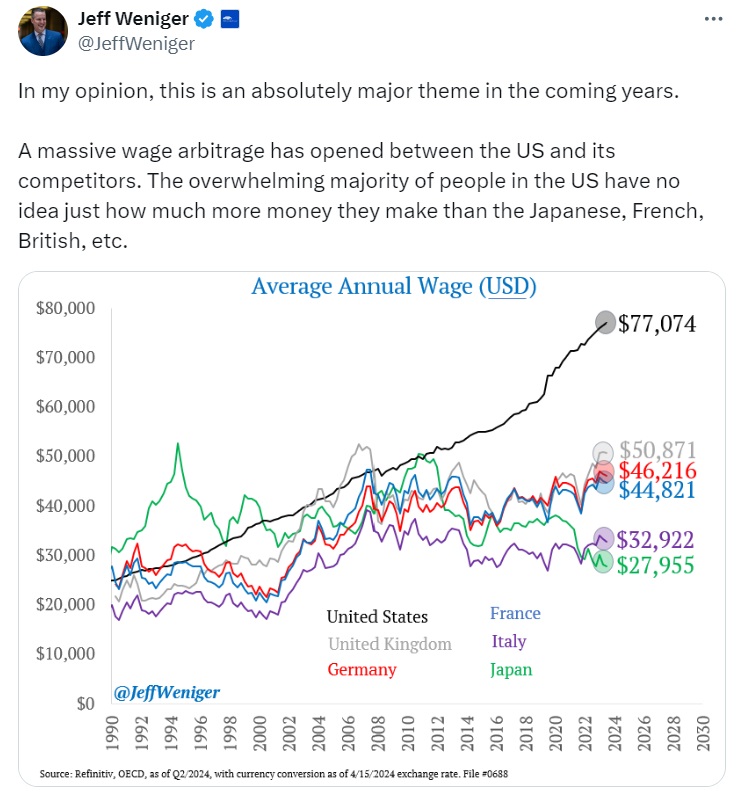
Two months ago, I wrote about the widening gulf between the United States and Europe and shared a chart about a growing wage gap between the U.S. and other major nations.
And that builds upon the two columns I wrote in 2023 (here and here) and the three columns I wrote in 2022 (here, here, and here), all of which show America out-performing Europe.
Today, let’s revisit the issue.
Here are some excerpts from a Washington Postcolumn by Fareed Zakaria. Here’s his comparison of the U.S. and Europe.
In Europe, the talk is all about how Europe has been unable to keep up with the U.S. powerhouse. …In 2008, the United States and the euro-zone economies were roughly the same size. Today, the American economy is nearly twice the size of the euro zone. And it’s not just one measure. Average European income is now 27 percent lower than in the United States, and average wages are 37 percent lower. …The U.S. economy towers above Europe’s these days. The United States’ technology companies dominate the continent. U.S. banks are far more profitable than European ones. U.S. energy production has created a boom in manufacturing which is luring many European companies to the United States. As one German CEO said to me. “America is an easier place to do business, has fewer regulations, and now has much lower energy costs. How do I rationally invest in Europe?” ……every year 300 billion euros is diverted to overseas markets to find superior investments, most of them in the United States.
But Zakaria is correct to say that Europe is in much worse shape.
Where he goes astray is in his proposed solution. He thinks more centralized power in Brussels (the headquarters of the European Union) is the key to faster growth.
The solution to Europe’s woes can be summarized in one line — a deeper, more united, more strategic Europe. But that solution means, inevitably, more power to the European Union.
I wrote in 2014, 2017, and 2020 about how free markets and limited government have produced amazing results in Singapore.
Let’s revisit that country and we’ll start with this video from the Fraser Institute.
Since the video explains that Singapore emphasized growth, let’s compared the United States and Singapore over the past six decade based on Maddison data.
As you can see, Singapore did a great job of converging with America and now it’s doing an even-better job of diverging.
An article in this week’s Economist lauds Singapore amazing success.
Here are some excerpts.
Singapore has become a beacon of prosperity. In a part of the world where middle-income status is the norm, the city-state is now the richest country for many thousands of miles in any direction. At around $88,000, its GDP per person has doubled in real terms over the past 20 years. At the moment of its independence in 1965, the country was poorer on the same basis than South Africa or Jordan. …During the past two decades, the median wage for Singaporean residents in full-time work has risen by 43% in real terms, compared with an 8% rise in America. At around $46,000 in dollar terms, the median full-time wages of Singaporeans are now higher than those in Britain, the country’s former colonial boss, where they sit at around $44,000.
Since the article mentions that Singapore used to be poorer than South Africa and Jordan, I can’t resist pointing out that Singapore used to be as poor as Jamaica.
So why is Singapore now one of the world’s richest nations?
According to Economic Freedom of the World, it has the world’s most market-oriented policies, including total free trade and minuscule levels of red tape.
And more economic liberty is strongly correlated with more national prosperity.
Let’s close with some analysis of Singaporean fiscal policy. Notice that Singapore gets its worst score on size of government, ranking #49.
Yet IMF data shows that the burden of government spending in Singapore is impressively low, with the public sector consuming less than 14 percent of the economy’s output.
So how can Singapore only rank #49 on fiscal policy when it has a very small fiscal burden?
The answer is that the government owns non-trivial chunks of the economy. And even though the video explains that Singapore requires government-owned companies to be efficient, the Fraser Institute correctly lowers the nation’s score for that deviation from laissez-faire policy.
The bottom line is that even a very well-governed nation may have a slice of socialism!
P.S. Hong Kong has now fallen well behind Singapore.
The good news is that there is very little risk that President’s new budget – which is very similar to his previousbudgets – will be approved by Congress.
The bad news is that his budget is filled with terrible policy. Big expansions in the burden of spending and big increases in tax rates.
At the risk of understatement, the economic consequences of those policies would be unfortunate.
Given my interest in competitiveness, I think this visual from the Tax Foundation is the most important thing to understand. Biden wants tax rates in the United States to go from dark blue to light blue.
What makes this visual so disappointing is when you compare tax rates in the United States to other industrialized nations.
Tax rates in America already are high compared to those other countries, especially when looking at the taxation of saving and investment.
But the most shocking results are when you compare tax rates in other nations to Biden’s proposed tax rates. The United States would be shooting itself in the foot.
Given those terrible policies, this set of numbers from the Tax Foundation is hardly a surprise. Government would get more money and households would lose money.
I’ll close by observing that the Tax Foundation’s model is based on how higher tax rates discourage productive behavior. And there’s lots of academic evidence to support that approach.
As far as I know, though, the Tax Foundation does not quantify or estimate the economic damage from higher spending. So the actual consequences of Biden’s proposed budget surely would be even worse (the case for smaller government is bolstered by research from the Congressional Budget Office, as well as from generally left-leaning international bureaucracies such as the OECD, World Bank, ECB, and IMF).
Their Prosperity Index, for instance, uses some common-sense variables such as per-capita economic output, but it also is based in part on mis-measured variables such as years of education rather than actual education achievement.
Worst of all, there is an inequality variable. And to give you an idea of why that’s methodological garbage, the U.S. score would increase if all rich Americans were exiled even though that would mean a big drop in per-capita GDP.
You may think I’m being pedantic or ideological, but here’s some real-world evidence to show you why the Atlantic Council’s analysis is laughably misguided.
This chart shows IMF data on per-capita GDP. You can see the United States on the right, way ahead of the other nations with more than $80,000 of economic output per person.
What do all the other countries have in common, besides having much-lower levels of per-capita GDP? They all score higher than the United States in the Atlantic Council’s Prosperity Index.
Reminds me of the dodgy analysis from the OECD that asserted that poverty was higher in the United States than in nations such as Portugal, Greece, Turkey, Hungary, Mexico, and Poland.
P.S. One other thing I would correct in the video was the discussion of Romania. Yes, Romania is now much richer today than it was in 1950.
But simply showing the difference between living standards in 1950 and today obscures the very important fact that the vast bulk of the improvement came after Romania escaped communist slavery.
I’ve written lots of columns comparing Texas and California (see here, here, here, here, here, here, here and here), and also several columns comparing Florida and New York (see here, here, here, here, and here).
We’ll break from that pattern today because we’re going to compare Florida and California, motivated by tonight’s Fox TV debate between Gov. Ron DeSantis and Gov. Gavin Newsom.
We’ll start with this table put together by Peter Coy of the New York Times. If Florida won, I awarded a red star and if California won, I awarded a blue star (and no stars if there was a tie or the category was irrelevant).
Florida won the most categories, though California has higher income (but also a much-higher cost of living).
Here’s a table prepared by the Committee to Unleash Prosperity. No need to add any stars since Florida wins every category.
I’ll close with a few excerpts from an editorial by the Wall Street Journal.
Gavin Newsom and Ron DeSantis are set to square off…in a Fox News debate… Besides offering voters a look of the alternatives to Joe Biden and Donald Trump, the showdown between the California and Florida governors could provide a revealing policy contrast. Sacramento has rushed to the left in recent decades while Tallahassee has moved to the right. Since winning election in 2018, Messrs. Newsom and DeSantis have advanced sharply different policies on Covid lockdowns, taxes, school choice and climate regulation, among other things. …here is a scorecard of policy results. …Since January 2019, employment has increased by 1,031,030 in Florida while declining by 85,438 in California. …California’s 4.8% jobless rate is the second highest in the country and nearly twice as high as Florida’s (2.8%). …State and local taxes in California add up to $10,167 per capita versus $5,406 in Florida. …Despite its higher taxes, California boasted a $31.5 billion budget shortfall in May while Florida ran a $17.7 billion surplus.
Based on the data, DeSantis has already won the debate.
Though messaging and style matter in politics, so we’ll see what happens in tonight’s debate.
P.S. We’ll make this column Part V of our series on red states vs blue states (previous editions available here, here, here, and here).