| CARVIEW |
The post Python Typing Survey 2025: Code Quality and Flexibility As Top Reasons for Typing Adoption appeared first on Engineering at Meta.
]]>Who Responded?
The survey was initially distributed on official social media accounts by the survey creators, and subsequently shared organically across further platforms including Reddit, email newsletters, Mastodon, LinkedIn, Discord, and Twitter. When respondents were asked which platform they heard about the survey from, Reddit emerged as the most effective channel, but significant engagement also came from email newsletters and Mastodon, reflecting the diverse spaces where Python developers connect and share knowledge.
The respondent pool was predominantly composed of developers experienced with Python and typing. Nearly half reported over a decade of Python experience, and another third had between five and 10 years. While there was representation from newcomers, the majority of participants brought substantial expertise to their responses. Experience with type hints was similarly robust, with most respondents having used them for several years and only a small minority indicating no experience with typing.
Typing Adoption and Attitudes
The survey results reveal that Python’s type hinting system has become a core part of development for most engineers. An impressive 86% of respondents report that they “always” or “often” use type hints in their Python code, a figure that remains consistent with last year’s Typed Python survey.
For the first time this year the survey also asked participants to indicate how many years of experience they have with Python and with Python typing. We found that adoption of typing is similar across all experience levels, but there are some interesting nuances:
- Developers with 5–10 years of Python experience are the most enthusiastic adopters, with 93% reporting regularly using type hints.
- Among the most junior developers (0–2 years of experience), adoption is slightly lower at 83%. Possible reasons for this could be the learning curve for newcomers (repeatedly mentioned in later survey questions).
- For senior developers (10+ years of experience), adoption was the lowest of all cohorts, with only 80% reporting using them always or often. Reasons for this drop are unclear, it could reflect more experienced python developers having gotten used to writing Python without type hints before they were supported, or possibly they are more likely to work on larger or legacy codebases that are difficult to migrate.
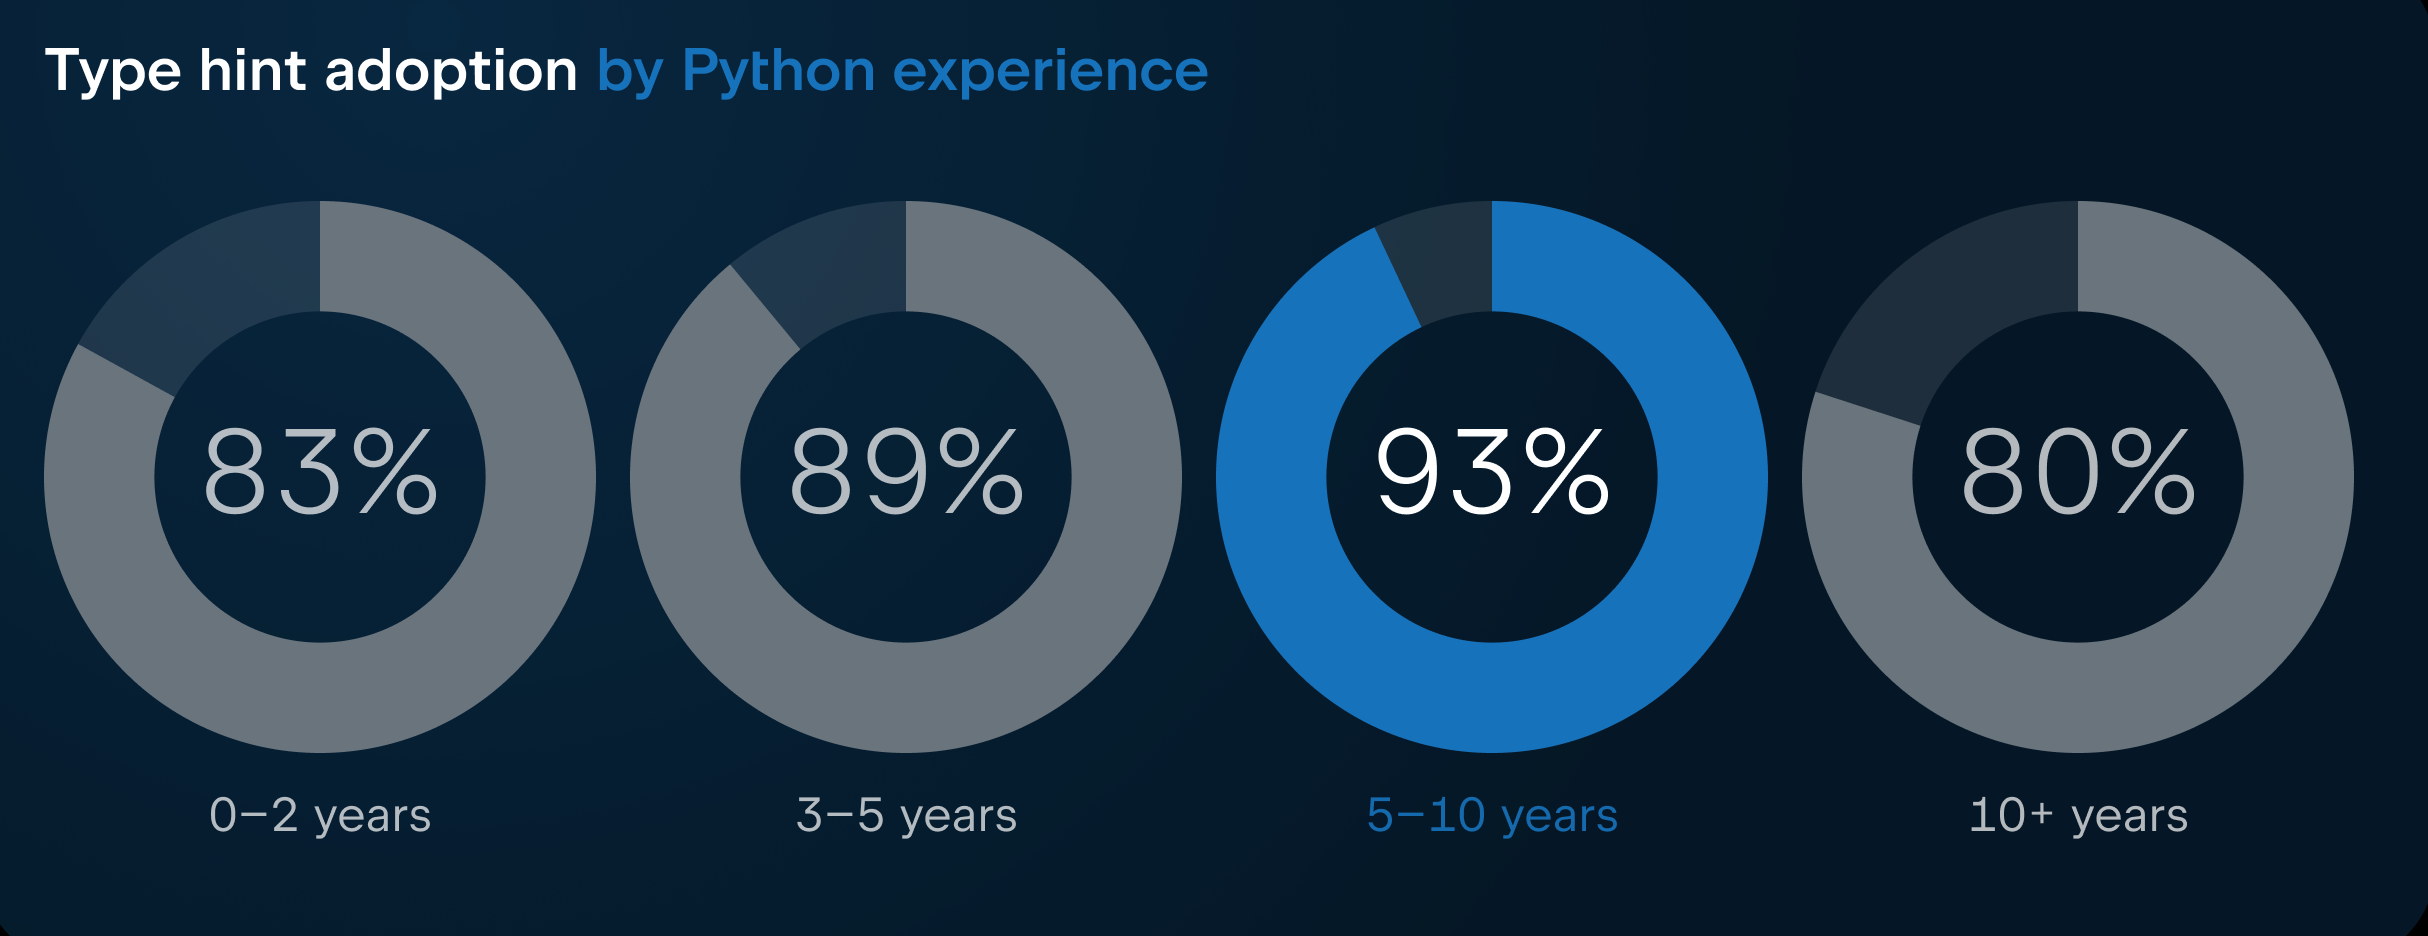
Overall, the data shows that type hints are widely embraced by the Python community, with strong support from engineers at all experience levels. However, we should note there may be some selection bias at play here, as it’s possible developers who are more familiar with types and use them more often are also more likely to be interested in taking a survey about it.
Why Developers Love Python Typing
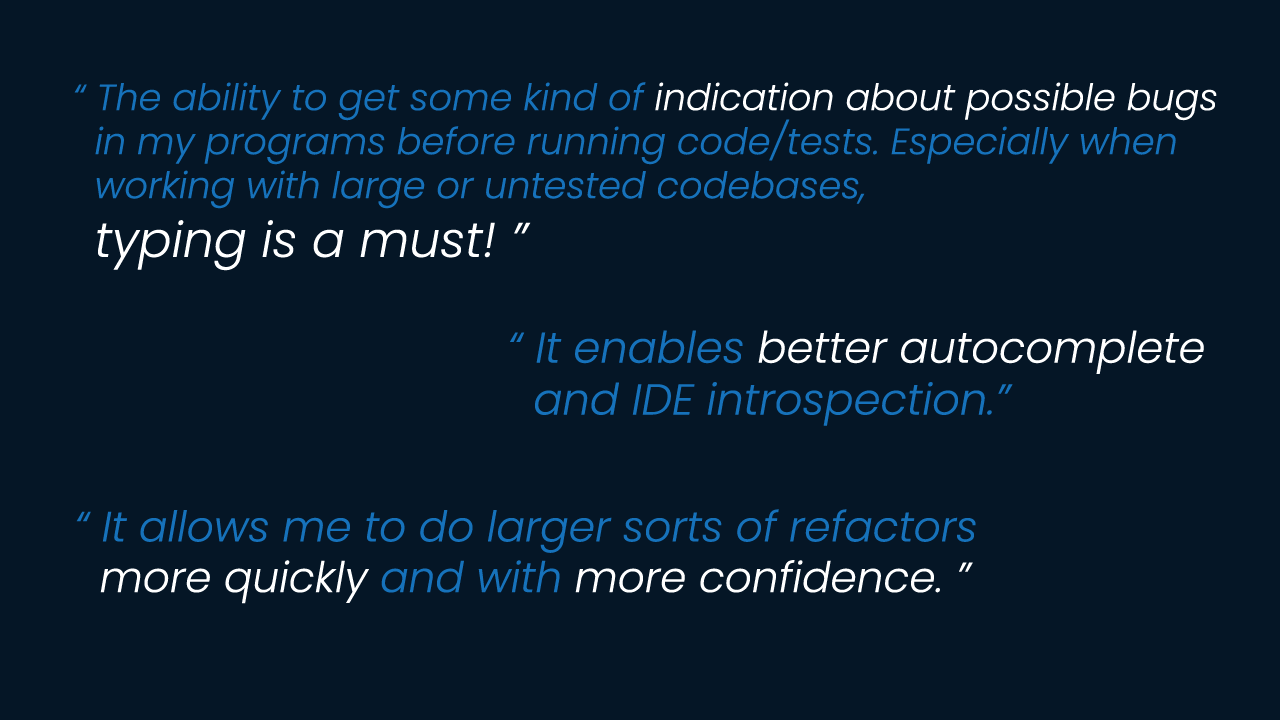
When asked what developers loved about the Python type system there were some mixed reactions, with a number of responses just stating, “nothing” (note this was an optional question). This indicates the presence of some strong negative opinions towards the type system among a minority of Python users. The majority of responses were positive, with the following themes emerging prominently:
- Optionality and Gradual Adoption: The optional nature of the type system and the ability to adopt it incrementally into existing projects are highly valued, allowing flexibility in development.
- Improved Readability and Documentation: Type hints serve as in-code documentation, making code clearer and easier to read, understand, and reason about for both the author and other developers, especially in larger codebases.
- Enhanced Tooling and IDE Support: The type system significantly improves IDE features like autocomplete/IntelliSense, jump-to-definition, and inline type hints, leading to a better developer experience.
- Bug Prevention and Code Correctness: It helps catch errors and subtle bugs earlier during development or refactoring, increasing confidence and leading to more robust and reliable code.
- Flexibility and Features: Respondents appreciate the flexibility, expressiveness, and powerful features of the system, including protocols, generics (especially the new syntax), and the ability to inspect annotations at runtime for use with libraries like Pydantic/FastAPI.
Challenges and Pain Points
In addition to assessing positive sentiment towards Python typing, we also asked respondents what challenges and pain points they face. With over 800 responses to the question, “What is the hardest part about using the Python type system?” the following themes were identified:
- Third-Party Library/Framework Support: Many respondents cited the difficulty of integrating types with untyped, incomplete, or incorrect type annotations in third-party libraries (e.g., NumPy, Pandas, Django).
- Complexity of Advanced Features: Advanced concepts such as generics, TypeVar (including co/contravariance), callables/decorators, and complex/nested types were frequently mentioned as difficult to understand or express.
- Tooling and Ecosystem Fragmentation: The ecosystem is seen as chaotic, with inconsistencies between different type checkers (like Mypy and Pyright), slow performance of tools like Mypy, and a desire for an official, built-in type checker.
- Lack of Enforcement and Runtime Guarantees: The fact that typing is optional and is not enforced at runtime or by the Python interpreter makes it harder to convince others to use it, enforce its consistent use, and fully trust the type hints.
- Verbosity and Code Readability: The necessary type hints, especially for complex structures, can be verbose, make the code less readable, and feel non-Pythonic.
- Dealing with Legacy/Dynamic Code: It is hard to integrate typing into old, untyped codebases, particularly when they use dynamic Python features that do not play well with static typing.
- Type System Limitations and Evolution: The type system is perceived as incomplete or less expressive than languages like TypeScript, and its rapid evolution means syntax and best practices are constantly changing.
Most Requested Features
A little less than half of respondents had suggestions for what they thought was missing from the Python type system, the most commonly requested features being:
- Missing Features From TypeScript and Other Languages: Many respondents requested features inspired by TypeScript, such as Intersection types (like the & operator), Mapped and Conditional types, Utility types (like Pick, Omit, keyof, and typeof), and better Structural typing for dictionaries/dicts (e.g., more flexible TypedDict or anonymous types).
- Runtime Type Enforcement and Performance: A significant number of developers desire optional runtime type enforcement or guarantees, as well as performance optimizations (JIT/AOT compilation) based on the type hints provided.
- Better Generics and Algebraic Data Types (ADTs): Requests include features like higher-kinded types (HKT), improved support for TypeVarTuple (e.g., bounds and unpacking), better generics implementation, and official support for algebraic data types (e.g., Result, Option, or Rust-like enums/sum types).
- Improved Tooling, Consistency, and Syntax: Developers asked for an official/built-in type checker that is fast and consistent, a less verbose syntax for common patterns like nullable types (? instead of | None) and callables, and better support/documentation for complex types (like nested dicts, NumPy/Pandas arrays).
- Handling of Complex/Dynamic Patterns: Specific missing capabilities include better support for typing function wrappers/decorators (e.g., using ParamSpec effectively), being able to type dynamic attributes (like those added by Django/ORMs), and improved type narrowing and control flow analysis.
Tooling Trends
The developer tooling landscape for Python typing continues to evolve, with both established and emerging tools shaping how engineers work.
Mypy remains the most widely used type checker, with 58% of respondents reporting using it. While this represents a slight dip from 61% in last year’s survey, Mypy still holds a dominant position in the ecosystem. At the same time, new Rust-based type checkers like Pyrefly, Ty, and Zuban are quickly gaining traction, now used by over 20% of survey participants collectively.
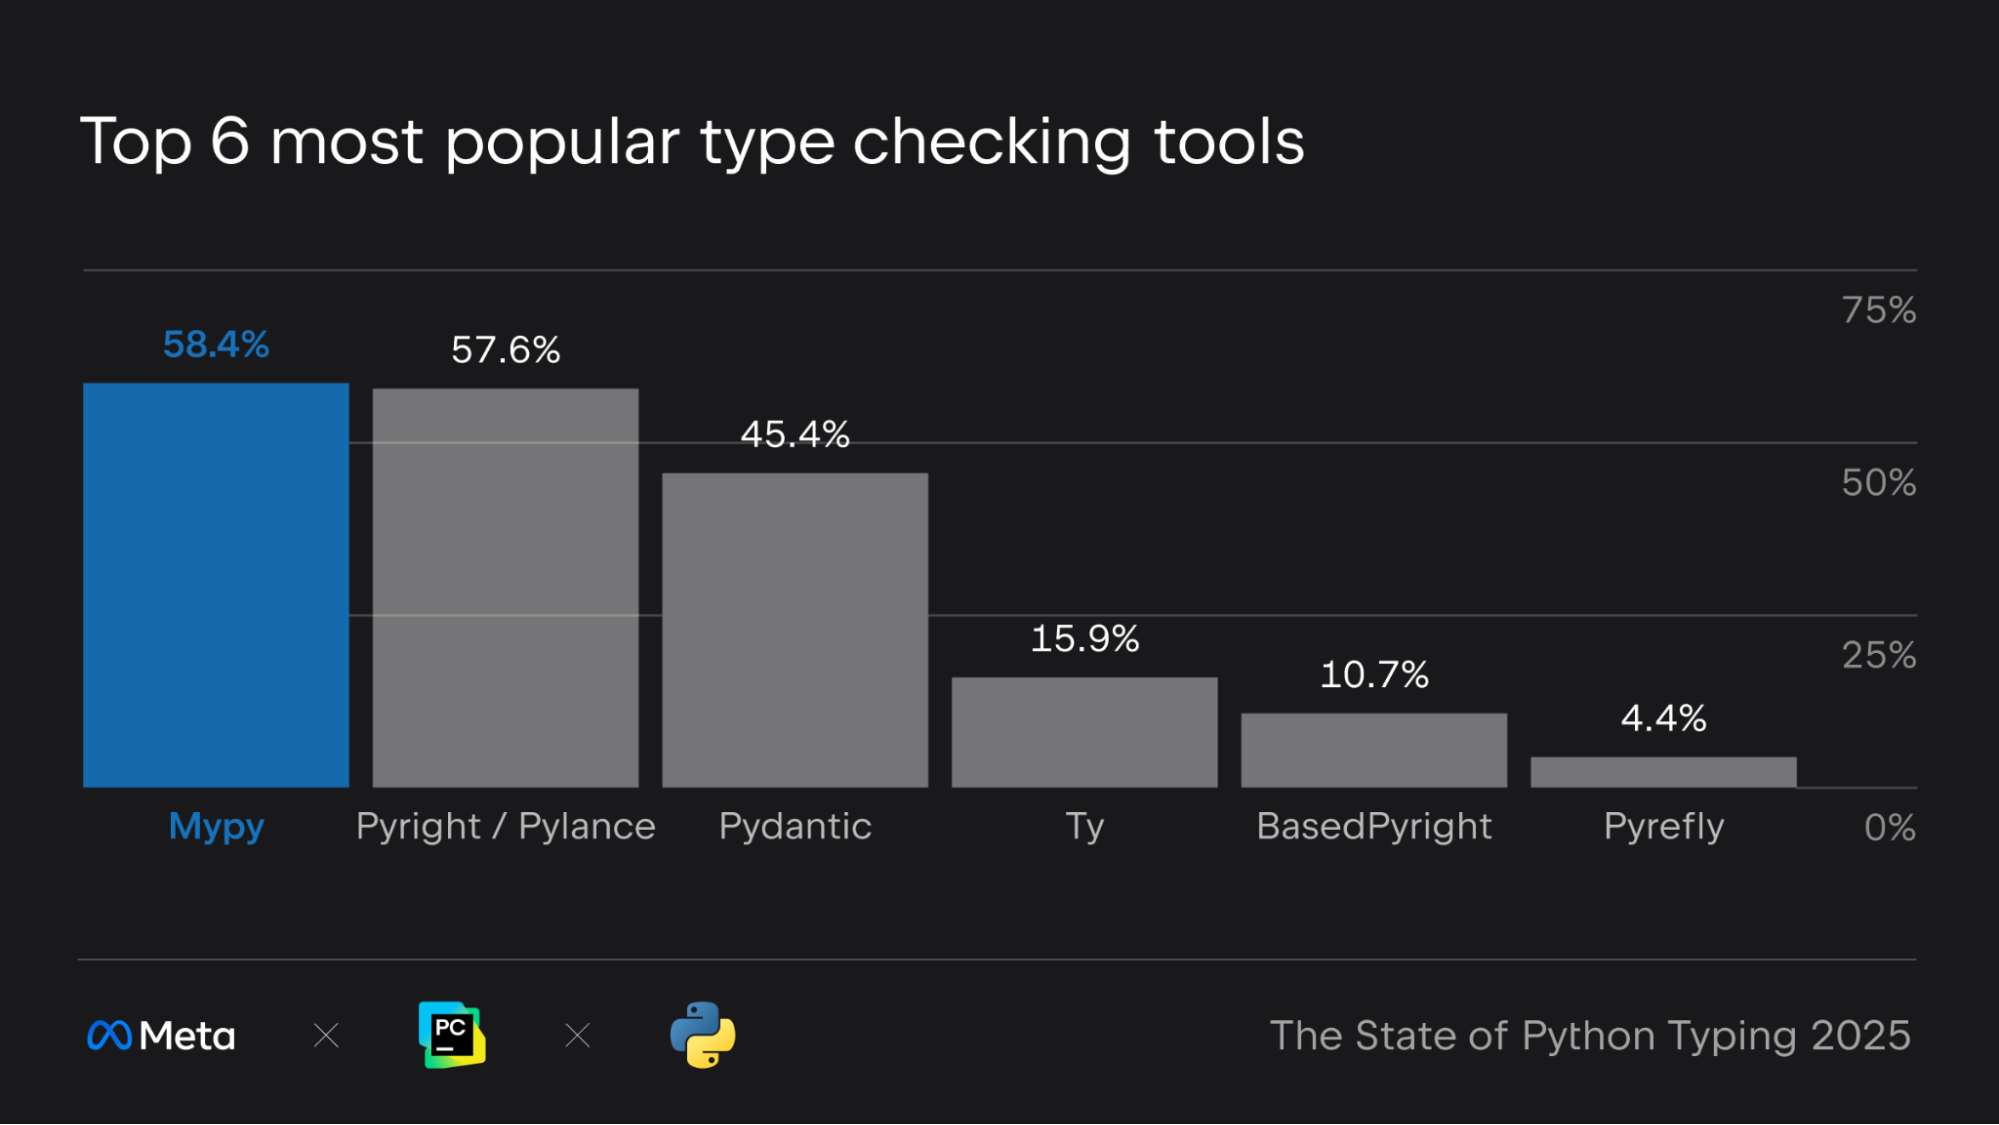
When it comes to development environments, VS Code leads the pack as the most popular IDE among Python developers, followed by PyCharm and (Neo)vim/vim. The use of type checking tools within IDEs also mimics the popularity of the IDE themselves, with VS Code’s default (Pylance/Pyright) and PyCharm’s built-in support being the first and third most popular options respectively.
How Developers Learn and Get Help
When it comes to learning about Python typing and getting help, developers rely on a mix of official resources, community-driven content, and AI-powered tools, a similar learning landscape to what we saw in last year’s survey.
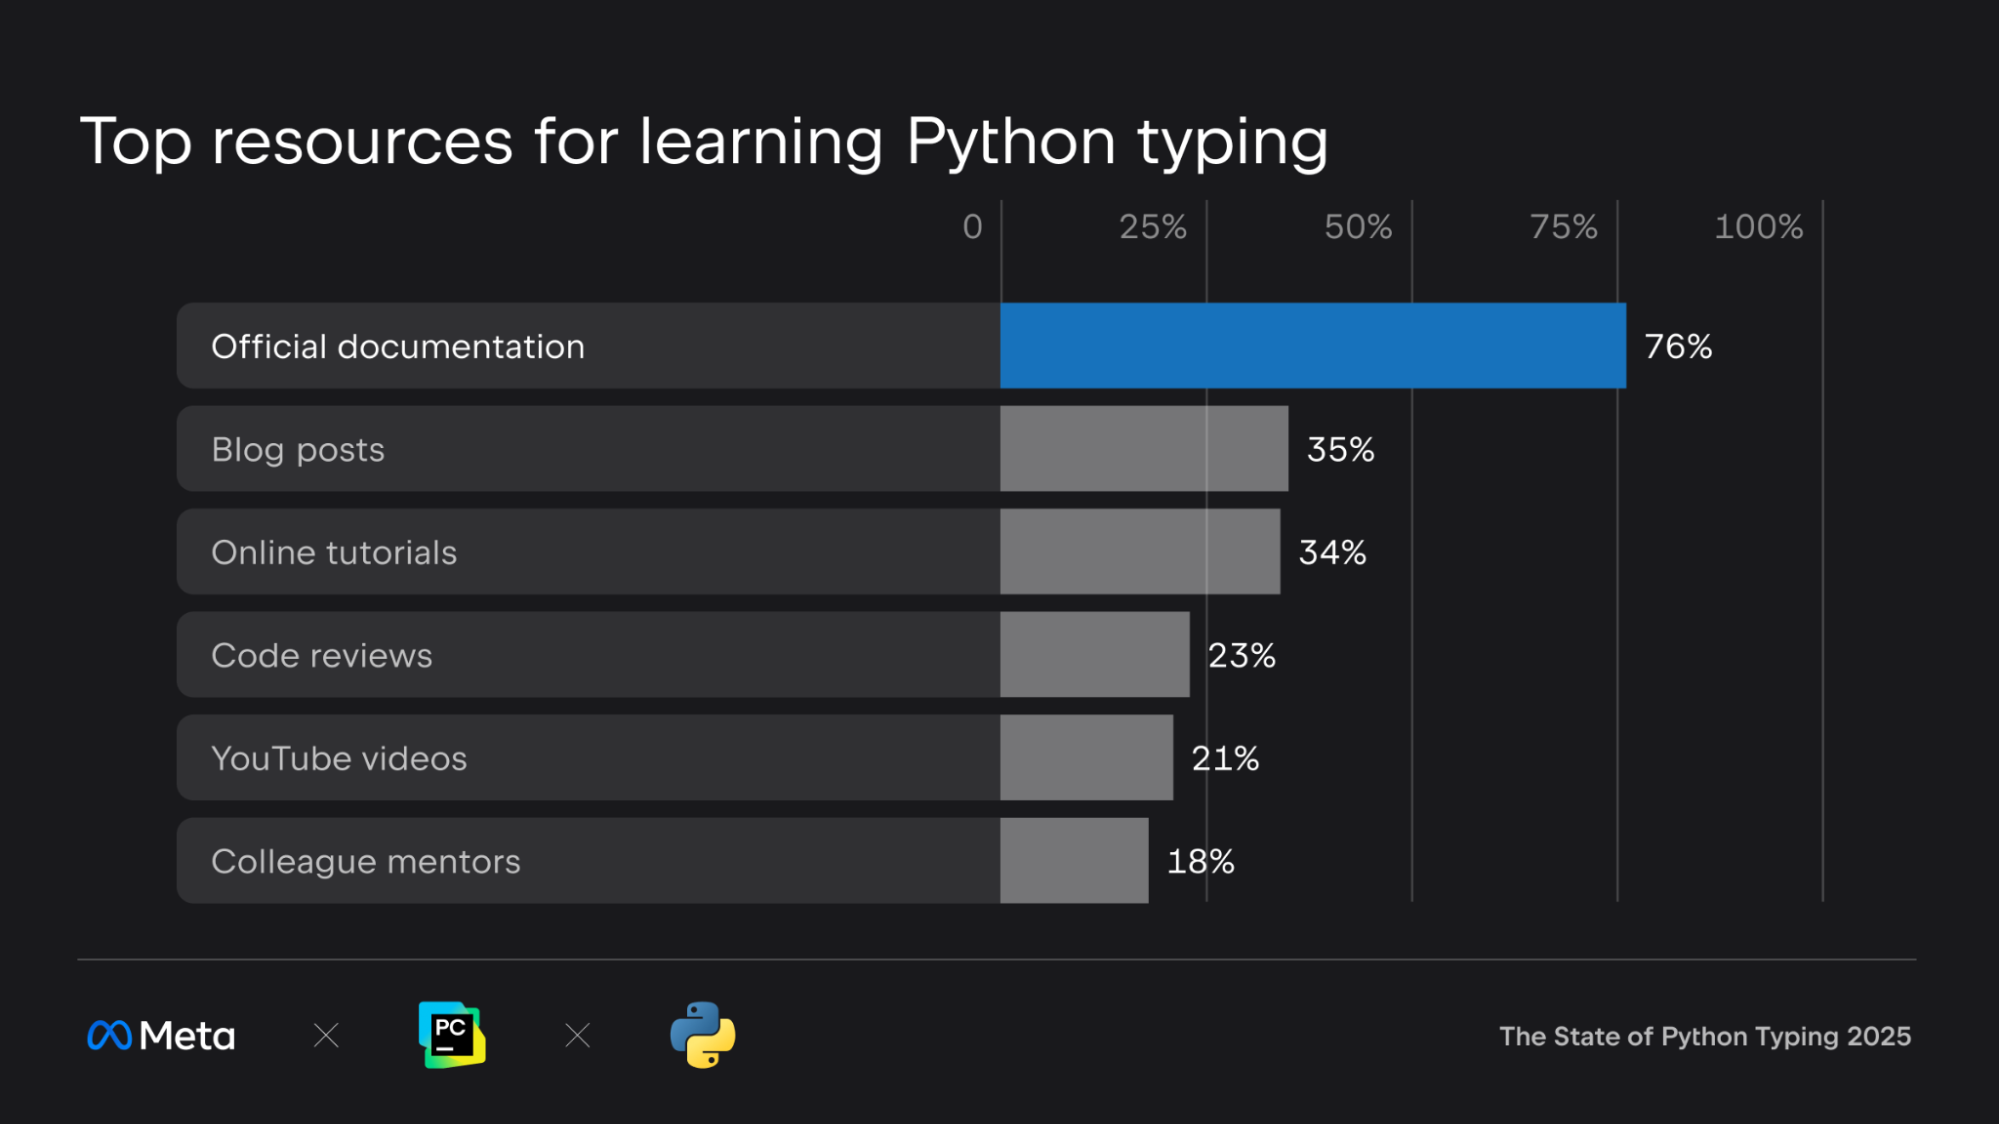
Official documentation remains the go-to resource for most developers. The majority of respondents reported learning about Python typing through the official docs, with 865 citing it as their primary source for learning and 891 turning to it for help. Python’s dedicated typing documentation and type checker-specific docs are also heavily used, showing that well-maintained, authoritative resources are still highly valued.
Blog posts have climbed in popularity, now ranking as the second most common way developers learn about typing, up from third place last year. Online tutorials, code reviews, and YouTube videos also play a significant role.
Community platforms are gaining traction as sources for updates and new features. Reddit, in particular, has become a key channel for discovering new developments in the type system, jumping from fifth to third place as a source for news. Email newsletters, podcasts, and Mastodon are also on the rise.
Large language models (LLMs) are now a notable part of the help-seeking landscape. Over 400 respondents reported using LLM chat tools, and nearly 300 use in-editor LLM suggestions when working with Python typing.
Opportunities and Next Steps
The 2025 Python Typing Survey highlights the Python community’s sustained adoption of typing features and tools to support their usage. It also points to clear opportunities for continued growth and improvement, including:
- Increasing library coverage: One of the most consistent requests from the community is for broader and deeper type annotation coverage in popular libraries. Expanding type hints across widely used packages will make static typing more practical and valuable for everyone.
- Improving documentation: While official documentation remains the top resource, there’s a strong appetite for more discoverable and accessible learning materials. Leveraging channels like newsletters, blog posts, and Reddit can help surface new features, best practices, and real-world examples to a wider audience.
- Clarify tooling differences: The growing variety of type checkers and tools is a sign of a healthy ecosystem, but can also reflect a lack of consensus/standardisation and can be confusing for users. There’s an opportunity to drive more consistency between tools or provide clearer guidance on their differences and best-fit use cases.
To learn more about Meta Open Source, visit our website, subscribe to our YouTube channel, or follow us on Facebook, Threads, X, Bluesky and LinkedIn.
Acknowledgements
This survey ran from 29th Aug to 16th Sept 2025 and received 1,241 responses in total.
Thanks to everyone who participated! The Python typing ecosystem continues to evolve, and your feedback helps shape its future.
Also, special thanks to the Jetbrains PyCharm team for providing the graphics used in this piece.
The post Python Typing Survey 2025: Code Quality and Flexibility As Top Reasons for Typing Adoption appeared first on Engineering at Meta.
]]>The post DrP: Meta’s Root Cause Analysis Platform at Scale appeared first on Engineering at Meta.
]]>DrP is a root cause analysis (RCA) platform, designed by Meta, to programmatically automate the investigation process, significantly reducing the mean time to resolve (MTTR) for incidents and alleviating on-call toil
Today, DrP is used by over 300 teams at Meta, running 50,000 analyses daily, and has been effective in reducing MTTR by 20-80%
By understanding DrP and its capabilities, we can unlock new possibilities for efficient incident resolution and improved system reliability.
What It Is
DrP is an end-to-end platform that automates the investigation process for large-scale systems. It addresses the inefficiencies of manual investigations, which often rely on outdated playbooks and ad-hoc scripts. These traditional methods can lead to prolonged downtimes and increased on-call toil as engineers spend countless hours triaging and debugging incidents.
DrP offers a comprehensive solution by providing an expressive and flexible SDK to author investigation playbooks, known as analyzers. These analyzers are executed by a scalable backend system, which integrates seamlessly with mainstream workflows such as alerts and incident management tools. Additionally, DrP includes a post-processing system to automate actions based on investigation results, such as mitigation steps.

DrP’s key components include:
- Expressive SDK: The DrP SDK allows engineers to codify investigation workflows into analyzers. It provides a rich set of helper libraries and machine learning (ML) algorithms for data access and problem isolation analysis, such as anomaly detection, event isolation, time series correlation and dimension analysis.
- Scalable backend: The backend system executes the analyzers, providing both multi-tenant and isolated execution environments. It ensures that analyzers can be run at scale, handling thousands of automated analyses per day.
- Integration with workflows: DrP integrates with alerting and incident management tools, allowing for the auto-triggering of analyzers on incidents. This integration ensures that investigation results are immediately available to on-call engineers.
- Post-processing system: After an investigation, the post-processing system can take automated actions based on the analysis results. For example, it can create tasks or pull requests to mitigate issues identified during the investigation.
How It Works
Authoring Workflow
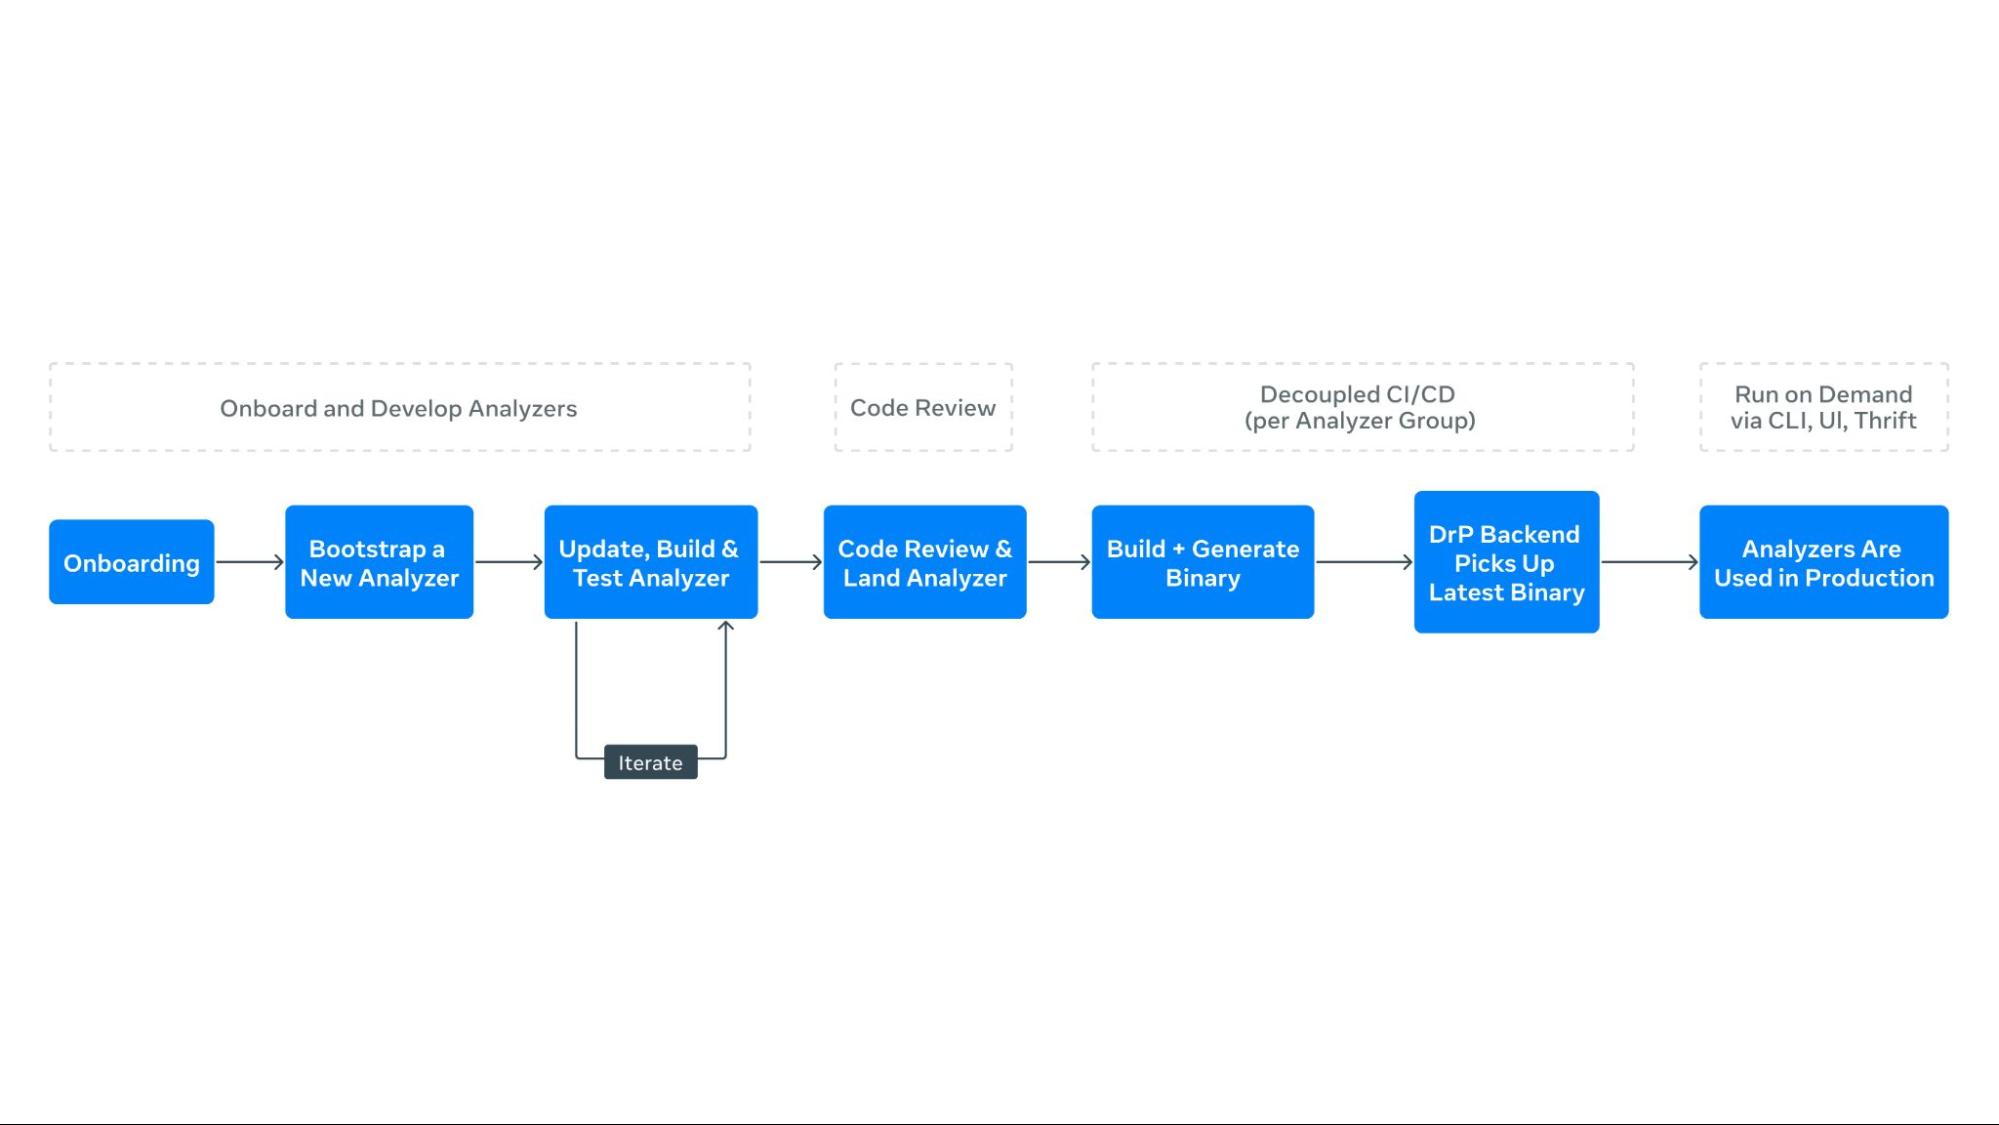
The process of creating automated playbooks, or analyzers, begins with the DrP SDK. Engineers enumerate the investigation steps, listing inputs and potential paths to isolate problem areas. The SDK provides APIs and libraries to codify these workflows, allowing engineers to capture all required input parameters and context in a type-safe manner.
- Enumerate investigation steps: Engineers start by listing the steps required to investigate an incident, including inputs and potential paths to isolate the problem.
- Bootstrap code: The DrP SDK provides bootstrap code to create a template analyzer with pre-populated boilerplate code. Engineers extend this code to capture all necessary input parameters and context.
- Data access and analysis: The SDK includes libraries for data access and analysis, such as dimension analysis and time series correlation. Engineers use these libraries to code the main investigation decision tree into the analyzer.
- Analyzer chaining: For dependent service analysis, the SDK’s APIs allow for seamless chaining of analyzers, passing context and obtaining outputs.
- Output and post-processing: The output method captures findings from the analysis, using special data structures for both text and machine-readable formats. Post-processing methods automate actions based on analyzer findings.
Once created, analyzers are tested and sent for code review. DrP offers automated backtesting integrated into code review tools, ensuring high-quality analyzers before deployment.
Consumption Workflow
In production, analyzers integrate with tools like UI, CLI, alerts, and incident management systems. Analyzers can automatically trigger upon alert activation, providing immediate results to on-call engineers and improving response times. The DrP backend manages a queue for requests and a worker pool for secure execution, with results returning asynchronously.
- Integration with alerts: DrP is integrated with alerting systems, allowing analyzers to trigger automatically when an alert is activated. This provides immediate analysis results to on-call engineers.
- Execution and monitoring: The backend system manages a queue for analyzer requests and a worker pool for execution. It monitors execution, ensuring that analyzers run securely and efficiently.
- Post-processing and insights: A separate post-processing system handles analysis results, annotating alerts with findings. The DrP Insights system periodically analyzes outputs to identify and rank top alert causes, aiding teams in prioritizing reliability improvements.
Why It Matters
Reducing MTTR
DrP has demonstrated significant improvements in reducing MTTR across various teams and use cases. By automating manual investigations, DrP enables faster triage and mitigation of incidents, leading to quicker system recovery and improved availability.
- Efficiency: Automated investigations reduce the time engineers spend on manual triage, allowing them to focus on more complex tasks. This efficiency translates to faster incident resolution and reduced downtime.
- Consistency: By codifying investigation workflows into analyzers, DrP ensures consistent and repeatable investigations. This consistency reduces the likelihood of errors and improves the reliability of incident resolution.
- Scalability: DrP can handle thousands of automated analyses per day, making it suitable for large-scale systems with complex dependencies. Its scalability ensures that it can support the needs of growing organizations.
Enhancing On-Call Productivity
The automation provided by DrP reduces the on-call effort during investigations, saving engineering hours and reducing on-call fatigue. By automating repetitive and time-consuming steps, DrP allows engineers to focus on more complex tasks, improving overall productivity.
Scalability and Adoption
DrP has been successfully deployed at scale at Meta, covering over 300 teams and 2000 analyzers, executing 50,000 automated analyses per day. Its integration into mainstream workflows, such as alerting systems, has facilitated widespread adoption and demonstrated its value in real-world scenarios.
- Widespread adoption: DrP has been adopted by hundreds of teams across various domains, demonstrating its versatility and effectiveness in addressing diverse investigation needs.
- Proven impact: DrP has been in production for over five years, with proven results in reducing MTTR and improving on-call productivity. Its impact is evident in the positive feedback received from users and the significant improvements in incident resolution times.
- Continuous improvement: DrP is continuously evolving, with ongoing enhancements to its ML algorithms, SDK, backend system, and integrations. This commitment to continuous improvement ensures that DrP remains a cutting-edge solution for incident investigations, while its growing adoption across teams enables existing workflows and analyzers to be reused by others, compounding the shared knowledge base and making it increasingly valuable across the organization.
What’s Next
Looking ahead, DrP aims to evolve into an AI-native platform, playing a central role in advancing Meta’s broader AI4Ops vision, enabling more powerful and automated investigations. This transformation will enhance analysis by delivering more accurate and insightful results, while also simplifying the user experience through streamlined ML algorithms, SDKs, UI, and integrations facilitating effortless authoring and execution of analyzers.
Read the Paper
DrP: Meta’s Efficient Investigations Platform at Scale
Acknowledgements
We wish to thank contributors to this effort across many teams throughout Meta
Team – Eduardo Hernandez, Jimmy Wang, Akash Jothi, Kshitiz Bhattarai, Shreya Shah, Neeru Sharma, Alex He, Juan-Pablo E, Oswaldo R, Vamsi Kunchaparthi, Daniel An, Rakesh Vanga, Ankit Agarwal, Narayanan Sankaran, Vlad Tsvang, Khushbu Thakur, Srikanth Kamath, Chris Davis, Rohit JV, Ohad Yahalom, Bao Nguyen, Viraaj Navelkar, Arturo Lira, Nikolay Laptev, Sean Lee, Yulin Chen
Leadership – Sanjay Sundarajan, John Ehrhardt, Ruben Badaro, Nitin Gupta, Victoria Dudin, Benjamin Renard, Gautam Shanbhag, Barak Yagour, Aparna Ramani
The post DrP: Meta’s Root Cause Analysis Platform at Scale appeared first on Engineering at Meta.
]]>The post How We Built Meta Ray-Ban Display: From Zero to Polish appeared first on Engineering at Meta.
]]>Kenan and Emanuel, from Meta’s Wearables org, join Pascal Hartig on the Meta Tech Podcast to talk about all the unique challenges of designing game-changing wearable technology, from the unique display technology to emerging UI patterns for display glasses.
You’ll also learn what particle physics and hardware design have in common and how to celebrate even the incremental wins in a fast-moving culture.
Download or listen to the episode below:
You can also find the episode wherever you get your podcasts, including:
The Meta Tech Podcast is a podcast, brought to you by Meta, where we highlight the work Meta’s engineers are doing at every level – from low-level frameworks to end-user features.
Send us feedback on Instagram, Threads, or X.
And if you’re interested in learning more about career opportunities at Meta visit the Meta Careers page.
The post How We Built Meta Ray-Ban Display: From Zero to Polish appeared first on Engineering at Meta.
]]>The post How AI Is Transforming the Adoption of Secure-by-Default Mobile Frameworks appeared first on Engineering at Meta.
]]>Sometimes functions within operating systems or provided by third parties come with a risk of misuse that could compromise security. To mitigate this, we wrap or replace these functions using our own secure-by-default frameworks. These frameworks play an important role in helping our security and software engineers maintain and improve the security of our codebases while maintaining developer speed.
But implementing these frameworks comes with practical challenges, like design tradeoffs. Building a secure framework on top of Android APIs, for example, requires a thoughtful balance between security, usability, and maintainability.
With the emergence of AI-driven tools and automation we can scale the adoption of these frameworks across Meta’s large codebase. AI can assist in identifying insecure usage patterns, suggesting or automatically applying secure framework replacements and continuously monitoring compliance. This not only accelerates migration but also ensures consistent security enforcement at scale.
Together, these strategies empower our development teams to ship well-secured software efficiently, safeguarding user data and trust while maintaining high developer productivity across Meta’s vast ecosystem.
How We Design Secure-by-Default Frameworks at Meta
Designing secure-by-default frameworks for use by a large number of developers shipping vastly different features across multiple apps is an interesting challenge. There are a lot of competing concerns such as discoverability, usability, maintainability, performance, and security benefits.
Practically speaking, developers only have a finite amount of time to code each day. The goal of our frameworks is to improve product security while being largely invisible and friction-free to avoid slowing developers down unnecessarily. This means that we have to correctly balance all those competing concerns discussed above. If we strike the wrong balance, some developers could avoid using our frameworks, which could reduce our ability to prevent security vulnerabilities.
For example, if we design a framework that improves product security in one area but introduces three new concepts and requires developers to provide five additional pieces of information per call site, some app developers may try to find a way around using them. Conversely, if we provide these same frameworks that are trivially easy to use, but they consume noticeable amounts of CPU and RAM, some app developers may, again, seek ways around using them, albeit for different reasons.
These examples might seem a bit obvious, but they are taken from real experiences over the last 10+ years developing ~15 secure-by-default frameworks targeting Android and iOS. Over that time, we’ve established some best practices for designing and implementing these new frameworks.
To the maximum extent possible, an effective framework should embody the following principles:
- The secure framework API should resemble the existing API. This reduces the cognitive burden on framework users, forces security framework developers to minimize the complexity of the changes, and makes it easier to perform automated code conversion from the insecure to secure API usage.
- The framework should itself be built on public and stable APIs. APIs from OS vendors and third parties change all the time, especially the non-public ones. Even if access to those APIs is technically allowed in some cases, building on top of private APIs is a recipe for constant fire drills (best case) and dead-end investment in frameworks that simply can’t work with newer versions of operating systems and libraries (worst case).
- The framework should cover the maximum number of application users, not security use cases. There shouldn’t be one security framework that covers all security issues, and not every security issue is general enough to deserve its own framework. However, each security framework should be usable across all apps and OS versions for a particular platform. Small libraries are faster to build and deploy, and easier to maintain and explain to app developers.
Now that we’ve looked at the design philosophy behind our frameworks, let’s look at one of our most widely used Android security frameworks, SecureLinkLauncher.
SecureLinkLauncher: Preventing Android Intent Hijacking
SecureLinkLauncher (SLL) is one of our widely-used secure frameworks. SLL is designed to prevent sensitive data from spilling through the Android intents system. It exemplifies our approach to secure-by-default frameworks by wrapping native Android intent launching methods with scope verification and security checks, preventing common vulnerabilities such as intent hijacking without sacrificing developer velocity or familiarity.
The system consists of intent senders and intent receivers. SLL is targeted to intent senders.
SLL offers a semantic API that closely mirrors the familiar Android Context API for launching intents, including methods like startActivity() and startActivityForResult(). Instead of invoking the potentially insecure Android API directly, such as context.startActivity(intent);, developers use SecureLinkLauncher with a similar method call pattern, for example, SecureLinkLauncher.launchInternalActivity(intent, context);. Internally, SecureLinkLauncher delegates to the stable Android startActivity() API, ensuring that all intent launches are securely verified and protected by the framework.
public void launchInternalActivity(Intent intent, Context context) {
   // Verify that the target activity is internal (same package)
   if (!isInternalActivity(intent, context)) {
       throw new SecurityException("Target activity is not internal");
   }
   // Delegate to Android's startActivity to launch the intent
   context.startActivity(intent);
}
Similarly, instead of calling context.startActivityForResult(intent, code); directly, developers use SecureLinkLauncher.launchInternalActivityForResult(intent, code, context);. SecureLinkLauncher (SLL) wraps Android’s startActivity() and related methods, enforcing scope verification before delegating to the native Android API. This approach provides security by default while preserving the familiar Android intent launching semantics.
One of the most common ways that data is spilled through intents is due to incorrect targeting of the intent. As an example, following intent isn’t targeting a specific package. This means it can be received by any app with a matching <intent-filter>. While the intention of the developer might be that their Intent ends up in the Facebook app based on the URL, the reality is that any app, including a malicious application, could add an <intent-filter> that handles that URL and receive the intent.
Intent intent = new Intent(FBLinks.PREFIX + "profile");
intent.setExtra(SECRET_INFO, user_id);
startActivity(intent);
// startActivity can’t ensure who the receiver of the intent would be
In the example below, SLL ensures that the intent is directed to one of the family apps, as specified by the developer’s scope for implicit intents. Without SLL, these intents can resolve to both family and non-family apps,potentially exposing SECRET_INFO to third-party or malicious apps on the user’s device. By enforcing this scope, SLL can prevent such information leaks.
SecureLinkLauncher.launchFamilyActivity(intent, context);
// launchFamilyActivity would make sure intent goes to the meta family apps
In a typical Android environment, two scopes – internal and external – might seem sufficient for handling intents within the same app and between different apps. However, Meta’s ecosystem is unique, comprising multiple apps such as Facebook, Instagram, Messenger, WhatsApp, and their variants (e.g., WhatsApp Business). The complexity of inter-process communication between these apps demands more nuanced control over intent scoping. To address this need, SLL provides a more fine-grained approach to intent scoping, offering scopes that cater to specific use cases:
- Family scope: Enables secure communication between Meta-owned apps, ensuring that intents are only sent from one Meta app to another.
- Same-key scope: Restricts intent sending to Meta apps signed with the same key (not all Meta apps are signed by the same key), providing an additional layer of security and trust.
- Internal scope: Restricts intent sending within the app itself.
- Third-party scope: Allows intents to be sent to third-party apps, while preventing them from being handled by Meta’s own apps.
By leveraging these scopes, developers can ensure that sensitive data is shared securely and intentionally within the Meta ecosystem, while also protecting against unintended or malicious access. SLL’s fine-grained intent scoping capabilities, which are built upon the secure-by-default framework principles discussed above, empower developers to build more robust and secure applications that meet the unique demands of Meta’s complex ecosystem.
Leveraging Generative AI To Deploy Secure-by-Default Frameworks at Scale
Adopting these frameworks in a large codebase is non-trivial. The main complexity is choosing the correct scope, as that choice relies on information that is not readily available at existing call sites. While one could imagine a deterministic analysis attempting to infer the scope based on dataflows, that would be a large undertaking. Furthermore, it would likely have some precision-scalability trade-off.
Instead, we explored using Generative AI for this case. AI can read the surrounding code and attempt to infer the scope based on variable names and comments surrounding the call site. While this approach isn’t always perfect, it doesn’t need to be. It just needs to provide good enough guesses, such that code owners can one-click accept suggested patches.
If the patches are correct in most cases, this is a big timesaver that enables efficient adoption of the framework. This complements our recent work on AutoPatchBench, a benchmark designed to evaluate AI-powered patch generators that leverage large language models (LLMs) to automatically recommend and apply security patches. Secure-by-default frameworks are a great example of the kinds of code modifications that an automatic patching system can apply to improve the security of a code base.
We’ve built a framework leveraging Llama as the core technology, which takes locations in the codebase that we want to migrate and suggests patches for code owners to accept:

Prompt Creation
The AI workflow starts with a call site we want to migrate including its file path and line number. The location is used to extract a code snippet from the code base. This means opening the file where the call site is present, copying 10-20 lines before and after the call site location, and pasting this into the prompt template that gives general instructions as to how to perform the migration. This description is very similar to what would be written as an onboarding guide to the framework for human engineers.
Generative AI
The prompt is then provided to a Llama model (llama4-maverick-17b-128e-instruct). The model is asked to output two things: the modified code snippet, where the call site has been migrated; and, optionally, some actions (like adding an import to the top of a file). The main purpose of actions is to work around the limitations of this approach where all code changes are not local and limited to the code snippet. Actions enable the model fix to reach outside the snippet for some limited, deterministic changes. This is useful for adding imports or dependencies, which are rarely local to the code snippet, but are necessary for the code to compile. The code snippet is then inserted back to the code base and any actions are applied.
Validation
Finally, we perform a series of validations on the code base. We run all of these with and without the AI changes and only report the difference:
- Lints: We run the linters again to confirm the lint issue was fixed and no new lint errors were introduced by the changes.
- Compiling: We compile and run tests covering the targeted file. This is not intended to catch all bugs (we rely on continuous integration for that), but give the AI some early feedback on its changes (such as compile errors).
- Formatting: The code is formatted to avoid formatting issues. We do not feed the formatting errors back to the AI.
If any errors arise during the validation, their error messages are included in the prompt (along with the “fixed” code snippet) and the AI is asked to try again. We repeat this loop five times and give up if no successful fix is created. If the validation succeeds, we submit a patch for human review.
Thoughtful Framework Design Meets Intelligent Automation
By adhering to core design principles such as providing an API that closely resembles existing OS patterns, relying solely on public and stable OS APIs, and designing frameworks that cover broad user bases rather than niche use cases, developers can create robust, secure-by-default features that integrate seamlessly into existing codebases.
These same design principles help us leverage AI for smoothly adopting frameworks at scale. While there are still challenges around the accuracy of generated code – for example, the AI choosing the incorrect scope, using incorrect syntax, etc., the internal feedback loop design allows the LLM to automatically move past easily solvable problems without human intervention, increasing scalability and reducing developer frustration.
Internally, this project helped prove that AI could be impactful for adopting security frameworks across a diverse codebase in a way that is minimally disruptive to our developers. There are now a variety of projects tackling similar problems across a variety of codebases and languages – including C/++ – using diverse models and validation techniques. We expect this trend to continue and accelerate in 2026 as developers become more comfortable with state of the art AI tools and the quality of code that they are capable of producing.
As our codebase grows and security threats become more sophisticated, the combination of thoughtful framework design and intelligent automation will be essential to protecting user data and maintaining trust at scale.
The post How AI Is Transforming the Adoption of Secure-by-Default Mobile Frameworks appeared first on Engineering at Meta.
]]>The post Zoomer: Powering AI Performance at Meta’s Scale Through Intelligent Debugging and Optimization appeared first on Engineering at Meta.
]]>At the scale that Meta’s AI infrastructure operates, poor performance debugging can lead to massive energy inefficiency, increased operational costs, and suboptimal hardware utilization across hundreds of thousands of GPUs. The fundamental challenge is achieving maximum computational efficiency while minimizing waste. Every percentage point of utilization improvement translates to significant capacity gains that can be redirected to innovation and growth.
Zoomer is Meta’s automated, one-stop-shop platform for performance profiling, debugging, analysis, and optimization of AI training and inference workloads. Since its inception, Zoomer has become the de-facto tool across Meta for GPU workload optimization, generating tens of thousands of profiling reports daily for teams across all of our apps.
Why Debugging Performance Matters
Our AI infrastructure supports large-scale and advanced workloads across a global fleet of GPU clusters, continually evolving to meet the growing scale and complexity of generative AI.
At the training level it supports a diverse range of workloads, including powering models for ads ranking, content recommendations, and GenAI features.
At the inference level, we serve hundreds of trillions of AI model executions per day.
Operating at this scale means putting a high priority on eliminating GPU underutilization. Training inefficiencies delay model iterations and product launches, while inference bottlenecks limit our ability to serve user requests at scale. Removing resource waste and accelerating workflows helps us train larger models more efficiently, serve more users, and reduce our environmental footprint.
AI Performance Optimization Using Zoomer
Zoomer is an automated debugging and optimization platform that works across all of our AI model types (ads recommendations, GenAI, computer vision, etc.) and both training and inference paradigms, providing deep performance insights that enable energy savings, workflow acceleration, and efficiency gains.
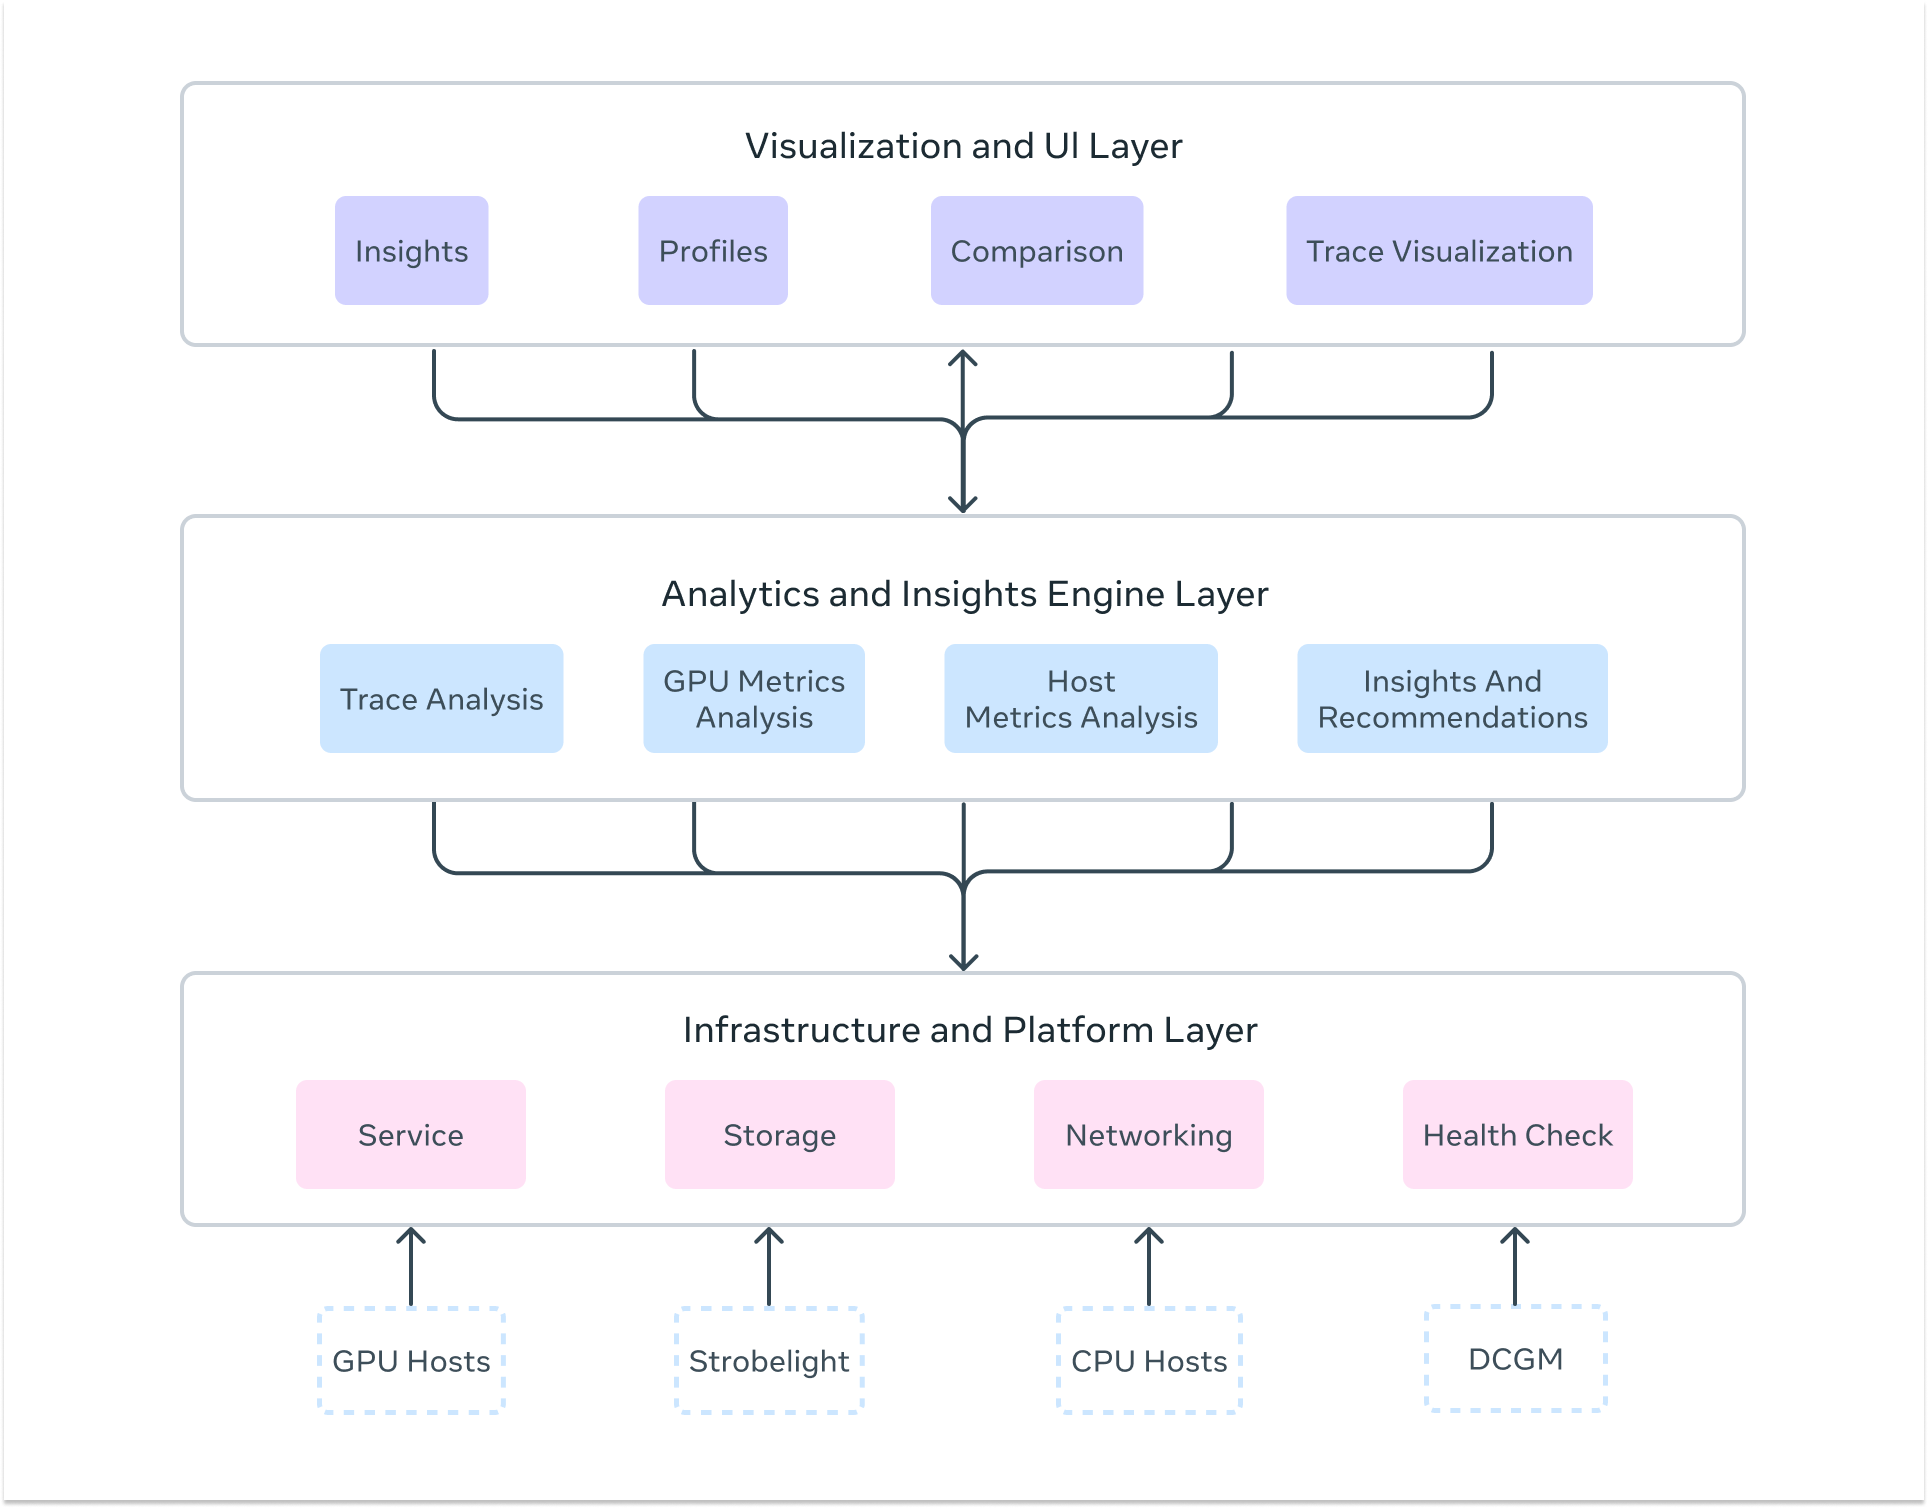
Zoomer’s architecture consists of three essential layers that work together to deliver comprehensive AI performance insights:
Infrastructure and Platform Layer
The foundation provides the enterprise-grade scalability and reliability needed to profile workloads across Meta’s massive infrastructure. This includes distributed storage systems using Manifold (Meta’s blob storage platform) for trace data, fault-tolerant processing pipelines that handle huge trace files, and low-latency data collection with automatic profiling triggers across thousands of hosts simultaneously. The platform maintains high availability and scale through redundant processing workers and can handle huge numbers of profiling requests during peak usage periods.
Analytics and Insights Engine
The core intelligence layer delivers deep analytical capabilities through multiple specialized analyzers. This includes: GPU trace analysis via Kineto integration and NVIDIA DCGM, CPU profiling through StrobeLight integration, host-level metrics analysis via dyno telemetry, communication pattern analysis for distributed training, straggler detection across distributed ranks, memory allocation profiling (including GPU memory snooping), request/response profiling for inference workloads, and much more. The engine automatically detects performance anti-patterns and also provides actionable recommendations.
Visualization and User Interface Layer
The presentation layer transforms complex performance data into intuitive, actionable insights. This includes interactive timeline visualizations showing GPU activity across thousands of ranks, multi-iteration analysis for long-running training workloads, drill-down dashboards with percentile analysis across devices, trace data visualization integrated with Perfetto for kernel-level inspection, heat map visualizations for identifying outliers across GPU deployments, and automated insight summaries that highlight critical bottlenecks and optimization opportunities.
How Zoomer Profiling Works: From Trigger to Insights
Understanding how Zoomer conducts a complete performance analysis provides insight into its sophisticated approach to AI workload optimization.
Profiling Trigger Mechanisms
Zoomer operates through both automatic and on-demand profiling strategies tailored to different workload types. For training workloads, which involve multiple iterations and can run for days or weeks, Zoomer automatically triggers profiling around iteration 550-555 to capture stable-state performance while avoiding startup noise. For inference workloads, profiling can be triggered on-demand for immediate debugging or through integration with automated load testing and benchmarking systems for continuous monitoring.
Comprehensive Data Capture
During each profiling session, Zoomer simultaneously collects multiple data streams to build a holistic performance picture:
- GPU Performance Metrics: SM utilization, GPU memory utilization, GPU busy time, memory bandwidth, Tensor Core utilization, power consumption, clock frequencies, and power consumption data via DCGM integration.
- Detailed Execution Traces: Kernel-level GPU operations, memory transfers, CUDA API calls, and communication collectives via PyTorch Profiler and Kineto.
- Host-Level Performance Data: CPU utilization, memory usage, network I/O, storage access patterns, and system-level bottlenecks via dyno telemetry.
- Application-Level Annotations: Training iterations, forward/backward passes, optimizer steps, data loading phases, and custom user annotations.
- Inference-Specific Data: Rate of inference requests, server latency, active requests, GPU memory allocation patterns, request latency breakdowns via Strobelight’s Crochet profiler, serving parameter analysis, and thrift request-level profiling.
- Communication Analysis: NCCL collective operations, inter-node communication patterns, and network utilization for distributed workloads
Distributed Analysis Pipeline
Raw profiling data flows through sophisticated processing systems that deliver multiple types of automated analysis including:
- Straggler Detection: Identifies slow ranks in distributed training through comparative analysis of execution timelines and communication patterns.
- Bottleneck Analysis: Automatically detects CPU-bound, GPU-bound, memory-bound, or communication-bound performance issues.
- Critical Path Analysis: Systematically identifies the longest execution paths to focus optimization efforts on highest-impact opportunities.
- Anti-Pattern Detection: Rule-based systems that identify common efficiency issues and generate specific recommendations.
- Parallelism Analysis: Deep understanding of tensor, pipeline, data, and expert parallelism interactions for large-scale distributed training.
- Memory Analysis: Comprehensive analysis of GPU memory usage patterns, allocation tracking, and leak detection.
- Load Imbalance Analysis: Detects workload distribution issues across distributed ranks and recommendations for optimization.
Multi-Format Output Generation
Results are presented through multiple interfaces tailored to different user needs: interactive timeline visualizations showing activity across all ranks and hosts, comprehensive metrics dashboards with drill-down capabilities and percentile analysis, trace viewers integrated with Perfetto for detailed kernel inspection, automated insights summaries highlighting key bottlenecks and recommendations, and actionable notebooks that users can clone to rerun jobs with suggested optimizations.
Specialized Workload Support
For massive distributed training for specialized workloads, like GenAI, Zoomer contains a purpose-built platform supporting LLM workloads that offers specialized capabilities including GPU efficiency heat maps and N-dimensional parallelism visualization. For inference, specialized analysis covers everything from single GPU models, soon expanding to massive distributed inference across thousands of servers.
A Glimpse Into Advanced Zoomer Capabilities
Zoomer offers an extensive suite of advanced capabilities designed for different AI workload types and scales. While a comprehensive overview of all features would require multiple blog posts, here’s a glimpse at some of the most compelling capabilities that demonstrate Zoomer’s depth:
Training Powerhouse Features:
- Straggler Analysis: Helps identify ranks in distributed training jobs that are significantly slower than others, causing overall job delays due to synchronization bottlenecks. Zoomer provides information that helps diagnose root causes like sharding imbalance or hardware issues.
- Critical Path Analysis: Identification of the longest execution paths in PyTorch applications, enabling accurate performance improvement projections.
- Advanced Trace Manipulation: Sophisticated tools for compression, filtering, combination, and segmentation of massive trace files (2GB+ per rank), enabling analysis of previously impossible-to-process large-scale training jobs
Inference Excellence Features:
- Single-Click QPS Optimization: A workflow that identifies bottlenecks and triggers automated load tests with one click, reducing optimization time while delivering QPS improvements of +2% to +50% across different models, depending on model characteristics.
- Request-Level Deep Dive: Integration with Crochet profiler provides Thrift request-level analysis, enabling identification of queue time bottlenecks and serving inefficiencies that traditional metrics miss.
- Realtime Memory Profiling: GPU memory allocation tracking, providing live insights into memory leaks, allocation patterns, and optimization opportunities.
GenAI Specialized Features:
- LLM Zoomer for Scale: A purpose-built platform supporting 100k+ GPU workloads with N-dimensional parallelism visualization, GPU efficiency heat maps across thousands of devices, and specialized analysis for tensor, pipeline, data, and expert parallelism interactions.
- Post-Training Workflow Support: Enhanced capabilities for GenAI post-training tasks including SFT, DPO, and ARPG workflows with generator and trainer profiling separation.
Universal Intelligence Features:
- Holistic Trace Analysis (HTA): Advanced framework for diagnosing distributed training bottlenecks across communication overhead, workload imbalance, and kernel inefficiencies, with automatic load balancing recommendations.
- Zoomer Actionable Recommendations Engine (Zoomer AR): Automated detection of efficiency anti-patterns with machine learning-driven recommendation systems that generate auto-fix diffs, optimization notebooks, and one-click job re-launches with suggested improvements.
- Multi-Hardware Profiling: Native support across NVIDIA GPUs, AMD MI300X, MTIA, and CPU-only workloads with consistent analysis and optimization recommendations regardless of hardware platform.
Zoomer’s Optimization Impact: From Debugging to Energy Efficiency
Performance debugging with Zoomer creates a cascading effect that transforms low-level optimizations into massive efficiency gains.
The optimization pathway flows from: identifying bottlenecks → improving key metrics → accelerating workflows → reducing resource consumption → saving energy and costs.
Zoomer’s Training Optimization Pipeline
Zoomer’s training analysis identifies bottlenecks in GPU utilization, memory bandwidth, and communication patterns.
Example of Training Efficiency Wins:
- Algorithmic Optimizations: We delivered power savings through systematic efficiency improvements across the training fleet, by fixing reliability issues for low efficiency jobs.
- Training Time Reduction Success: In 2024, we observed a 75% training time reduction for Ads relevance models, leading to 78% reduction in power consumption.
- Memory Optimizations: One-line code changes for performance issues due to inefficient memory copy identified by Zoomer, delivered 20% QPS improvements with minimal engineering effort.
Inference Optimization Pipeline:
Inference debugging focuses on latency reduction, throughput optimization, and serving efficiency. Zoomer identifies opportunities in kernel execution, memory access patterns, and serving parameter tuning to maximize requests per GPU.
Inference Efficiency Wins:
- GPU and CPU Serving parameters Improvements: Automated GPU and CPU bottleneck identification and parameter tuning, leading to 10% to 45% reduction in power consumption.
- QPS Optimization: GPU trace analysis used to boost serving QPS and optimize serving capacity.
Zoomer’s GenAI and Large-Scale Impact
For massive distributed workloads, even small optimizations compound dramatically. 32k GPU benchmark optimizations achieved 30% speedups through broadcast issue resolution, while 64k GPU configurations delivered 25% speedups in just one day of optimization.
The Future of AI Performance Debugging
As AI workloads expand in size and complexity, Zoomer is advancing to meet new challenges focused on several innovation fronts: broadening unified performance insights across heterogeneous hardware (including MTIA and next-gen accelerators), building advanced analyzers for proactive optimization, enabling inference performance tuning through serving param optimization, and democratizing optimization with automated, intuitive tools for all engineers. As Meta’s AI infrastructure continues its rapid growth, Zoomer plays an important role in helping us innovate efficiently and sustainably.
Acknowledgments
I would like to thank my entire team and our partner teams — Ganga Barani Balakrishnan, Qingyun Bian, Harshavardhan Reddy Bommireddy, Haibo Chen, Anubhav Chaturvedi, Wenbo Cui, Jon Dyer, Fatemeh Elyasi, Hrishikesh Gadre, Wenqin Huangfu, Arda Icmez, Amit Katti, Karthik Kambatla, Prakash KL, Raymond Li, Phillip Liu, Ya Liu, Majid Mashhadi, Abhishek Maroo, Paul Meng, Hassan Mousavi, Gil Nahmias, Manali Naik, Jackie Nguyen, Brian Mohammed Catraguna, Shiva Ramaswami, Shyam Sundar Chandrasekaran, Daylon Srinivasan, Sudhansu Singh, Michael Au-Yeung, Mengtian Xu, Zhiqiang Zang, Charles Yoon, John Wu, Uttam Thakore — for their dedication, technical excellence, and collaborative spirit in building Zoomer into the comprehensive AI profiling platform it is today.
I would also like to thank past team members and partners including Valentin Andrei, Brian Mohammed Catraguna, Patrick Lu, Majid Mashhadi, Chen Pekker, Wei Sun, Sreen Tallam, Chenguang Zhu — for laying the foundational vision and early technical contributions that made Zoomer’s evolution possible.
The post Zoomer: Powering AI Performance at Meta’s Scale Through Intelligent Debugging and Optimization appeared first on Engineering at Meta.
]]>The post Key Transparency Comes to Messenger appeared first on Engineering at Meta.
]]>End-to-end encryption on Messenger already ensures that the content of your direct messages and calls are protected from the moment they leave your device to the moment they reach the receiver’s device. As part of our end-to-end encrypted chat platform, we believe it’s also important that anyone can verify that the public keys (used by the sender’s device for encrypting each message) belong to the intended recipients and haven’t been tampered with.
This launch builds upon the valuable work and experiences shared by others in the industry. WhatsApp’s implementation of key transparency in 2023 demonstrated the feasibility of this technology for large-scale encrypted messaging. We’ve extended these pioneering efforts in our Messenger implementation to deliver a robust and reliable solution with similar security properties.
What Is Key Transparency?
Key transparency provides messaging users with a verifiable and auditable record of public keys. It allows them to confirm that their conversations are indeed encrypted with the correct keys for their contacts, and that these keys haven’t been maliciously swapped by a compromised server. This means you can be more confident that your messages are only accessible to the people you intend to communicate with.
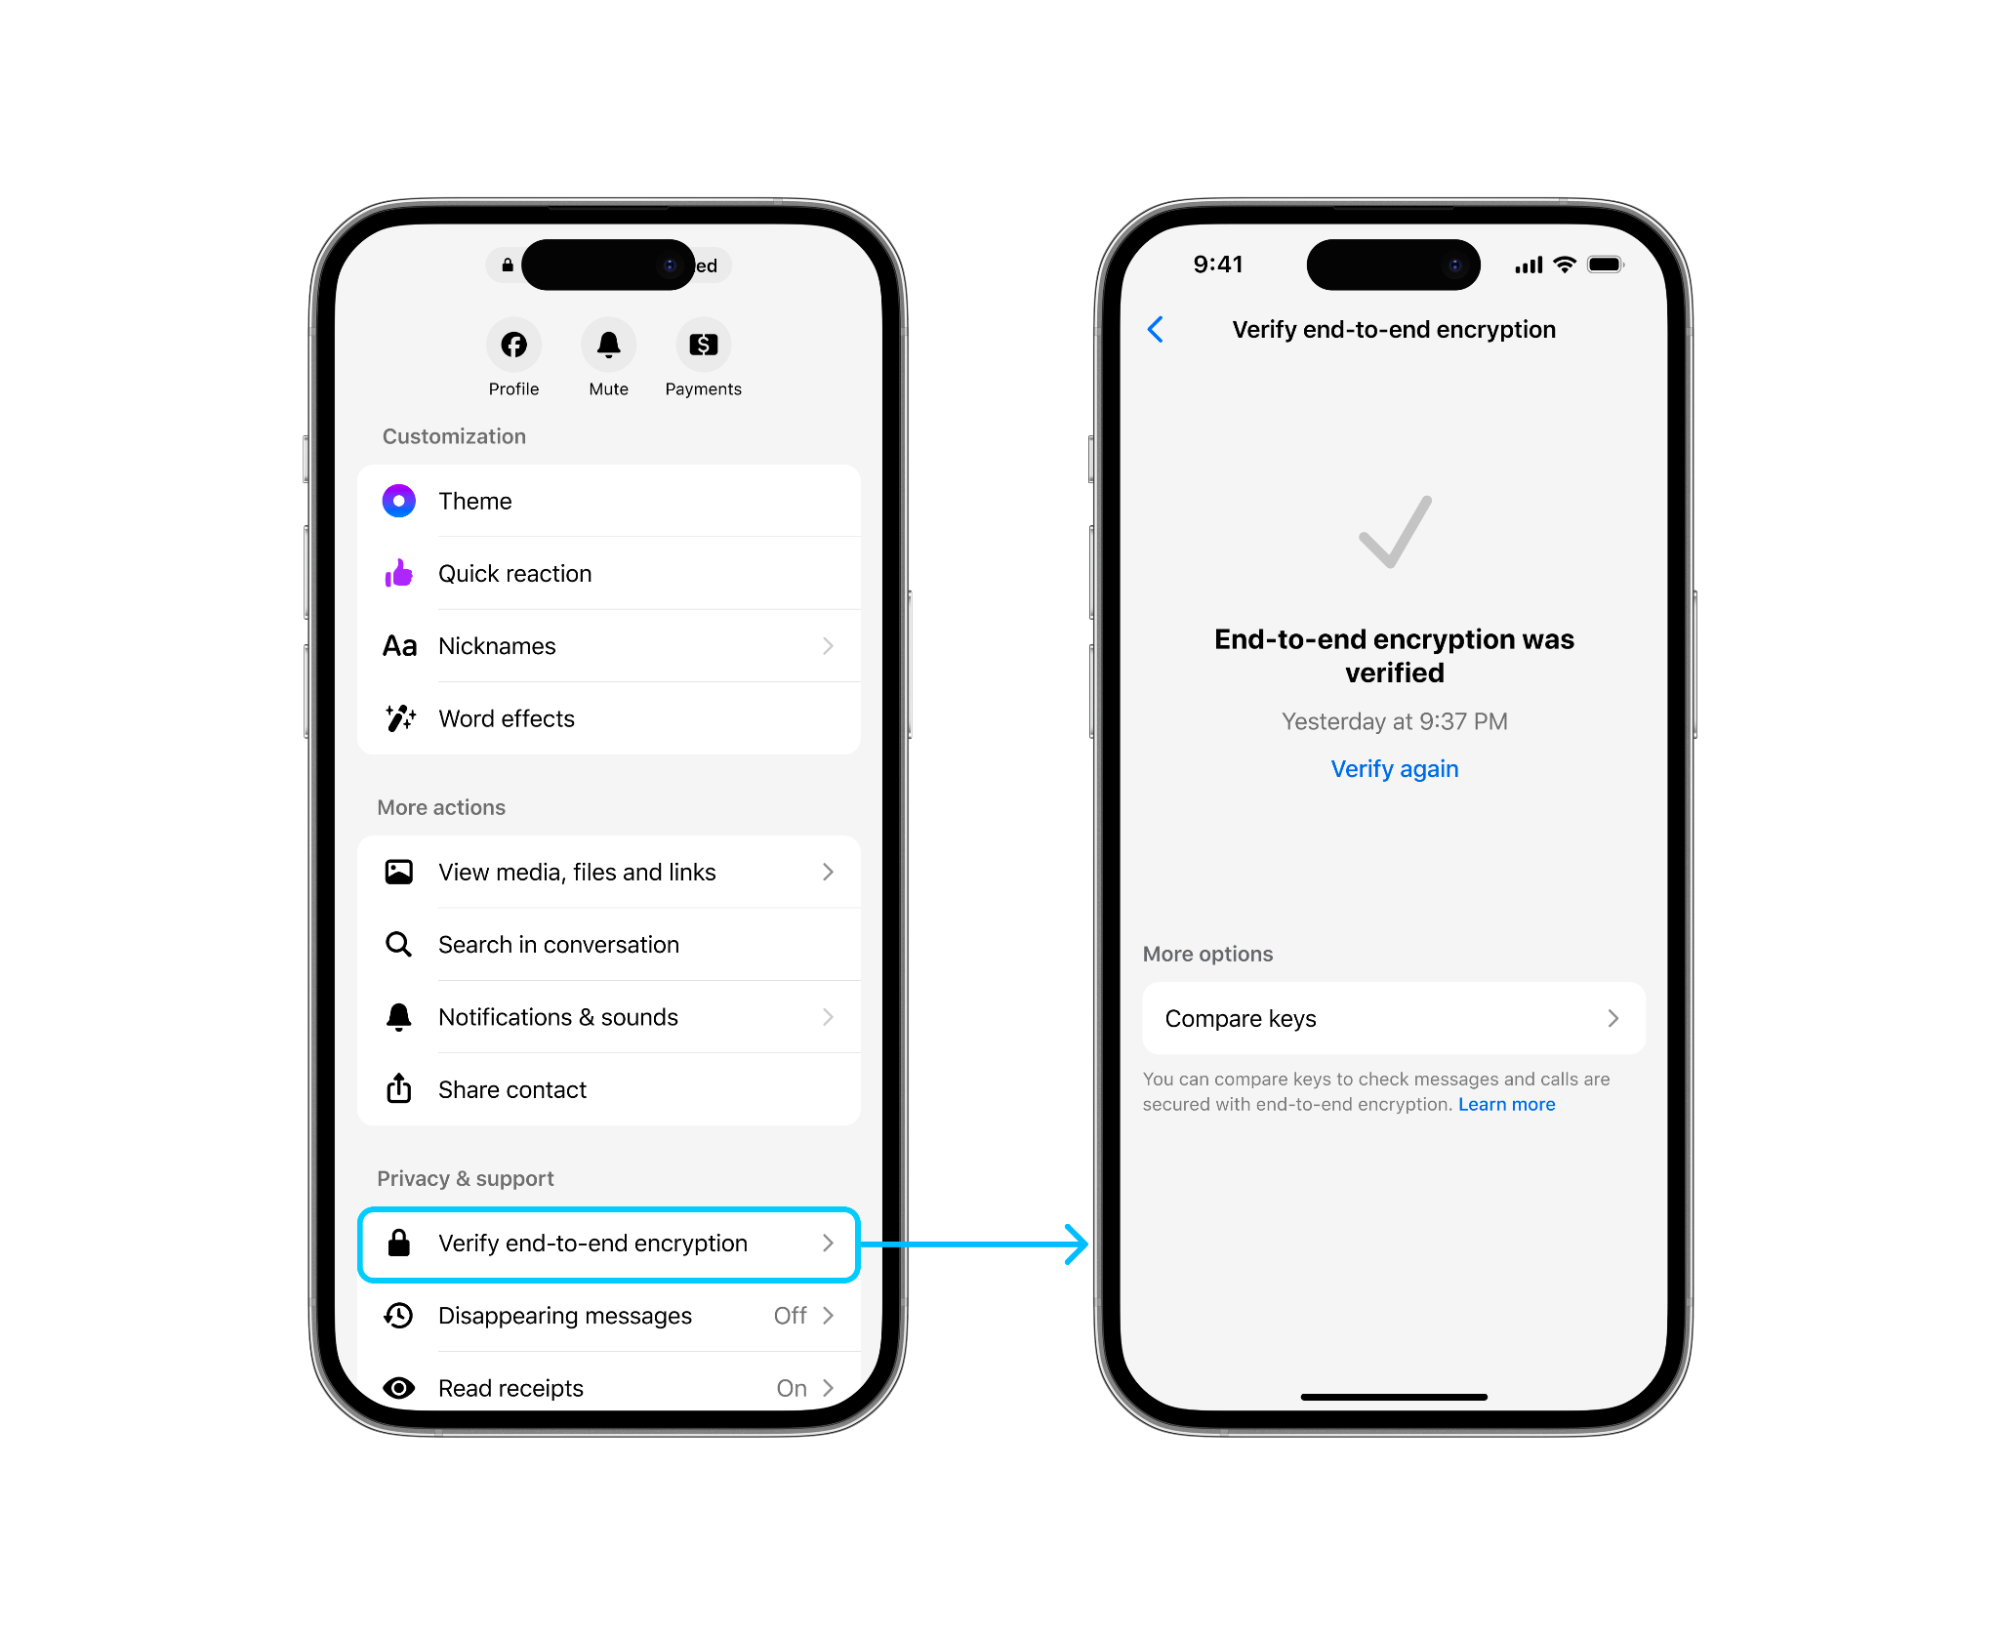
You can already check your keys for end-to-end encrypted chats on Messenger, but this can be cumbersome for people who have logged in to Messenger on multiple devices, each of which has its own key. Moreover, these keys change when new devices are added or are re-registered, which necessitates another check of the key every time this happens.
To address this, we’ve added a new security feature, based on key transparency, that allows users to verify these keys without having to compare them manually with their contacts. Of course, anyone who wishes to continue manually verifying their keys is free to do so.
How We’re Handling Messenger Keys at Scale
Our key transparency implementation leverages the Auditable Key Directory (AKD) library, mirroring the system already in place for WhatsApp. This system allows Meta to securely distribute and verify users’ public keys. To further enhance the security of this process, we use Cloudflare’s key transparency auditor to provide an additional layer of verification, ensuring that the distribution of keys is transparent and verifiable by anyone. Cloudflare’s auditor maintains a live log of the latest entries on the Key Transparency Dashboard, for both the WhatsApp and Messenger directories.
Implementing key transparency on the scale of Messenger presented unique engineering challenges. One significant factor was the sheer volume and frequency of key updates. Messenger indexes keys for each and every device someone has logged in on, which means that a single user often has multiple, frequently-changing keys associated with their account.
This increased complexity leads to a much higher frequency of key updates being sequenced into our key transparency directory. Currently, we’re observing an epoch frequency of approximately 2 minutes per publish, with hundreds of thousands of new keys added in each epoch. Since we began indexing, our database has already grown to billions of key entries. We’ve implemented a number of advancements in our infrastructure and libraries to help manage this massive and constantly growing dataset, while ensuring high availability and real-time verification:
We improved the algorithmic efficiency of the existing key lookup and verification operations in the AKD library by optimizing for smaller proof sizes, even as the number of updates (versions) for a single key grows. Previously, these proofs grew linearly with the height of the transparency tree, which was still difficult to manage given the number of nodes in the tree.
We also updated our existing infrastructure to be more resilient to temporary outages and improved the process for recovering from long delays in key sequencing. These improvements were adapted from lessons learned from running WhatsApp’s key transparency log for the past two years.
With key transparency now live on Messenger, users will have the ability to automatically verify the authenticity of their contacts’ encryption keys for one-on-one chats. This represents another step forward in our ongoing investment in providing a secure and private service.
Stay tuned for more updates as we continue to enhance the security and privacy of end-to-end encryption in Messenger.
The post Key Transparency Comes to Messenger appeared first on Engineering at Meta.
]]>The post Efficient Optimization With Ax, an Open Platform for Adaptive Experimentation appeared first on Engineering at Meta.
]]>How can researchers effectively understand and optimize AI models or systems that have a vast number of possible configurations? This is a challenge that is particularly prevalent in domains characterized by complex, interacting systems, such as modern AI development and deployment. Optimizing under these settings demands experimentation, and efficiency is of the utmost importance when evaluating a single configuration is extremely resource- and/or time-intensive.
Adaptive experimentation offers a solution to this problem by actively proposing new configurations for sequential evaluation, leveraging insights gained from previous evaluations
This year, we released version 1.0 of Ax, an open source adaptive experimentation platform that leverages machine learning to guide and automate the experimentation process. Ax employs Bayesian optimization to enable researchers and developers to conduct efficient experiments, identifying optimal configurations to optimize their systems and processes.
In conjunction with this major release, we published a paper titled, “Ax: A Platform for Adaptive Experimentation” that explores Ax’s core architecture, provides a deeper explanation of the methodology powering the optimization, and compares Ax’s performance against other black-box optimization libraries.
Ax has been successfully applied across various disciplines at Meta, including:
- Traditional machine learning tasks, such as hyperparameter optimization and architecture search.
- Addressing key challenges in GenAI, including discovering optimal data mixtures for training AI models.
- Tuning infrastructure or compiler flags in production settings.
- Optimizing design parameters in physical engineering tasks, such as designing AR/VR devices.
By utilizing Ax, developers can employ state-of-the-art methodology to conduct complex experiments, ultimately gaining a deeper understanding and optimizing their underlying systems.
How to Get Started With Ax
To start using Ax to efficiently tune parameters in complex systems install the latest version of the library via `pip install ax-platform` and visit the Ax website for a quickstart guide, tutorials, and deep dives on the methods that Ax uses under the hood.
Ax Is for Real World Experimentation
Adaptive experiments are incredibly useful, but can be challenging to run. Not only do these experiments require the use of sophisticated machine learning methods to drive the optimization, they also demand specialized infrastructure for managing experiment state, automating orchestration, providing useful analysis and diagnostics, and more. Additionally, the goals of any given experiment are often more complex than simply improving a single metric. In practice experimentation is usually a careful balance between multiple objective metrics subject to multiple constraints and guardrails.
We built Ax to empower users to easily configure and run these dynamic experiments using state-of-the-art techniques, and to provide a robust and mature platform for researchers to integrate cutting-edge methods directly into production systems.
Ax for Understanding
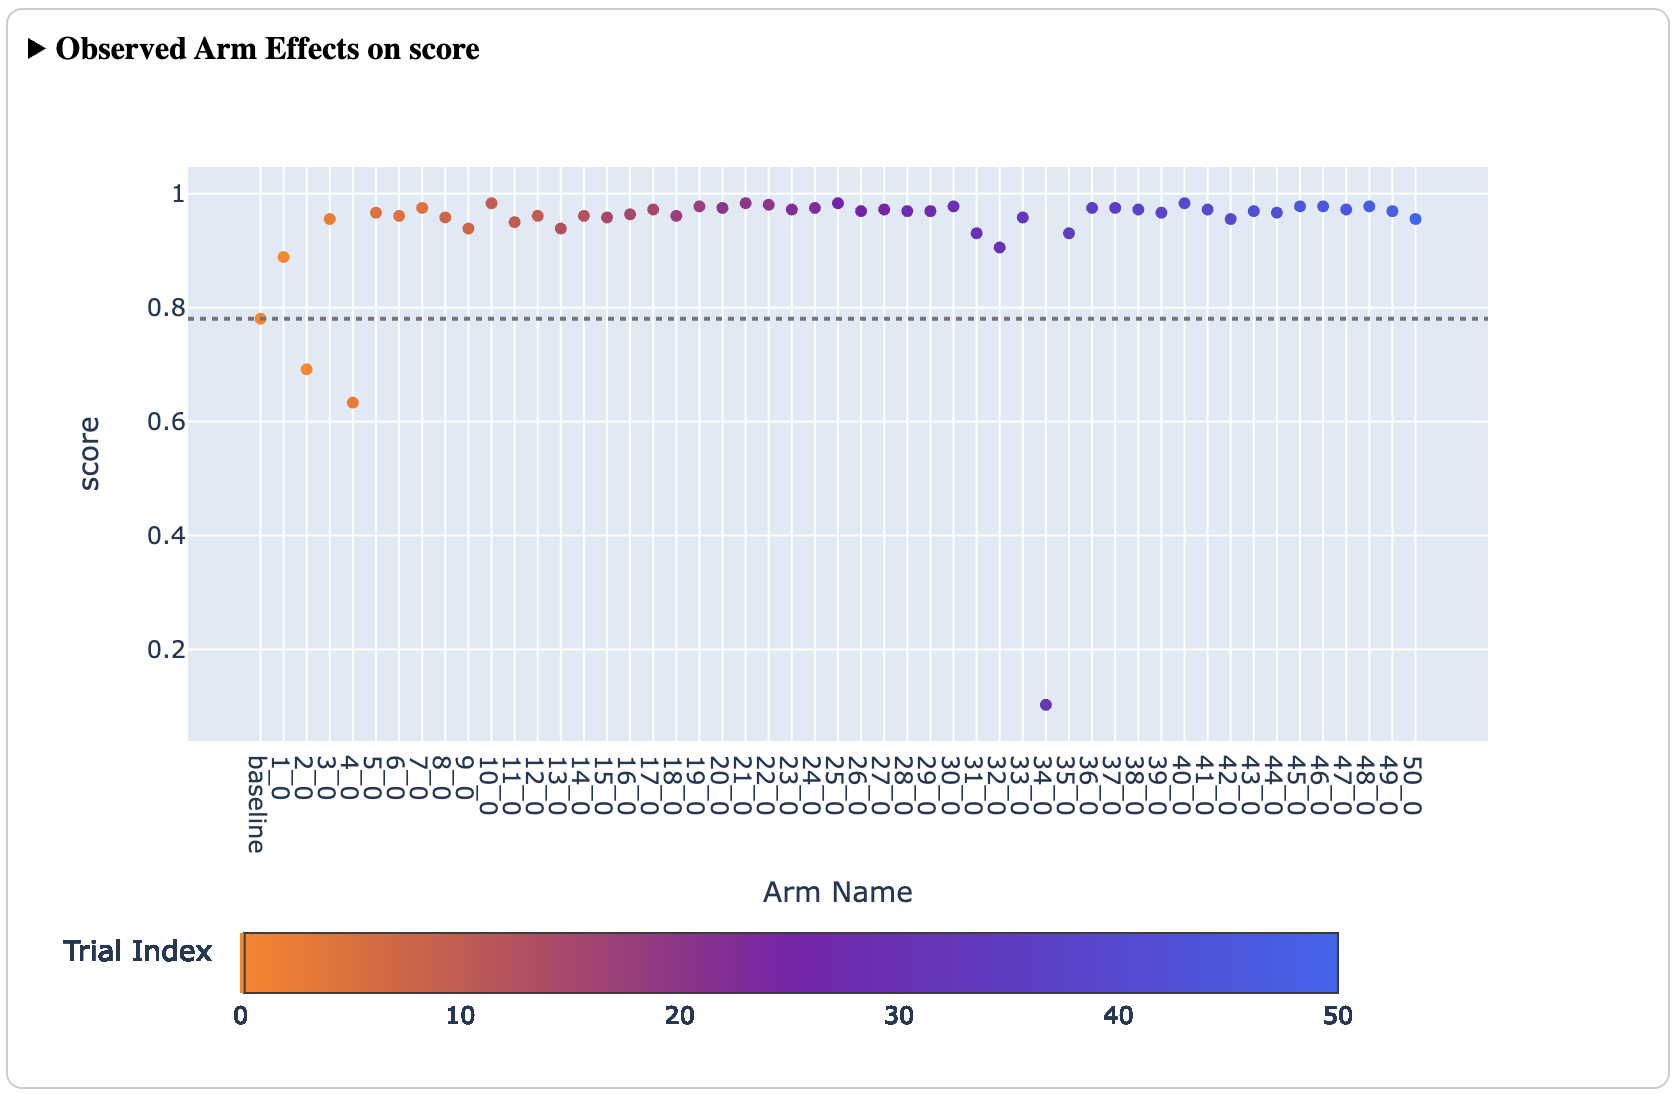
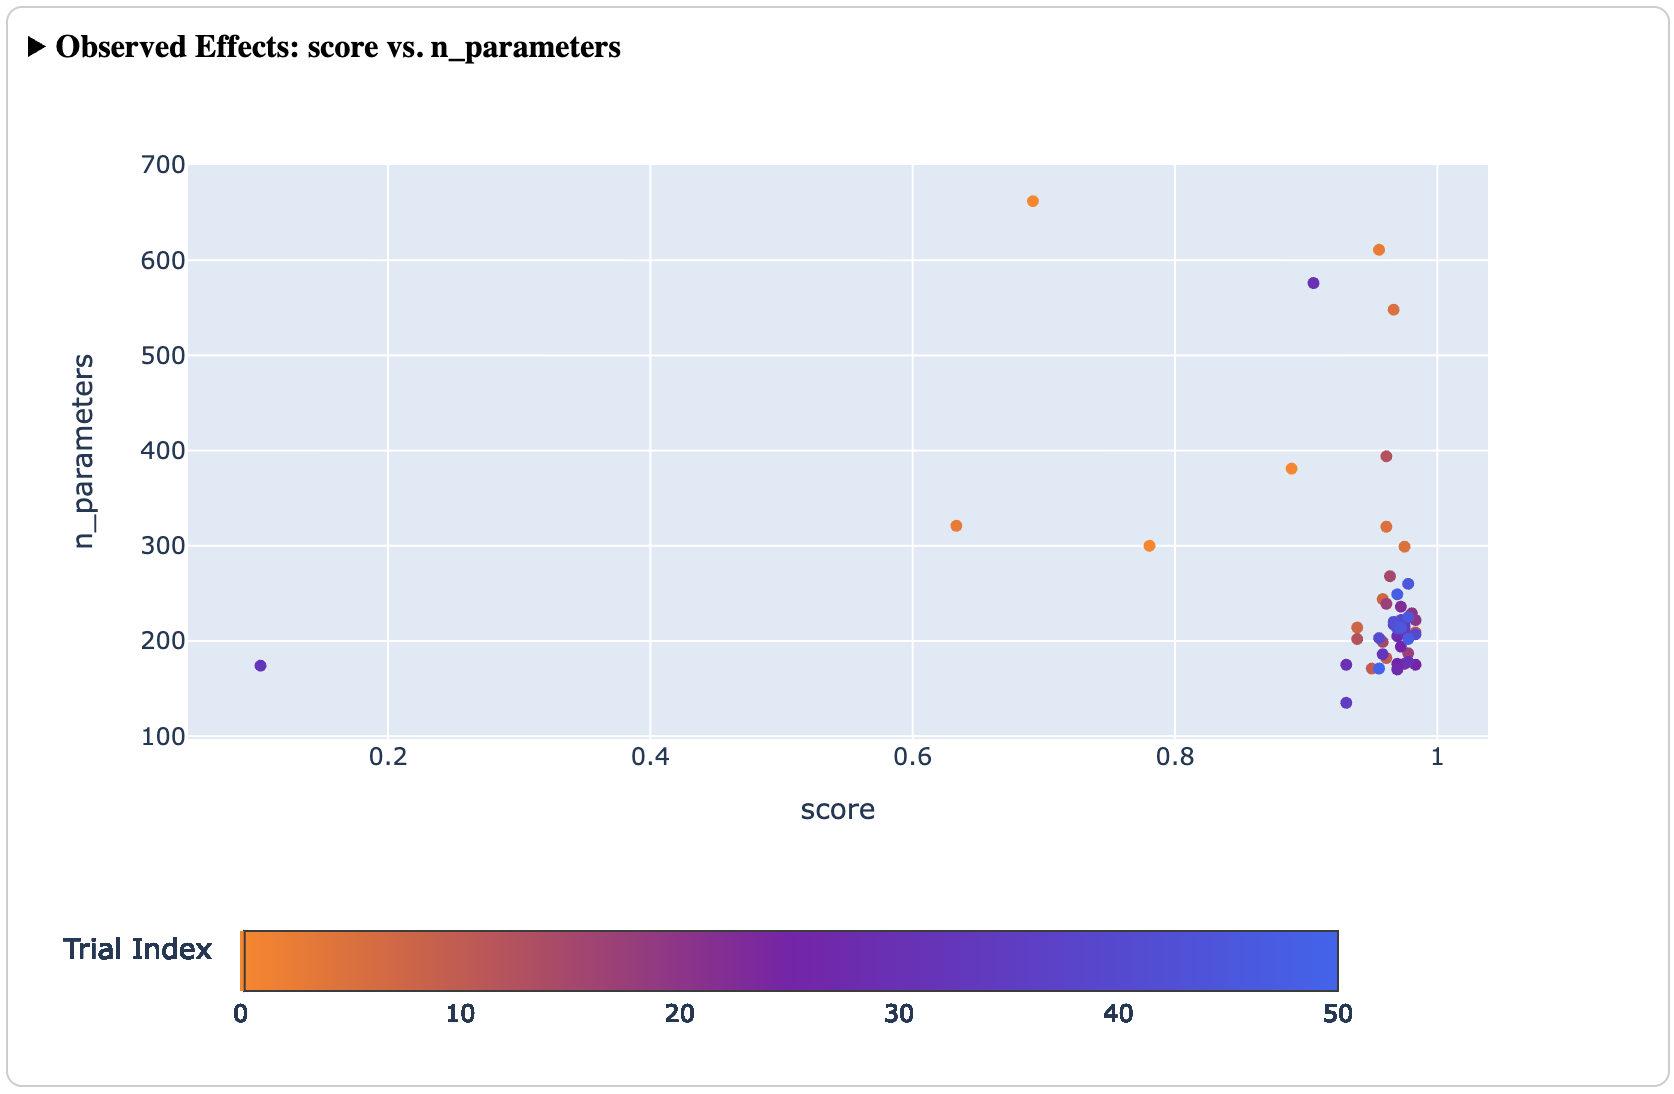
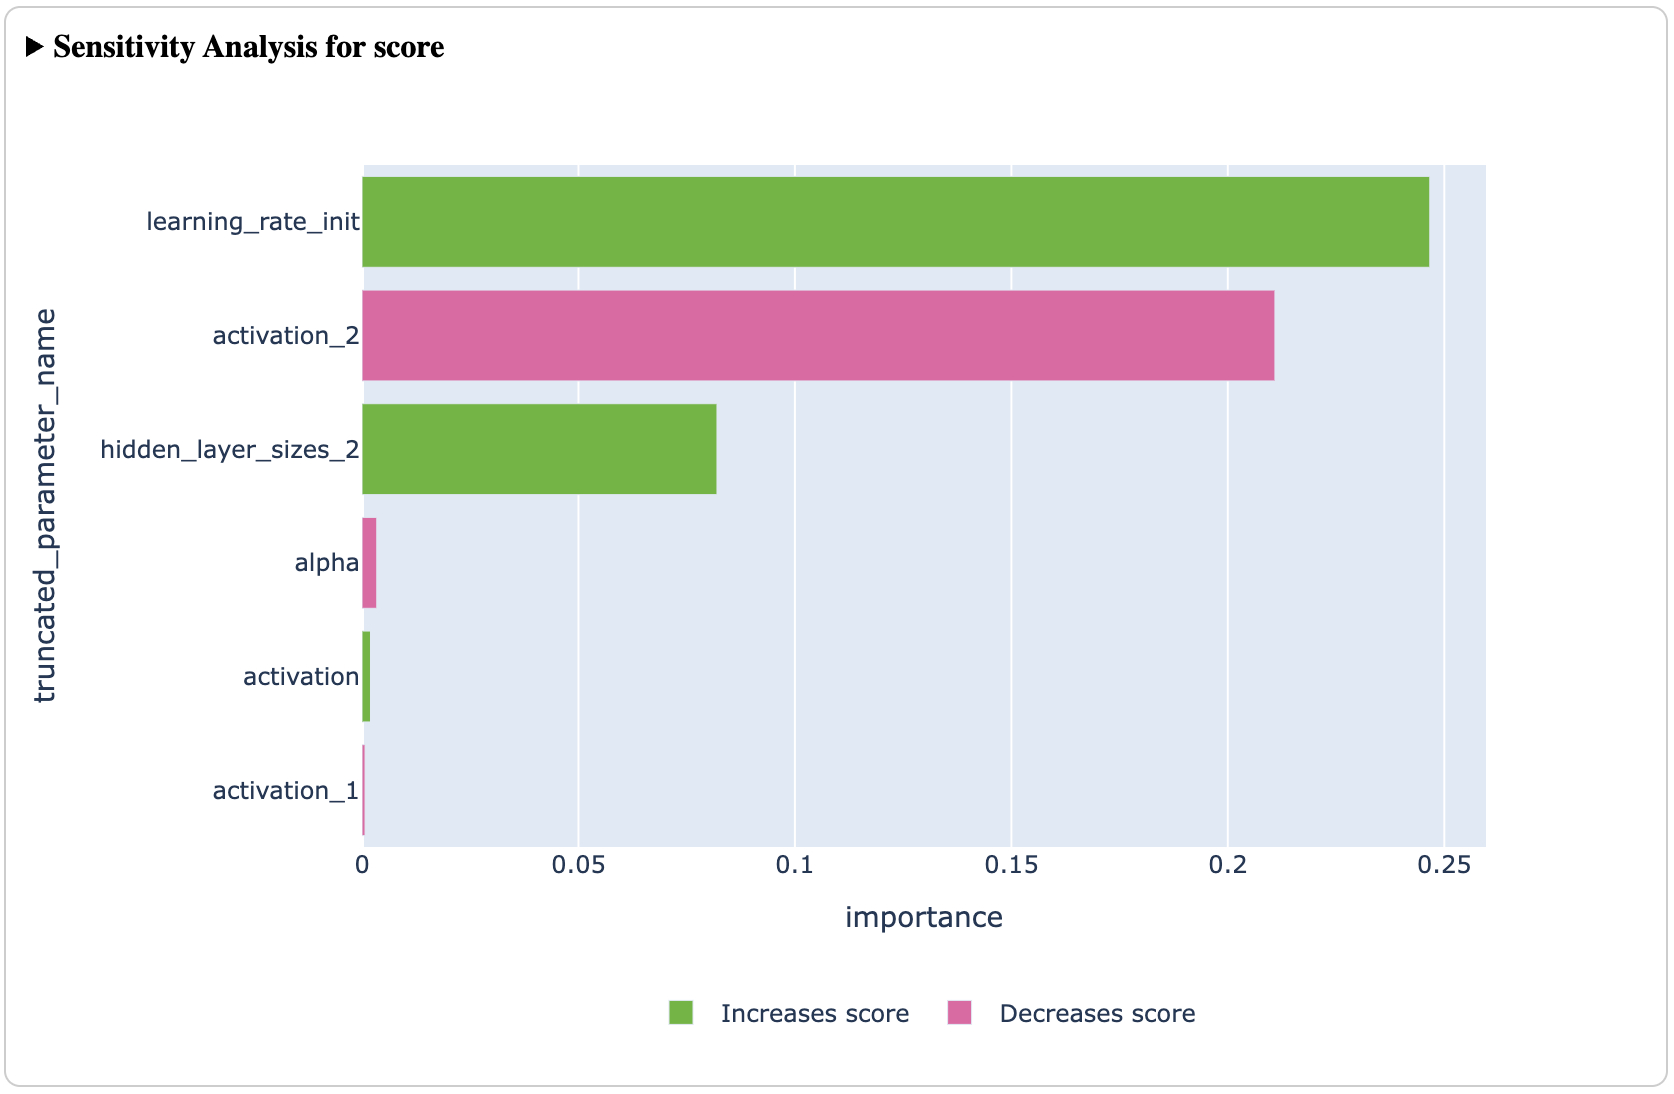
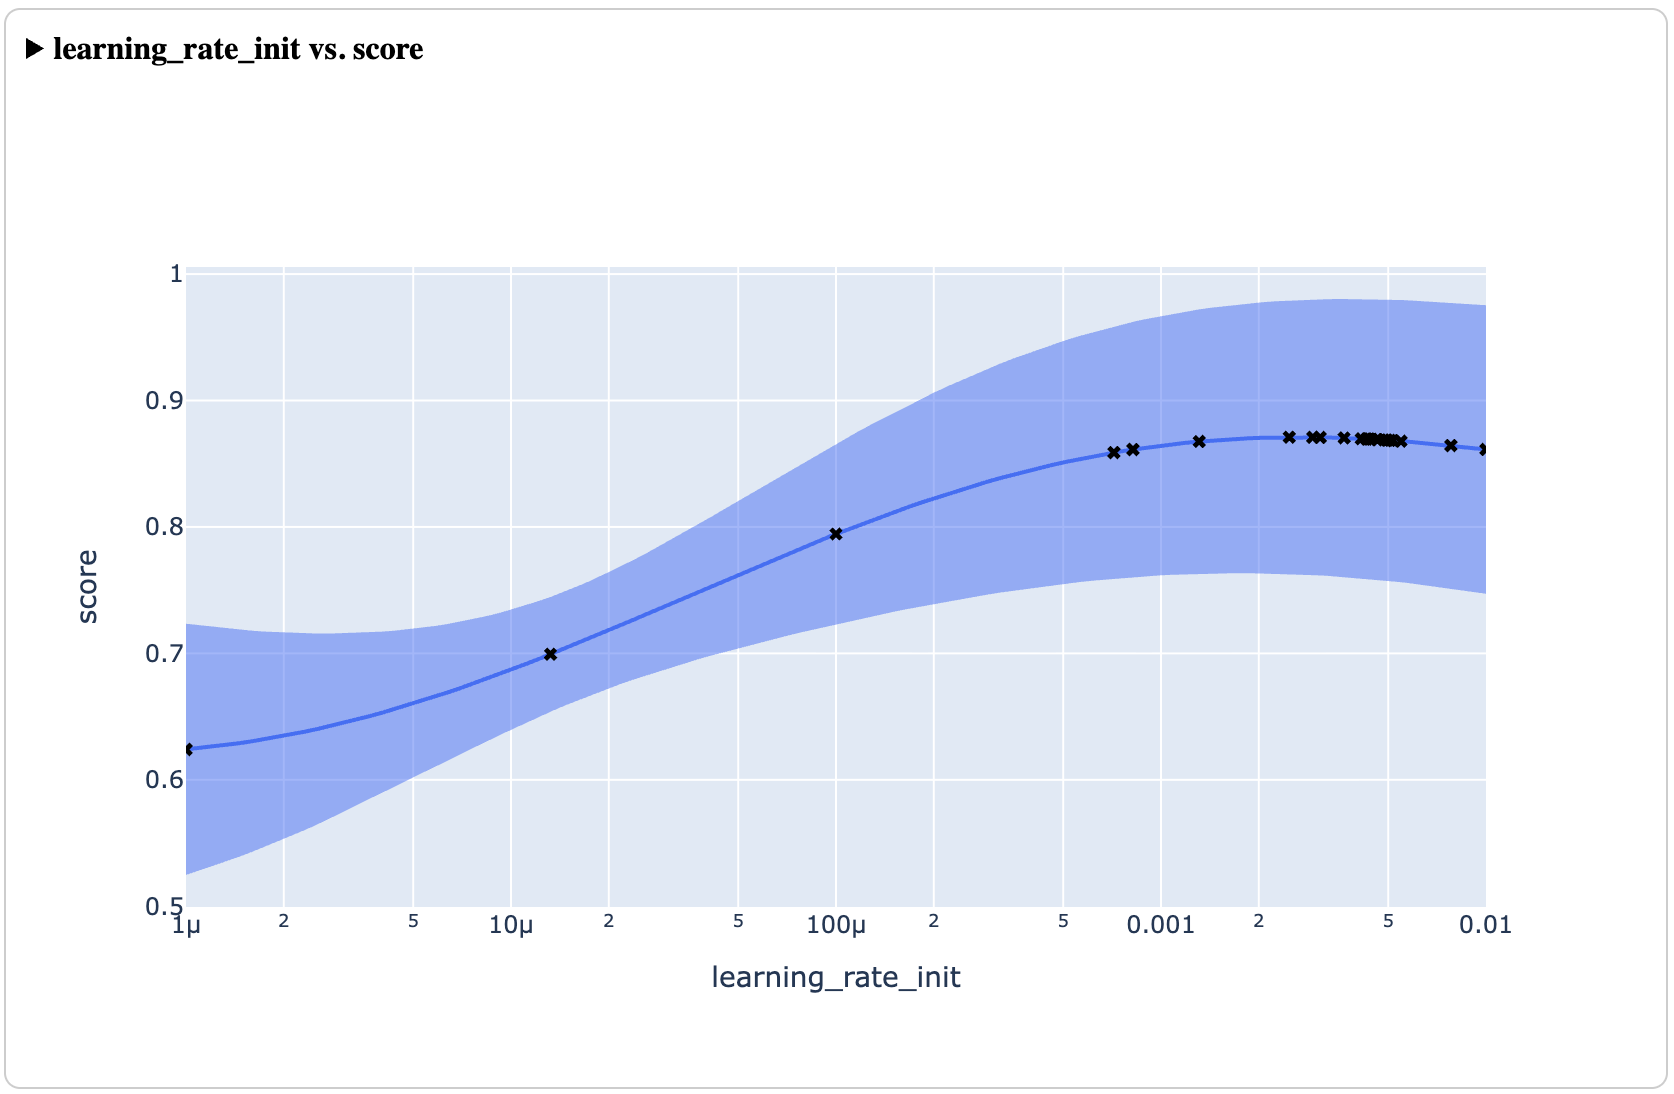
In addition to finding optimal configurations efficiently, Ax is a powerful tool for understanding the underlying system being optimized. Ax provides a suite of analyses (plots, tables, etc) which helps its users understand how the optimization is progressing over time, tradeoffs between different metrics via a Pareto frontier, visualize the effect of one or two parameters across the input space, and explain how much each input parameter contributes to the results (via sensitivity analysis).
These tools allow experimenters to walk away with both an optimal configuration to deploy to production and a deeper understanding of their system, which can inform decisions moving forward.
How Ax Works
By default Ax uses Bayesian optimization, an effective adaptive experimentation method that excels at balancing exploration – learning how new configurations perform, and exploitation – refining configurations previously observed to be good. Ax relies on BoTorch for its implementation of Bayesian optimization components.
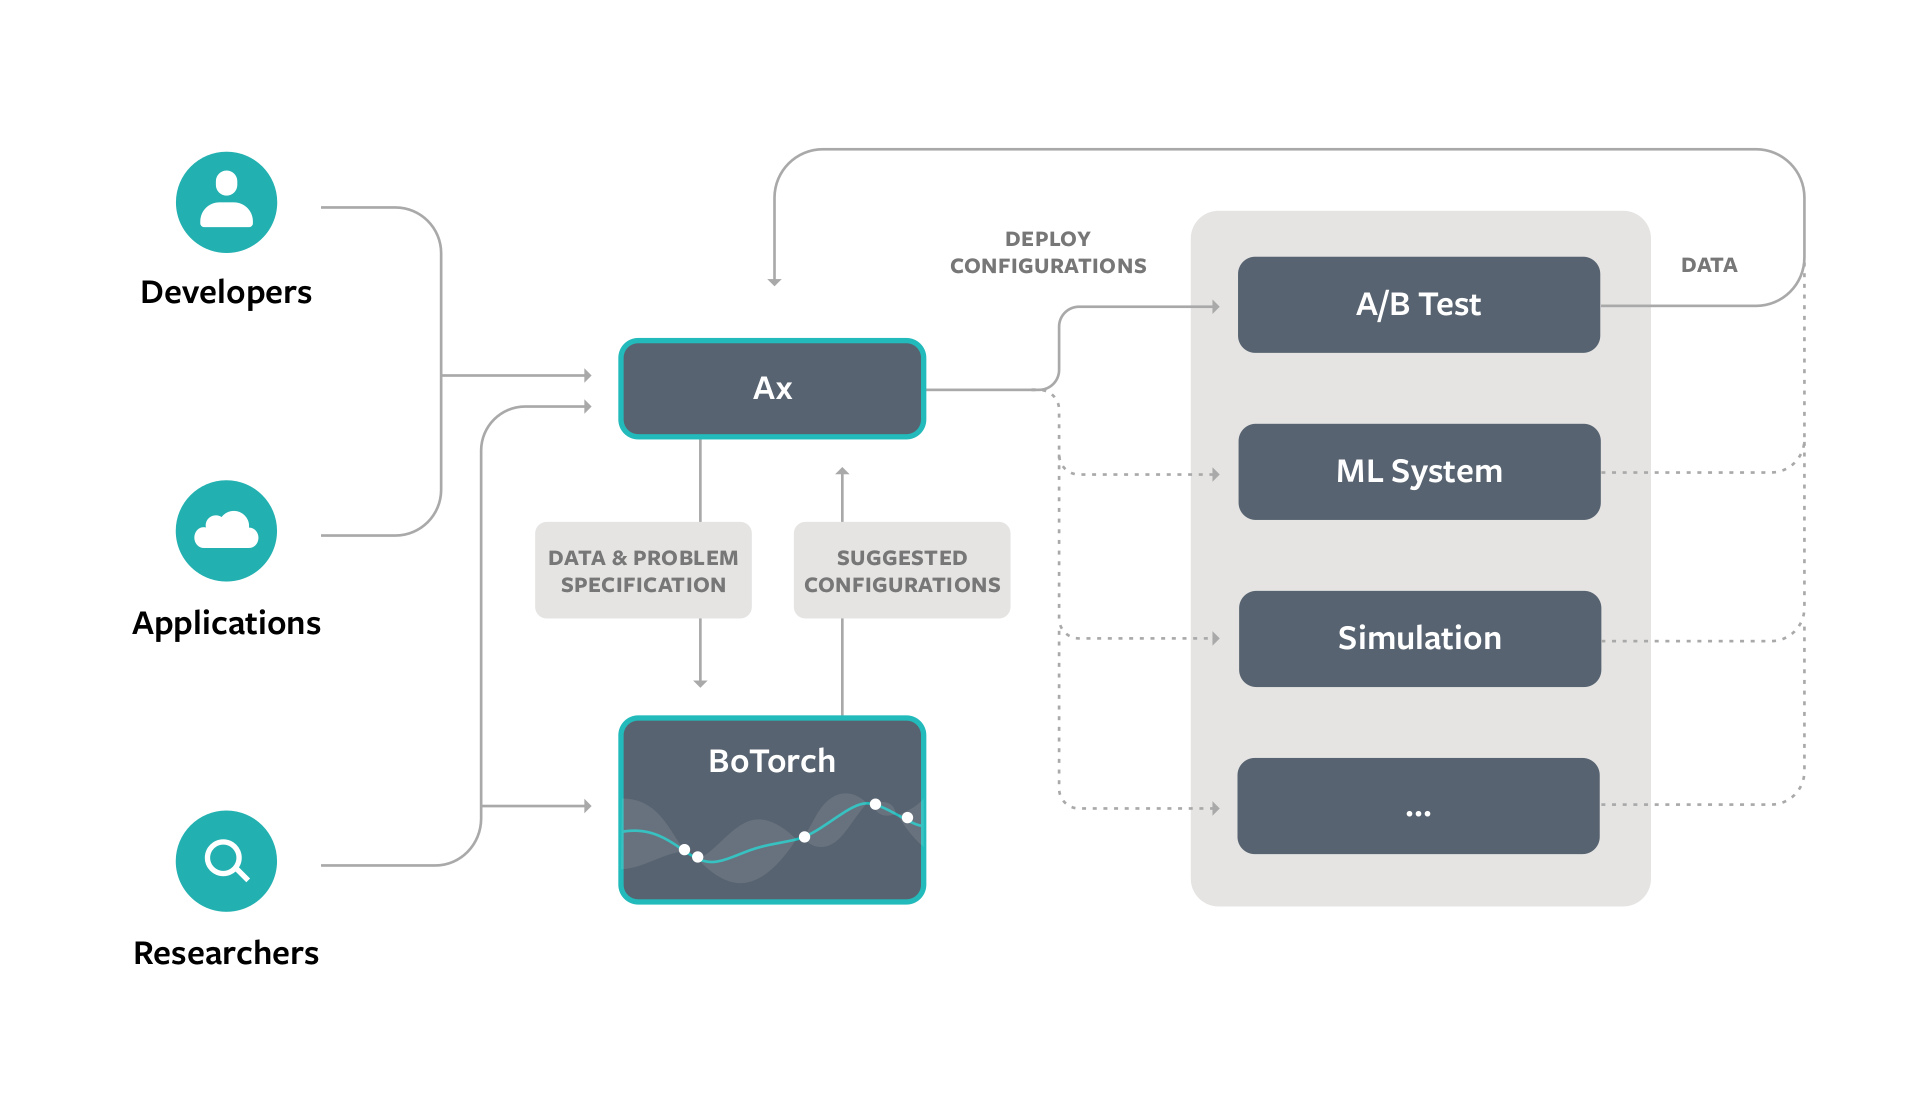
Bayesian optimization is an iterative approach to solving the global optimization problem which does not assume any information about the form of the function f. In practice, this means optimizing systems by evaluating some candidate configurations
(i.e., trying some configurations out and measuring their effect), building a surrogate model using this data, using that surrogate to identify the most promising configuration to evaluate next, and repeating until an optimal solution has been found or the experimental budget is exhausted.
Under typical settings Ax uses a Gaussian process (GP) as the surrogate model during the Bayesian optimization loop, a flexible model which can make predictions while quantifying uncertainty and is especially effective with very few data points. Ax then uses an acquisition function from a family called expected improvement (EI) to suggest the next candidate configurations to evaluate by capturing the expected value of any new configuration compared to the best previously evaluated configuration.
The following animation shows this loop with a GP modeling the goal metric plotted above in blue and EI plotted below in black; the highest value of EI informs the next value of x to evaluate. Once the new value of x has been evaluated, the GP is re-fit with the new data point and we calculate the next EI value.
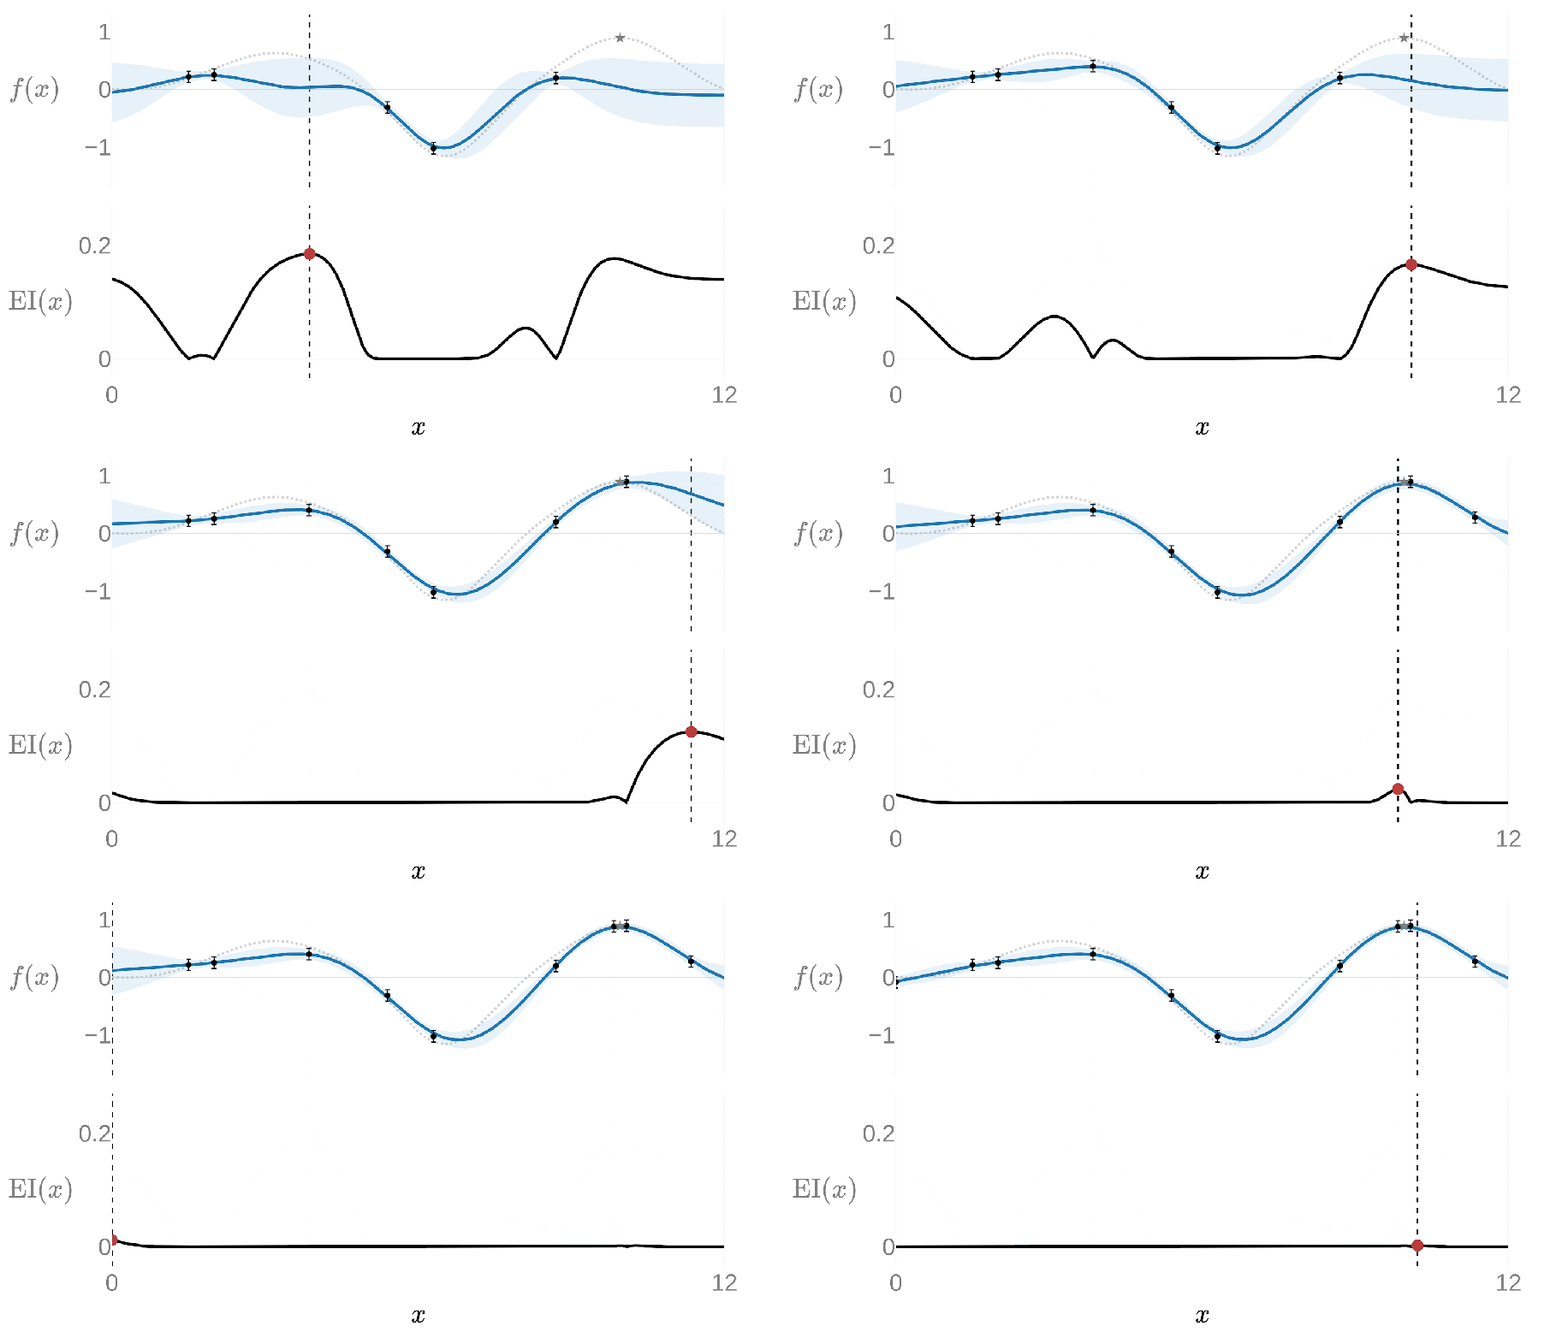
This 1-dimensional example can be expanded for many input and output dimensions, allowing Ax to optimize problems with many (potentially hundreds) of tunable parameters and outcomes. In fact, higher-dimensional settings, in which covering the search space becomes exponentially more costly, is where the surrogate-based approach really shines compared to other approaches.
You can read more about Bayesian optimization on Ax website’s Introduction to Bayesian Optimization page.
How We Use Ax at Meta
Ax has been deployed at scale at Meta to solve some of the company’s most challenging optimization problems. Thousands of developers at Meta use Ax for tasks like hyperparameter optimization and architecture search for AI models, tuning parameters for online recommender and ranking models, infrastructure optimizations, and simulation optimization for AR and VR hardware design.
These experiments optimize nuanced goals and leverage sophisticated algorithms. For instance, we’ve used multi-objective optimization to simultaneously improve a machine learning model’s accuracy while minimizing its resource usage. When researchers were tasked with shrinking natural language models to fit on the first generation of Ray-Ban Stories they used Ax to search for models that optimally traded off size and performance. Additionally, Meta engineers use constrained optimization techniques for tuning recommender systems to optimize key metrics while avoiding regressions in others.
Recently, Ax was used to design new faster curing, low carbon concrete mixes that were deployed at one of our data center construction sites. These new mixes are playing an important role in advancing our goal of net zero emissions in 2030.
We see problems across every domain where the ultimate quality of a system is affected by parameters whose interactions are complex to reason about without experimentation and where experimentation has a meaningful cost: Ax addresses these challenges by employing a data-driven approach to adapt experiments as they unfold, enabling us to solve these problems efficiently and effectively.
The Future of Ax
We are always working to improve Ax by building new features for representing innovative experiment designs, exciting new optimization methods, or integrations for using Ax with external platforms. Ax is proud to be open source (MIT license), and we invite both the practitioner and research communities to contribute to the project whether that be through improved surrogate models or acquisition functions, extensions used for individual research applications that may benefit the larger community, or simply bug fixes or improvements to the core capabilities. Please reach out to the team via Github Issues.
Read the Paper
Ax: A Platform for Adaptive Experimentation
To learn more about Meta Open Source, visit our website, subscribe to our YouTube channel, or follow us on Facebook, Threads, X, Bluesky and LinkedIn.
Acknowledgements
Ax was created by Meta’s Adaptive Experimentation team: Sebastian Ament, Eytan Bakshy, Max Balandat, Bernie Beckerman, Sait Cakmak, Cesar Cardoso, Ethan Che, Sam Daulton, David Eriksson, Mia Garrard, Matthew Grange, Carl Hvarfner, Paschal Igusti, Lena Kashtelyan, Cristian Lara, Ben Letham, Andy Lin, Jerry Lin, Jihao Andreas Lin, Samuel Müller, Miles Olson, Eric Onofrey, Shruti Patel, Elizabeth Santorella, Sunny Shen, Louis Tiao, and Kaiwen Wu.
The post Efficient Optimization With Ax, an Open Platform for Adaptive Experimentation appeared first on Engineering at Meta.
]]>The post Announcing the Completion of the Core 2Africa System: Building the Future of Connectivity Together appeared first on Engineering at Meta.
]]>We’re excited to share the completion of the core 2Africa infrastructure, the world’s longest open access subsea cable system. 2Africa is a landmark subsea cable system that sets a new standard for global connectivity. This project is the result of years of collaboration, innovation, and a shared vision to connect communities, accelerate economic growth, and enable transformative digital experiences across Africa and beyond.
Unprecedented Scale and Reach
2Africa is the first cable to connect East and West Africa in a continuous system and link Africa to the Middle East, South Asia, and Europe. With a current reach of 33 countries and still counting, we’re enabling connectivity for 3 billion people across Africa, Europe, and Asia – more than 30% of the world’s population. This scale is unprecedented and we are proud to have partnered with stakeholders across the ecosystem to deliver new levels of connectivity at such scale.

Building 2Africa: Partnership, Scale, and Open Access
Africa’s digital future depends on robust, scalable infrastructure built in partnership with local communities and stakeholders. As demand for high-speed internet grows, a consortium of global partners led by Meta, including Bayobab (MTN Group), center3 (stc), CMI, Orange, Telecom Egypt, Vodafone Group, and WIOCC, came together to design and invest in what would become the world’s longest open access subsea cable system. With the Pearls extension scheduled to go live in 2026, 2Africa’s complete system length of 45,000 kilometers is longer than the equivalent of the Earth’s circumference.
Realizing this vision required close collaboration across both private and public sectors. We managed the project and facilitated engagement with local partners for cable landing, construction, and regulatory processes. The deployment spanned 50 jurisdictions and nearly six years of work, relying on the active engagement of regulators and policymakers to navigate requirements and keep progress on track.
The consortium’s shared goal is to develop an open, inclusive network that fosters competition, supports innovation, and unlocks new opportunities for millions. This open-access model ensures that multiple service providers can leverage the infrastructure, accelerating digital transformation and AI adoption across the region. New partners including Bharti Airtel and MainOne (an Equinix Company) collaborated on specific segments and data center integration, further expanding the cable’s impact and reach.
Engineering Innovation and Overcoming Challenges
Building 2Africa required us to push the boundaries of what’s possible in subsea infrastructure. We deployed advanced spatial division multiplexing (SDM) technology, supporting up to 16 fiber pairs per cable. This is double the capacity of older systems. It is the first 16-fiber-pair subsea cable to fully connect Africa. We incorporated undersea optical wavelength switching, enabling flexible bandwidth management and supporting evolving demands for AI, cloud, and high-bandwidth applications.
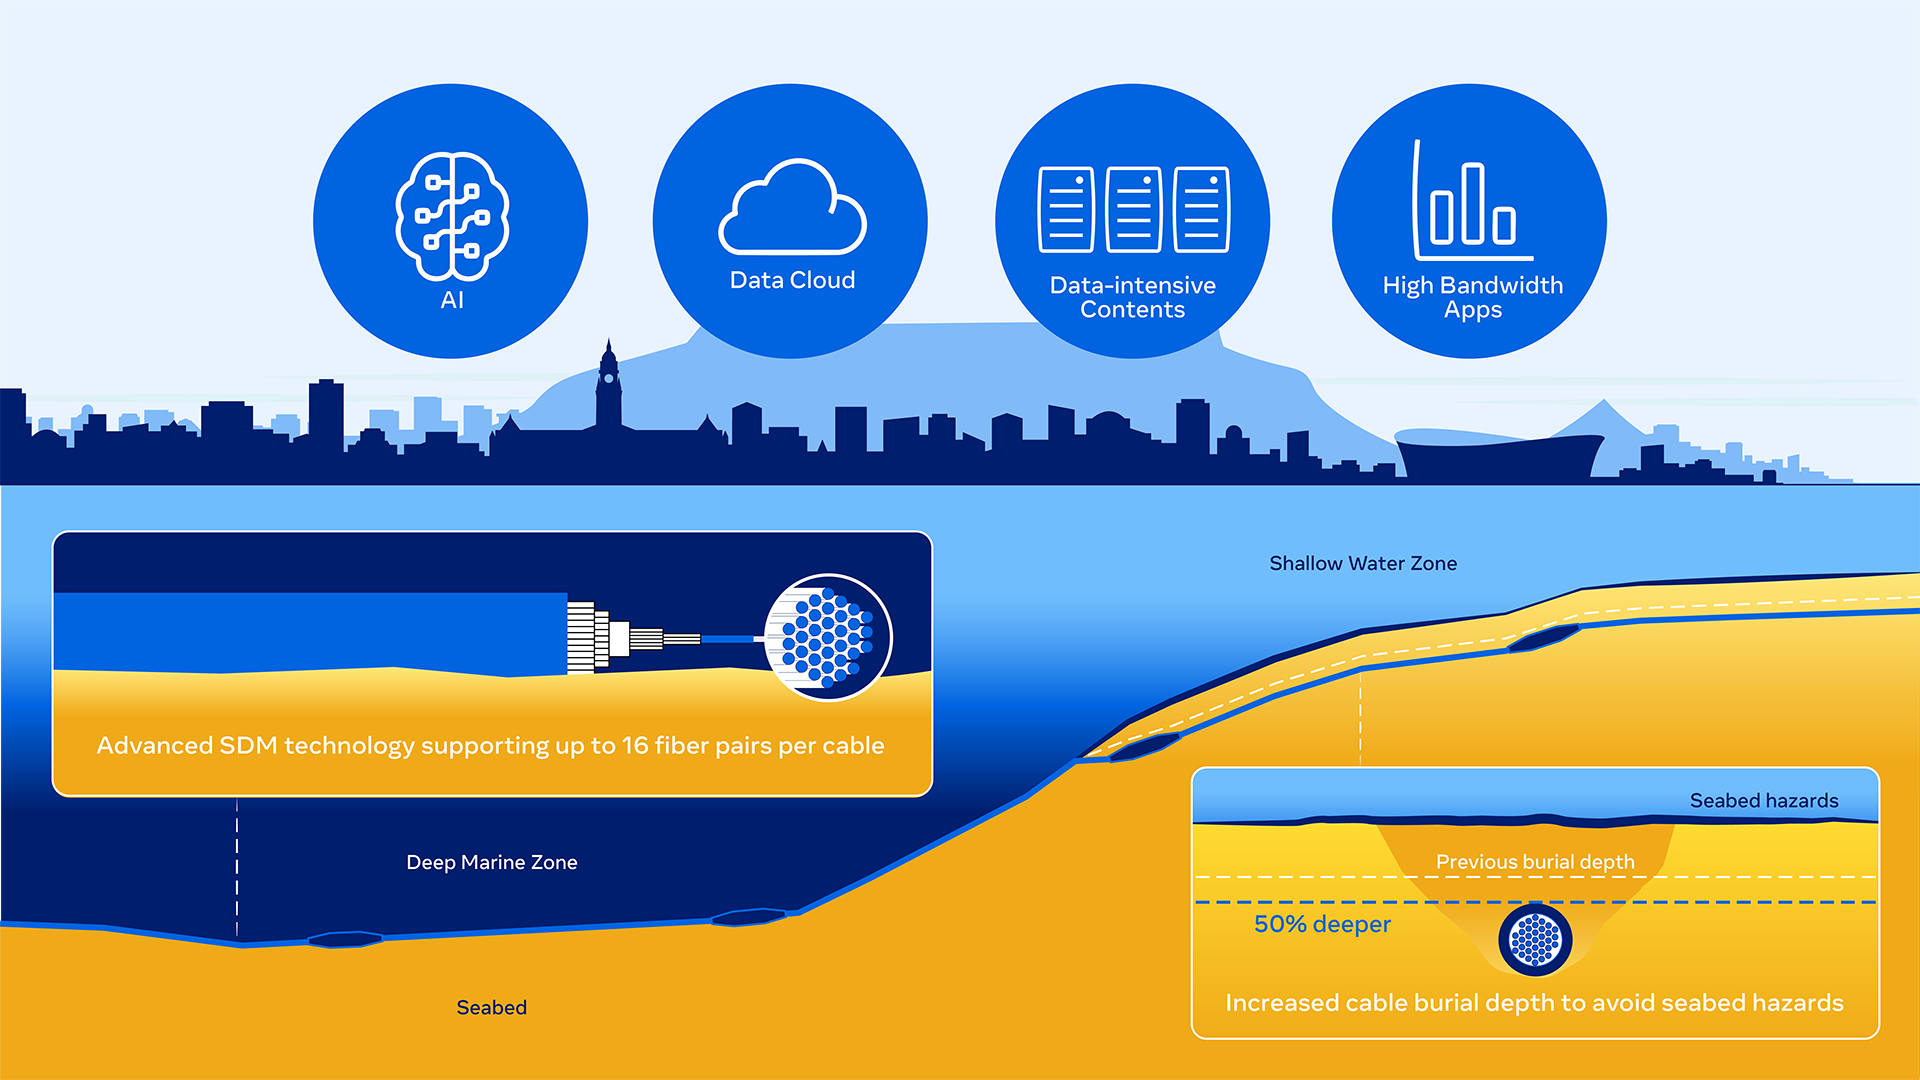
We increased 2Africa’s burial depth by 50% over previous systems and carefully routed the cable to avoid seabed hazards such as seamounts at hot brine pools, improving resilience and network availability. The system features two independent trunk powering architectures across its West, East, and Mediterranean segments, optimizing capacity and providing additional resiliency against electrical faults. Our branching unit switching capability allowed us to optimize for trunk capacity and reliability by utilizing routes much further offshore from hazards such as the Congo Canyon turbidity currents, while efficiently serving branches to West African nations. To further ensure the integrity and reach of the cable, we engineered compatible crossing solutions for over 60 oil and gas pipelines.

Over the course of construction, we deployed 35 offshore vessels, amounting to nearly 32 years of vessel operations, while dedicated shore-end operations required even more inshore vessels, locally mobilized for cable pulling, guarding, security, and dive support. In remote locations, we imported and mobilized specialist equipment such as dive decompression chambers and shore-end burial tooling to locally operated vessels.
Economic Impact and Community Transformation
2Africa is delivering a step change in international bandwidth for Africa, with technical capacity that far exceeds previous systems. For example, on the West segment, stretching from England to South Africa, and landing in countries such as Senegal, Ghana, Cote d’Ivoire, Nigeria, Gabon, the Republic of Congo, DRC, and Angola, the cable supports 21 terabits per second (Tbps) per fiber pair, with 8 fiber pairs on the trunk. This results in a total trunk capacity of up to 180 Tbps.
But what does 180 Tbps mean for people?
To put in perspective:
- 180 Tbps is enough to stream over 36 million HD movies simultaneously (assuming 5 megabits per second (Mbps) per stream).
- For an individual, this means the potential to download 15,000 full-length Nollywood films (each about 1.5 GB) per second, or enable students to access a remote university’s full library in a minute.
- For a city like Lagos, it means millions of people can video call, stream, and work online at the same time – without experiencing slowdowns or congestion.
This massive capacity ensures a near-limitless supply of international internet bandwidth, allowing internet service providers (ISPs) and mobile network operators (MNOs) to secure capacity at much lower wholesale prices. This creates market competition, redundancy, and supports modern digital infrastructure including cloud services, data centers, and 5G deployment.
The impact is profound: 2Africa is expected to contribute up to 36.9 billion US dollars to Africa’s GDP within just the first two to three years of operation. The cable’s arrival will boost job creation, entrepreneurship, and innovation hubs in connected regions. Evidence from previous cable landings shows that fast internet access increases employment rates, improves productivity, and supports shifts toward higher-skill occupations.
Meta’s vision is to empower African entrepreneurs, creators, and businesses to innovate and collaborate. By partnering with policymakers, regulators, and stakeholders, we advance Africa’s digital transformation and support its position as an emerging major player in the global digital economy.
Building Connections, Empowering Progress
The completion of 2Africa is a defining moment for Africa’s digital future. By leading the design, funding, and deployment of the world’s longest subsea cable system to date, we are building the infrastructure that will power transformative new experiences, drive economic growth, and connect billions of people. We are laying the foundation for the next generation of digital experiences. This subsea cable will enable faster, more reliable internet and support AI-driven services through digital access.
2Africa is part of Meta’s mission to build the future of human connection, opening more pathways for communities across Africa to help shape and play a critical role in the next chapter of the global digital economy.
The post Announcing the Completion of the Core 2Africa System: Building the Future of Connectivity Together appeared first on Engineering at Meta.
]]>The post Enhancing HDR on Instagram for iOS With Dolby Vision appeared first on Engineering at Meta.
]]>Every iPhone-produced HDR video encoding includes two additional pieces of metadata that help ensure the picture is consistent between different displays and viewing conditions:
- Ambient viewing environment (amve), which provides the characteristics of the nominal ambient viewing environment for displaying associated video content. This information enables the final device to adjust the rendering of the video if the actual ambient viewing conditions differ from those for which it was encoded.
- Dolby Vision, which enhances color, brightness, and contrast to better match the video to the capabilities of the display.
While the Instagram and Facebook iOS apps have supported high dynamic range (HDR) video since 2022, our initial rollout of HDR didn’t support Dolby Vision or amve delivery and playback. Our derived encodings were done with FFmpeg, which has traditionally lacked support for Dolby Vision and amve. Since our tooling was discarding this metadata, it meant that pictures were not entirely representative of the way they were meant to be viewed – something that was particularly noticeable at low screen brightness levels.
Now, after hearing feedback from people using our iOS apps, we’ve worked with our partners to preserve the iOS-produced amve and Dolby Vision metadata from end-to-end and significantly enhanced the HDR viewing experience on iOS devices.
How Meta Processes Video
It may first be helpful to give some background on the lifecycle of a video at Meta.
The majority of videos uploaded through our apps go through three main stages:
1. Client Processing
In the client processing stage, the creator’s device flattens their composition into a single video file at a size appropriate for upload. For HDR videos produced by iOS devices this means encoding with HEVC using the Main 10 profile. This is the stage in which amve and Dolby Vision metadata are produced, added to the encoded bitstream, and uploaded to Meta’s servers.
2. Server Processing
In the server processing stage, our transcoding system generates different versions of the video for different consumers. As playback occurs across a variety of devices with different capabilities, we need to produce the video in a format which will be optimal for each device. In the scope of HDR uploads, this means producing an SDR version for devices that don’t support HDR, a VP9 version to satisfy the majority of players, and (for our most popular videos) an AV1 version with the highest quality at the lowest file size.
Each of these versions is produced at a different bitrate (essentially, file size) to ensure that consumers with varying network conditions are all able to play the video without waiting for a large download to complete (the tradeoff is that lower bitrates have lower quality). All of our derived encodings are created with FFmpeg, which historically lacked support for amve and Dolby Vision. This is the stage where metadata was getting dropped.
3. Consumption
In the consumption stage, the viewer’s device picks the version that will play back smoothly (without stalls), decodes it frame by frame, and draws each frame onto the screen. In the context of iOS, all HDR playback is done using Apple’s AVSampleBufferDisplayLayer (AVSBDL). This is the class that consumes amve and Dolby Vision metadata along with each decoded frame.
How We Added Support for amve
When we first set off to support amve in 2022, we noticed something interesting. As we operate on a decoupled architecture of lower-level components rather than a typical high-level AVPlayer setup, we were able to inspect an intact video encoding and get a look at the amve metadata in between the decoder and AVSBDL. We observed that every frame of every video seemed to have exactly the same metadata. This allowed us to hold ourselves over with a quick fix and hardcode these values directly into our player pipeline.
This was not a great situation to be in. Even though the value seemed to be static, there was nothing enforcing this. Maybe a new iPhone or iOS version would produce different values, then we’d be using the wrong ones. amve is also not a concept on Android, which would mean that viewing an Android-produced HDR encoding on iPhone would result in an image that was not technically accurate.
In 2024, we worked with the community to land amve support in FFmpeg. We also built in some logging, which showed that our two-year-old assertion that the values never change still stood. But if they ever do, we will be properly set up for it.
Enabling Dolby Vision
Dolby Vision was not as straightforward as amve to adopt.
Challenge #1: The extant specification was for carriage of metadata within an HEVC bitstream. We don’t deliver HEVC.
iPhone-produced HDR uses Dolby Vision profile 8.4, where 8 indicates a profile using HEVC (the video codec) and .4 means cross-compatible with HLG (the standard for HDR video that players without Dolby Vision support would adhere to).
In order to deliver Dolby Vision metadata we needed to carry it within a codec that we do deliver. Fortunately, Dolby has created Profile 10 for carriage of Dolby Vision within AV1. As VP9 does not offer a facility for carriage of additional metadata there is no support for Dolby Vision at this time, but we are interested in exploring alternate delivery mechanisms.
However, Dolby Vision Profiles 10 and 8 were not properly supported by our existing video processing tools, including FFmpeg and Shaka packager. Based on the specifications from Dolby, we collaborated with the FFmpeg developers to fully implement support for Dolby Vision Profile 8 and Profile 10. In particular, we enabled support within FFmpeg to transcode HEVC with Profile 8.4 into AV1 with Profile 10.4 using both the libaom and libsvtav1 encoders, and made fixes to other parts of the stack, including dav1d decoder and Shaka packager, to properly support Dolby Vision metadata.
Challenge #2: Getting Dolby Vision into AVSampleBufferDisplayLayer
When you feed AVSBDL an encoded bitstream in a supported format, e.g., HEVC from an iPhone camera, Dolby Vision just works for free. But we feed buffers that we decode independently, as we need to be able to decode formats that Apple does not offer out of the box (AV1 on devices before the iPhone 15 Pro, for example). Given this setup, it’s only fair that we’d have to extract Dolby Vision independently as well.
Following the newly-minted specification for carriage of Profile 10 within an AV1 bitstream from Dolby, we implemented manual extraction of Dolby Vision metadata, packaged it into the same format that AVSBDL expected, and we were in business.
To prove that our setup was working as expected, we set up a series of identical Instagram posts with and without Dolby Vision metadata. Our partners at Dolby measured the brightness of each of these posts using a display color analyzer, at varying levels of screen brightness.
They captured the following:
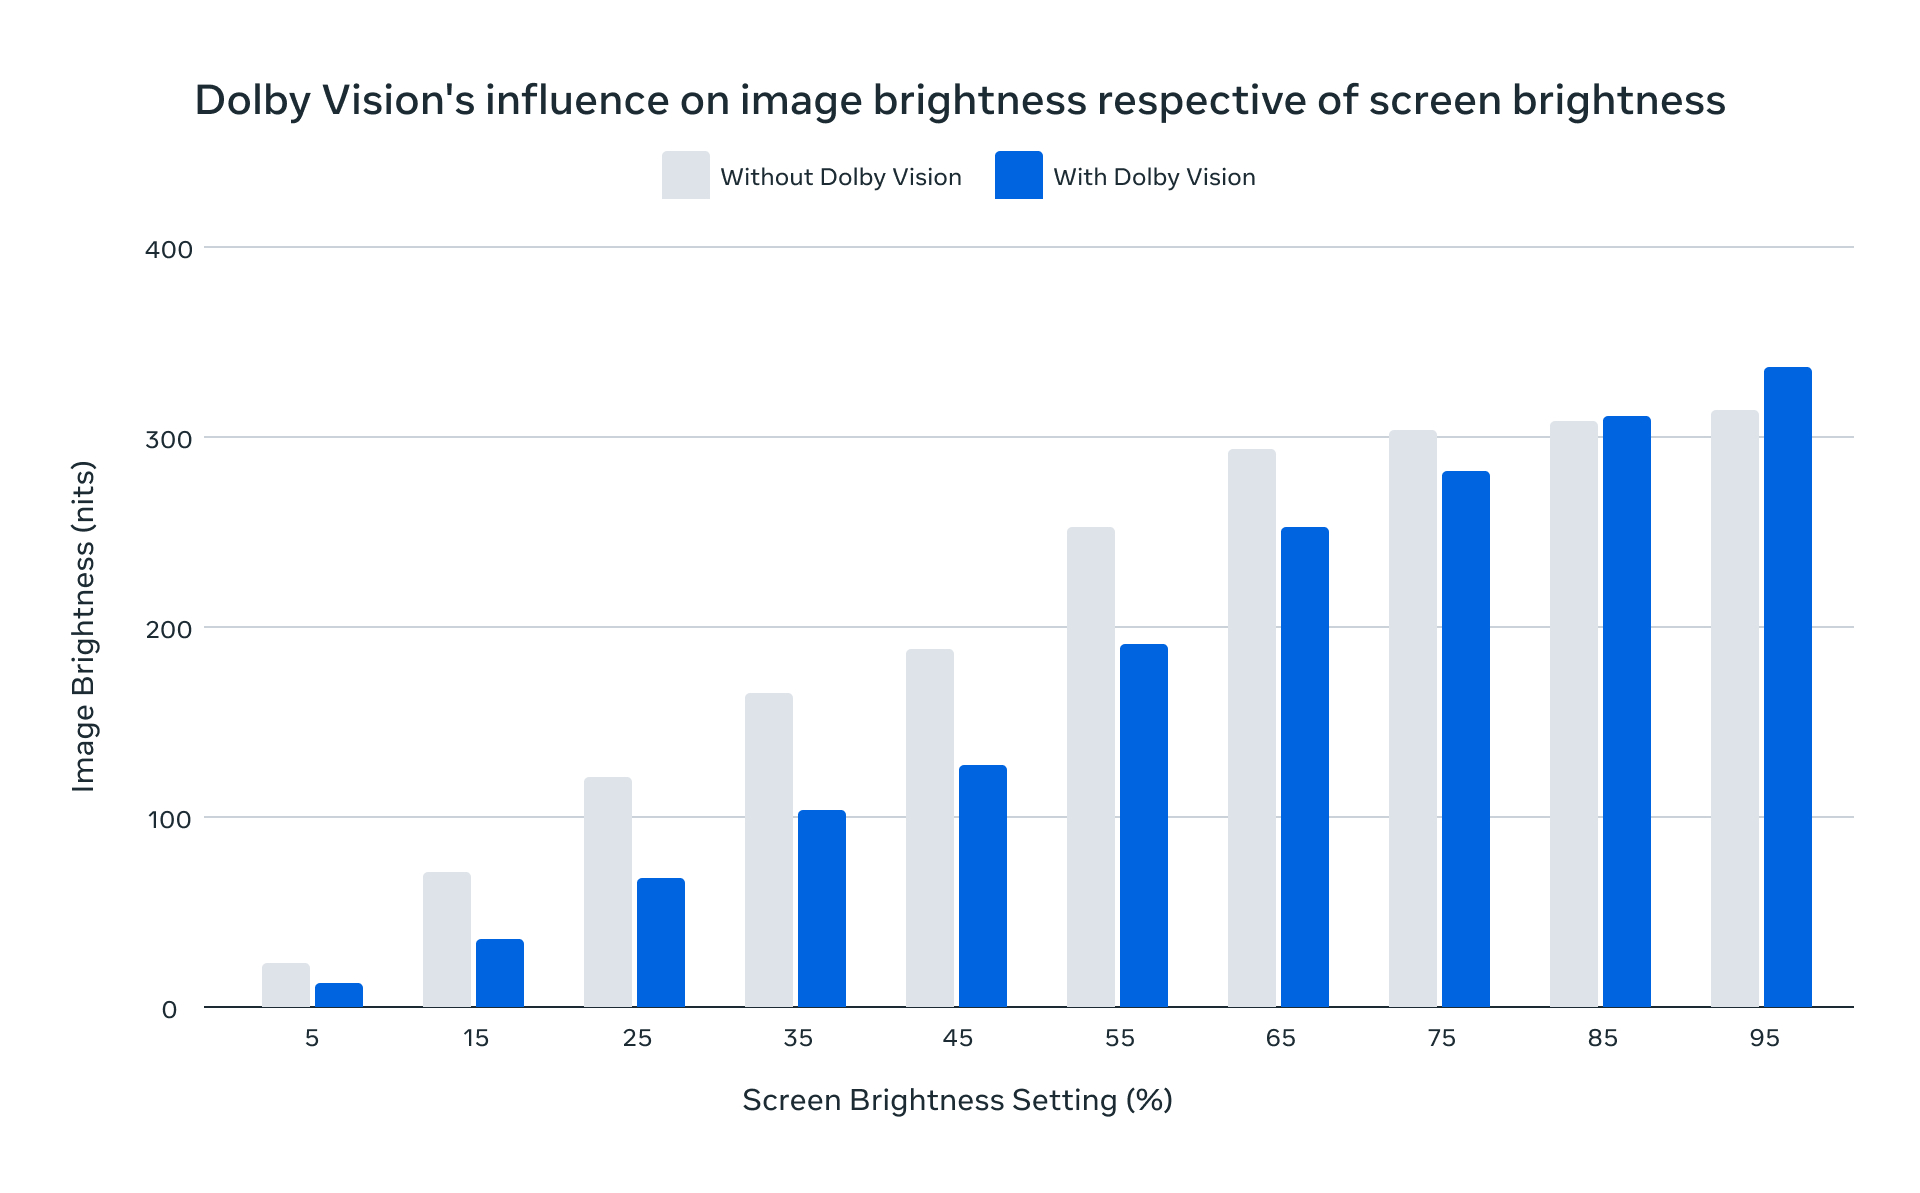
In this chart, the X-axis represents the screen brightness setting and the Y-axis represents the observed image brightness. The results demonstrate that with Dolby Vision metadata present, the brightness of the content much more closely follows the brightness setting of the screen.
It worked!…But we were not done yet.
Testing Our Dolby Vision Implementation
At Meta, we A/B test new features before shipping them to ensure they are performing as we expect. How do we A/B test metadata embedded within a video bitstream? The answer is that we produced an additional version of every video containing the new metadata. We delivered this new version to a randomly distributed test population while the randomly distributed control population continued receiving the existing experience. At our scale, we can assert that roughly an equal population will watch both flavors of each video.
For each flavor, we collected statistics such as how long the video was watched, how long it took to load, what type of connection it was watched on, and whether any errors were encountered during playback. Then we analyzed in aggregate to see how the flavor with metadata compared to the flavor without.
We hypothesized that if the metadata works as expected, videos with the new metadata would receive more watch time. But when we ran our initial test on Instagram Reels in 2024 we found that, on average, videos with Dolby Vision metadata were actually watched less than their standard counterparts.
How could this be possible? Isn’t Dolby Vision supposed to improve the image?
Our First A/B Test With Dolby Vision Metadata
Our data indicated that people were watching less Dolby Vision video because the videos were taking too long to load and people were just moving on to the next Reel in their feed.
There was a reasonable cause for the longer load times: The new metadata added on the order of 100 kbps to every video on average. It sounds petty, but our encodings are highly optimized for all kinds of diverse viewing conditions. Every bit counts in some situations, and a 100-kbps overhead was enough to regress engagement at the margins.
The answer to this was a compressed metadata format. The team at Dolby offered another specification which would lower the metadata overhead by a factor of four, to 25 kbps on average.
Would it be enough? We had to run another test to find out. But there was more work to be done first.
We needed to implement support for Dolby Vision metadata compression (and decompression while we’re at it) in FFmpeg using a bitstream filter. Also, while the uncompressed format was something we could extract from the bitstream and hand off to Apple, the compressed format was not something that was supported by Apple out of the box. We had to implement client-side decompression on our own.
About 2000 lines of code later, we were ready.
Our Successful A/B Test
This time, we found that consumers viewing with Dolby Vision metadata were spending more time in the app. We attribute this to people spending more time watching HDR videos in lower-light environments, when their screens are set to lower brightness levels and the HDR videos with proper metadata are less taxing on the eyes.
Because including Dolby Vision metadata had a tangibly positive outcome, we were able to make the case for shipping it across Instagram for iOS, making it our first app to take advantage of Dolby Vision. As of June 2025, all of our delivered AV1 encodings derived from iPhone-produced HDR include Dolby Vision metadata.
The Future of Dolby Vision Across Meta
The final challenge in the scope of this post is that Dolby Vision is not widely supported within the web ecosystem across different browsers and displays. Thus, we cannot accurately show the difference that it makes on this page, and hope you will experience it on Instagram on iPhone for yourself. The support for Dolby vision and amve is now in our encoding recipes and as such it’s ready for deployment to other platforms as well as we’re currently working on extending the support to Facebook Reels.
In collaboration with Dolby, we’ve solved the perceptible problem of HDR metadata preservation and collaborated with the FFmpeg developers to implement its support and make it readily available to the community to take advantage of.
This is just the beginning. We look forward to expanding Dolby Vision to other Meta apps and their corresponding operating systems.
Acknowledgements
We’d like to thank Haixia Shi, the team at Dolby, and Niklas Haas from FFmpeg for their work supporting this effort.
The post Enhancing HDR on Instagram for iOS With Dolby Vision appeared first on Engineering at Meta.
]]>