| CARVIEW |
I am continuing to blog. You can check out the Times Union Weather and Climate blog, where I will continue to talk about some general climate issues, although at a laymen´s level. I hope to see lots of commenters, and we´re free in the comment section to discuss more technical details on a certain subject. I am one of several contributors to this blog, although most others will be discussing weather issues.
I also periodically guest post for SkepticalScience.
]]>Unfortunately, Judith’s definitions (and the array of comments) of what this looks like are so broad that signing petitions on climate change, a professional society agreeing with the IPCC, or educating people who don’t have an opinion qualifies to make the “IPCC side” a dogma. The notion is that the “insiders” (whatever this means) have a case of the absence of doubt, intolerance of debate, appeal to authority, a desire to convince others of the ideological “truth”, or a willingness to punish those that don’t concur. The hundreds of comments generated in the discussion at her site by now have ranged from various degrees of extremes on what exactly qualifies under the definition of ideology. My aim with this post is only to offer some incomplete thoughts and a groundwork for which discussion can proceed, since much of the discrepancies in views come from varying premises rather than different conclusions.
I think there’s a lot of misconception on this issue and I see no evidence that Judith is thinking clearly with respect to her claims about the IPCC. Much of the debate has centered around semantics and definitions, so I want to start off with what many people take as “sides” to the debate, particularly when saying things like “the IPCC view” or identifying what a “skeptic” means. Much of the confusion is centered directly on how the scientific community comes to acquire knowledge on a specific topic, or how knowledge of global climate change has evolved.
The fourth assessment report of the IPCC consisted of three volumes of work, on the scale of ~1000 pages each, with the goal of summarizing research in the areas of the physical science, impacts, and policy of climate change. The AR4 does not represent original research, and so to begin with what Judith and other commenter’s refer to as the “IPCC view” is in reality the aggregate work done by the community in whatever sub-topic is being discussed, expressed as a summary of the “balance of evidence.” This cannot involve a static world view by definition, but will necessarily be modified as the community does more research and new or better understanding arises. If this were not the case, no need for an AR5 would exist. I also say ‘subtopics’ because the IPCC consists of thousands of “claims” ranging across various chapters, and with varying degrees of certainty. The WG1 alone directly involves research from the sea level, glaciology, paleoclimate, radiative transfer, temperature observation, modeling, etc communities and obviously in many cases these people will not interfere with each other. An expert on detection and attribution is probably not going to be talking about observations of sea level rise.
Perhaps we’re made to believe it’s only the central claims that is being argued as dogmatic (such as in the summary for policy makers) or the detection and attribution stuff linking anthropogenic causation to temperature increases, but this never becomes clear. This isn’t just being picky; by ignoring the complexity of what the IPCC discusses and lumping it into a single view, you cause people who aren’t interested in the discussion to look at the IPCC as the “pro-AGW camp,” which then artificially distinguished this from the “skeptics” which we are to presume are the “anti-IPCC” camp. This does an injustice to skepticism, but also to what the IPCC does.
Secondly, a clearer picture needs to be made when we say “AGW theory.” There is no such theory, and the categorization (at least in my experience) allows for a wide degree of interpretations, accusations, and straw man attacks. The label allows for a complete mischaracterization of what the science says, but more importantly it loosely defines to what extent new conclusions (such as lower or higher sensitivity, or higher or lower observed sea ice retreat compared to models) become consistent with “AGW theory.” For example, is a sensitivity of 0.5 degree per 2x CO2 consistent with “the theory?” 3 degrees? 10 degrees? Do more or less hurricanes in the future become (in)compatible with the theory? What about El Nino behavior in the future? Clearly, we don’t want all of these sorts of questions to be subjective interpretations on what constitutes compatibility, or the need to introduce letters such as ‘CAGW’. Once we label it as ‘catastrophic’ we’re less in the domain of physical theory and in the domain of interpretation, or just name-calling and straw man attacks. A basic understanding of the science and the ability to logically collect and interpret information goes a long way here.
A more complete description is that ‘AGW’ is a consequence of various theories in physics. The theories of radiative transfer are relevant not just for warming, but for understanding the atmospheres of stars, for Mars, or interpreting satellite images taken from space. There’s a high degree of thermodynamics and physical principles involved, such as the conservation of energy. CO2 increases involve an absolute necessity to force the outgoing longwave energy escaping Earth to go down for a fixed T. The total energy balance depends on all forcings too, not just CO2, but CO2 is the most readily capable agent to cause large change in the near future. The sun changes only too slow or too small to make much of an impact for the centennial timescales many people are interested in, volcanoes express a significant surface impact only for short times, and other greenhouse gases have been relatively secondary in importance and there’s no reason to suspect that will change. Even to the extent that climate sensitivity is low, CO2 can still triple or quadruple eventually and so it’s tough to see an alternative to not causing a large degree of warming in the future if fossil fuels aren’t cut down.
It is of course a value judgment to determine whether 3 degrees of warming is meaningless to your life. But it should be kept in mind that science is not just an isolated tool to advance knowledge for its own sake and reject bad hypotheses. To some extent a lot of knowledge is purely academic, such as studying what happens in a model when you remove all the CO2 from the air, but science can and should serve as a support for policy. It can and should serve as support for everyday people. Medical research is an obvious example. A petroleum geologist telling you to look for oil here and not over there is not dogma; it’s education and advising. A doctor telling you what a bad vs. a good diet looks like is not him pushing his dogma of health science. Expertise is valuable and it matters, and people treating climate science differently is just absurdly odd. Atmospheric science has become so relevant to people’s lives, and not just climate change, but in conversations of the daily weather. The ozone issue is an example. In the mid-century, nuclear testing was done in the stratosphere with the thought being that the air was so stably stratified and would not readily mix with air lower down, yet science showed that in fact this happened all the time. This can be accomplished easily for example by forming a frontal zone t not at the surface but at the tropopause. This knowledge should be given to policy makers. Of course we can’t tell you that the technique of blowing off bombs in the stratosphere would be morally wrong without getting into some philosophy, but as Raymond Pierrehumbert said in connection with the possibility of a runaway greenhouse happening on Earth, “No doubt Pielke Jr., and maybe Judy Curry, would think I’m making a value judgement [sic] outside my purview as a scientist when I say I think it would be a bad thing for the Earth to turn into Venus, but I’m willing to go out on a limb and say that anyway.”
As for “skepticism,” it’s an unfortunate circumstance that the label has inherently been given a bad name on the blogs. This isn’t because of intolerance toward debate as much as the large number of people who criticize the science, or even declare conspiracies and fraud, with an apparent willingness to mislead or ignorance of the subject. THIS EXISTS. It’s not dogmatic to point that out. It’s not dogmatic to point out that people like Pat Michaels or Tim Ball or Chris Monckton have lied to people, or that institutions exist to undermine credibility with no cares for advancing the science. Thus the term “denier” has formed. What’s more, it’s very easy to separate these type of people from a legitimate scientific skeptic, or a curious student, from the mere structure and flow of the argument upon casual inspection. Skepticism is healthy for science, but in no reasonable context can it be defined as the relentless rejection of any body of evidence that goes against your preconceived notions. To be blunt, while one can certainly see emotionalized references to polar bears drowning, or misattribution of a heat wave to climate change (particularly moreso in the public sector than in the scientific community), the type of behavior of denialism described above is very one-sided in this ‘debate.’ I find no reason not to equate this with creationism, an ideology formed not to advance biological science, but to defend a certain interpretation of a theological viewpoint at all costs.
Some claims, like “the greenhouse effect doesn’t exist” are just pure fantasy. But in general, separating a skeptic from a denialist is not about the claim as much as the process of reaching the conclusion and the willingness to modify that conclusion. Those that argue for a low climate sensitivity are often perceived to be more ‘skeptical’ than ‘denialistic’ for instance, but I don’t think the claim is inherently relevant. Rather, some people have to tap-dance a lot to argue for a low sensitivity, and seem to only cite their work while ignoring a large collection of evidence to the contrary. I don’t see how this is inherently beneficial to scientific progress.
Meanwhile, there are many interesting debates to be had within the scientific community. Climate sensitivity is one of them, but in a much different context than whether it’s “catastrophic” or not. There are many topics to be ‘skeptical’ about, one of which is the degree to which anthropogenic perturbations has or will modify hurricane patterns. It’s important to realize that the structure of this “AGW theory” is not a stack of cards that is one publication away from being broken. There are endless components to what we call ‘climate change.’ On the flipside, it took over half a century to convince the scientific community that changes in CO2 could even be a significant player in climate change, to say nothing of whether humans would or could modify its concentration. Arrhenius is often described as quantifying this first in 1896 but the fact is that he was an outlier for a considerable amount of time.
Finally, we’re going to be endlessly stuck at a cross-roads if discussion is stifled. Judith apparently thinks this is occurring, but a glance into the refereed literature clearly shows this is not the case. This is, whether you like it or not, the avenue by which new ideas need to be forwarded. We’re also going to be stuck at a cross-road if you perceive the progression toward unanimous agreement by the informed as a sign of dogma as opposed to robustness of the conclusion.
]]>A matter of curiosity from this point is to decide how much of the total greenhouse effect is partitioned between various radiatively active substances in our atmosphere. That is, how much of the natural greenhouse effect is fractionally supported by water vapor, by CO2, etc
There are a number of sources of confusion out there on this issue. For instance, this source claims that water vapor makes up 95% of the total greenhouse effect (in fact, it does so confidently that it actually says 95.000%, a good lesson in abusing significant figures and precision for lower-level science students, see Robert Grumbine’s post a couple years ago). Other secondary sources give numbers like 97 or 98%. Lindzen (1991, Quart. J. Roy. Met. Soc) gives an estimate in this range, although it is not clear where he gets his value from. Coby Beck here in a rebuttal to this claim asserts that “CO2 contributes anywhere from 9% to 30% to the overall greenhouse effect,” presumably giving the impression that there is a 21% disagreement amongst sources and experts out there. Still further, many people incorrectly extrapolate the effect of CO2 on the total greenhouse effect to deduce the forcing you’d expect with a doubling of CO2, or use similar arguments in relation to how we expect feedbacks to behave as the current climate warms.
Table 3 of the famous Kiehl and Trenberth (1997) [PDF] energy budget paper attempts to partition the various gases/clouds by percentage; RealClimate breaks down the contributions in this link while pointing out how water vapor is a feedback and not a forcing (see here for a summary). Values presented here are similar to Ramanathan and Coakley (1978).
Nonetheless, getting a clear account of all of this has remained elusive, especially as the most relevant source seems to be a 2005 blog posting. Some of the folks at NASA GISS including Gavin Schmidt and the radiative transfer guru Andy Lacis (along with Ruedy and Miller) have attempted to correct this situation, with a 2010 paper in JGR that is in press here [PDF]. I will attempt to summarize here.
Sorting this problem out is actually not very straightforward although it can be done with a radiation model. As an analogy, imagine having a large pile of laundry on the floor, with dirty shirts, towels, and pants. Suppose we’re interested in asking what fraction of the floor is covered by each individual item.
The total extent of the whole laundry pile has a rather well-defined value. However, asking about the individual contribution for each item is a tougher question, in part owing to the complex overlap between the various clothes. You can pull out all of the shirts (for example) from the pile and spread them on the floor individually and get an estimate for the area that they now cover. This would, however, dramatically overestimate the fractional contribution that the shirts originally had in the pile. Alternatively, you can pull out an item, and examine the extent of the new pile and you might come up with an underestimate for the importance that clothing article previously had.
Similar to the dirty laundry pile, greenhouse gases exhibit complex spectral overlap (primarily by water vapor and clouds, and in second by water vapor and CO2). The maximum effect would be if the greenhouse gas were acting individually, while the minimum effect would be when only that agent is removed, and these numbers can be quite different (as in the Coby Beck example). What’s more, if you removed two agents together (say water vapor + CO2) the effect would be different than if you remove CO2, put it back, remove water vapor and put it back, and then record the sum of those two effects (ignoring feedbacks such as water vapor dependence on temperature). In particular, the sum of the e ffect of each absorber acting separately is greater than if they act together.
The greenhouse effect is defined by the difference in upwelling radiation flux at surface and the flux at the top of the atmosphere. With no greenhouse effect, this difference is zero. In the present-day climate, this difference is about 155 W m-2; this atmospheric absorption and emission is what drives the ~33 K enhancement of surface temperatures above the no-greenhouse (and constant albedo) case. The authors define the change in this long wave flux reduction as their metric for the greenhouse effect, and add various gases individually to a greenhouse-free atmosphere or remove them individually from the modern (well, 1980) greenhouse atmosphere.
So what do they find?
First off, water vapor accounts for 39% of the net LW absorption if removed (so taking out the vapor would make the longwave absorption go down to about 60% of its present value), and 62% if acting alone; in that order, clouds make up 15 and 36% and CO2, 14 and 25%. All of the other greenhouse gases are very minor. In terms of the percent contributions after allowing for overlap effects when discussing the individual agents in the atmosphere, here are the numbers that should be cited:
Water Vapor: 50%
Clouds:25%
CO2: 19%
Other (ozone, methane, etc): 7%
For a cloud-free atmosphere, the numbers are 67%, 24% and 9% for H2O vapor, CO2, and others. These numbers are within a few percentage points of previously published estimates (or multiply by 155 to get the contribution in W m-2 flux reduction).
As one would expect, there is also variation over the globe. Water vapor for instance accounts for ~55% of the greenhouse effect in the tropics and ~40% at the poles where it is much drier.
The radiative forcing for a doubling of CO2 in this paper is about 4 W m-2, slightly above the detailed line-by-line calculations used in Myhre et al (1998) and cited in the IPCC 2001 and 2007 reports. The “forcing” for a doubling of water vapor would be about 12 W m-2, although clearly we don’t speak of water vapor as a forcing since its concentration is rapidly regulated by temperature. Indeed, the extra long wave absorption in the atmosphere is not 4 W m-2 when you double CO2, but more around 20 W m-2 illustrating the importance of positive feedbacks.
Some words of caution now. You cannot linearize about the greenhouse effect and project CO2’s percent contribution to the total greenhouse effect onto what you’d expect for a doubling of CO2.
To illustrate this, consider what happens if you remove all the CO2 from the current atmosphere. With no feedbacks operating, the planet would cool by ~7 K, as opposed to warm about 1 K if you double CO2.
Once you include feedbacks, removing CO2 from the current atmosphere in the GISS model at least cools the planet by ~35 K after water vapor and albedo kicks in, and triggers a snowball Earth where the whole planet is ice covered. This is consistent with other model studies (Voigt and Marotzke, 2009); in this case a snowball Earth is initiated by either reducing the solar insolation by 6-9% or by reducing the CO2 to 0.1% of its pre-industrial value, although for the CO2 this is a just a single run and they do not consider what other CO2 levels might also trigger a snowball. CO2 levels below, say, 100 ppm do not appear to be realistic in Earth’s history.
It should be noted following this that the canonical “33 K” temperature enhancement by the greenhouse effect is artificial, since it assumes the planetary albedo does not change when you add or remove the greenhouse effect. In reality, removing the greenhouse effect would greatly enhance the surface albedo from expanded ice cover allowing the planet to cool well below the “255 K” effective temperature.
Finally, all of this further reinforces the importance of feedbacks on climate, and that the very popular claim of “water vapor being the most important greenhouse gas” is a bit misguided, even if it is the largest source of infrared absorption in the current atmosphere.
Removing all of the water vapor from the atmosphere (and not replenishing it) would trigger a snowball Earth as well, but the non-condensable greenhouse gases (those which don’t precipitate from the atmosphere under current Earthlike temperature and pressures) such as CO2 would still be able to support a surface temperature of about 10 K higher than it otherwise would be. If you remove the CO2 and other GHG’s however, then you’d also lose a substantial part of the water vapor and cloud longwave effects, resulting in a near collapse of the terrestrial greenhouse effect. A significant water vapor greenhouse effect would not be sustainable without the “skeleton” provided by the non-condensable greenhouse gases, although it is obviously a significant amplification factor, both for the total greenhouse effect and its change in the future. It’s thus like the “skin” on a human or animal which needs the skeleton to hold it up, but provides the extra form and protection that we need to survive. This forcing-feedback distinction also makes CO2 the fundamental driver of global climate change (at least insofar as alterations to the optical characteristics of the atmosphere are concerned). See for example, Richard Alley’s AGU talk which focuses on CO2 as the largest control knob of climate change over geologic timescales. The water vapor is just dragged along with the temperature change, but then substantially amplifies any forcing to help provide the full magnitude of the temperature fluctuations; this is also a reason cold climates tend to be much drier than warmer ones.
All of this is moreso academically interesting than anything. Obviously we don’t live in a world where we are plucking out CO2 all together and then adding water vapor, or having a world where you can have clouds without water vapor, etc…but it should help to put into context the primary (water vapor, clouds, CO2) and secondary factors to the greenhouse effect, and put into perspective the important distinction between a forcing and a feedback.
Finally, claims that water vapor is 95% of the greenhouse effect in our atmosphere is just wrong, and the number cited in the Schmidt et al (2010, still in press) paper is so far the most explicit and detailed partitioning between the various gases/clouds (note that clouds on net cool the planet through albedo, although the study focuses on long wave greenhouse effects). The numbers might make the idea that CO2 is important to climate change more intuitive. For example, if the mean value is 20% of the greenhouse effect instead of just a percent or so, then you might think changing its concentration may be more meaningful…but keep in mind that sensitivity arguments must be evaluated on the basis of the change, and not the total greenhouse effect.
]]>In light of recent attempts to describe the physics of climate change from first principles and in an accessible way (see Rasmus’ recent posts at RealClimate on the greenhouse effect and the troposphere) (also , here and here) it is worthwhile reviewing one of the greatest uncertainties surrounding climate change science and future predictions in a similar fashion: climate sensitivity and feedbacks. Feedbacks can behave in odd and counter-intuitive ways, some of which require some mathematics to really appreciate. In order to help facilitate an understanding for those who receive information at different levels of understanding, this will be a 2-part endeavor, where part 2 will be the more ‘technical version’ which may not necessarily be for everyone but will help demonstrate claims in part 1 quantitatively.
The most simple climate model features a globally-averaged outlook with a planet in radiative equilibrium (where the sunlight absorbed by a planet must equal the outgoing infrared radiation lost). This is the fundamental boundary condition that all planets must satisfy on long-term timescales, except in the case of gaseous planets where internal heating from gravitational contraction can also be significant. We also allow the troposphere of a planet to convect in order to establish a lapse rate (temperature decrease with altitude) somewhere near an appropriate adiabatic lapse rate (the lapse rate is set by convection in the tropics to stay near a moist adiabat, the controls in the mid-latitudes are a bit more complicated but usually the atmosphere is always somewhere between ~6 and 10 K / km decrease with height).
From here, climate scientists distinguish between radiative forcings and feedbacks, both of which involve various agents that can alter the global-mean radiative budget (and thus temperature) of a planet.
A forcing is a change in some variable that alters the planetary energy budget (e.g., sunlight, CO2, volcanic eruptions) by modifying the incoming sunlight, the ratio of absorbed to reflected sunlight, or by changing the rate of outgoing longwave radiation to space; however, forcings themselves can be considered to be independent of the current climate (e.g., the sun doesn’t really care what is happening on Earth, and aside from possible subtle effects of an ice sheets weight on the land surface or something like that, volcanic eruptions don’t really care what the current climate is like either). Radiative forcings will be expressed as a surface temperature change only if they are large enough or persistent enough to overcome the large heat capacity of the ocean.
Feedbacks, on the other hand, change only in response to an underlying climate trend and then further modify the radiative budget. This can amplify the initial forcing (positive feedback) or dampen it (negative feedback). The distinction also depends on the timescale; greenhouse gases for instance are generally feedbacks over millennia since the carbon cycle can easily be perturbed, by say, orbital changes while fossil fuel combustion is clearly a much faster process and is external to the climate system.
The most important feedback in the present-day climate is the nearly exponential increase in the water vapor mixing ratio in the upper atmosphere with global warming (which scales with the Clausius-Clapeyron relation to the extent relative humidity is conserved). Water vapor is a feedback since it is also a good greenhouse gas, yet the processes of evaporation, condensation, and precipitation occur on timescales of days to weeks and are highly temperature dependent. In informal terms, we say that a warmer atmosphere can ‘hold’ more water vapor. Caution should taken in popular and ill-defined statements like ‘water vapor is the most important greenhouse gas’ because while it is the largest single source of infrared opacity in the atmosphere (contributing to about 50% of the infrared absorption) the skeleton of the greenhouse effect is provided by CO2, CH4, and other such non-condensable greenhouse gases that do not precipitate from the atmosphere under Earthlike conditions. If you could remove all the water vapor and clouds from the atmosphere, the non-condensable greenhouse gases would be able to support a temperature nearly 10 K above the baseline “effective temperature” of 255 K that the Earth would have with no greenhouse effect (assuming constant albedo in all of this). However, removing all of the CO2 would also make you lose most of the water vapor feedback and substantially increase the surface albedo as the climate cooled, resulting in a collapse of the terrestrial greenhouse effect and a temperature even colder than the 255 K effective temperature. The distinction between forcing and feedback is therefore not merely semantics, it’s a fundamental difference in how geologists look at the basic causes of geologic timescale climate shifts (which is ultimately provided by CO2 mostly, probably methane on early Earth, and competing with the greenhouse effect on geologic timescales is a gradually brightening sun which has gone up by ~25% in luminosity since Earth’s formation) versus those factors which amplify the climate shifts and allow the magnitude of the past climate trends (and variability) to be explained.
Note also that the water vapor concentration typically increases more rapidly than evaporation or precipitation, an effect manifested as an increase in the mean residence time of a water vapor molecule in the atmosphere and a decrease in the rate of exchange between water in the lower atmosphere and the upper atmosphere (this is most readily detected in observations as a weakening of the tropical Walker circulation).
It is sometimes assumed that net positive feedbacks imply an unstable system, perhaps one that runs away until the Earth became as hot as the sun itself. To see why this need not be the case, at least in the climatological notion of a feedback, it is instructive to consider a scenario in which there are no feedbacks operating and the only global temperature change came through the applied radiative forcing. In this case, once the temperature changes the only thing that can restore the planet back to radiative equilibrium is the changed outgoing infrared energy (in the strict sense, this is a feedback, but climate scientists usually don’t group it with other feedbacks since it’s a pre-requisite to coming back to equilibrium). It can be shown (see part 2) that in this case the planet will warm or cool by about 0.27 °C for every W/m2 radiative forcing. In practice, the value is a bit higher than this owing to the fact that the atmosphere absorbs some finite amount of radiation, so with the 3.7 W/m2 forcing you get from a doubling of CO2 the result is a ~1.2°C temperature rise. The no-feedback response is obviously not an observable quantity since it is unphysical, but the precise magnitude will differ very little amongst various radiation models or methods used, and is due to different atmospheric properties (such as cloud treatment) and independent of the land surface physics.
Whether a feedback is positive or negative is defined relative to this ~0.30-0.31°C/(W/m2) baseline, the so-called ‘Planck response’. You can think of positive feedbacks as a series of gains where each gain is smaller than the last, so the series eventually converges without running away, yet still allowing a temperature change to exceed the Planck-only case. This is what is most relevant for modern-day Earth, but it is not inevitable. If the solar radiation absorbed by the planet is sufficiently high, it is possible that the temperature increase via the greenhouse effect from water vapor overcomes its ability to condense out when the pressure is high. Greenhouse gases effectively make a plot of the outgoing long wave radiation (OLR) vs. temperature more linear than the T4 dependence from the Stefan-Boltzmann law. If the optical depth due to water vapor is sufficiently deep it is possible for the OLR to be completely decoupled from the surface temperature (See figure) , something commonly known as the Simpson-Kombayashi-Ingersoll (SKI) limit after its discoverers. In the event that the absorbed solar radiation exceeds this threshold, the Earth will heat up and the OLR will not be able to increase in order for equilibrium to be established. In this case, the planet becomes incompatible with oceans and the runaway greenhouse process begins.

Pierrehumbert, 2002
This runaway process is not something that can happen on Earth anytime soon. Evidence from past climates and GCM results indicate the actual temperature change will be the Planck response amplified by a factor of anywhere between 2 and 4, which implies a system where positive feedbacks are predominant over negative ones. To introduce another term, we can thus say the climate sensitivity (the ratio of the temperature change to the forcing) is higher than it otherwise would be.
Interaction of Feedbacks
When multiple feedbacks are present, they can add and interact in very strange ways. If you have two positive feedbacks for instance, each of which enhance the no-feedback sensitivity by an extra 50%, they will combine to enhance the no-feedack case by 300%! As another example, you may think that if you take a positive feedback which doubles the no-feedback temperature change, then take a negative feedback which halves the no-feedback temperature change, and add them together the net result will bring you right back to the Planck-only response. This is not actually the case, and the departure from intuition grows as the magnitudes of the feedbacks grow. The key here is that feedbacks work off of each other, so if you have two positive feedbacks of the same size, you can’t just multiply by 2 to get the total, since they will reinforce each other and further amplify the initial forcing.
Feedbacks can also allow two planets with the same solar insolation and the same greenhouse effect to have two radically different climates depending on the history it took to get to that point. Suppose we accept that the albedo of Earth is dependent upon temperature, which is the case as the ratio of highly reflective ice/snow extent to highly absorbing ocean/land extent changes in time. Cloud cover also plays a role.

Colored curves: Green = Solar constant = 1370 W/m2; Red = 2740 W/m2; blue = 685 W/m2 (values on y-axis are divided by 4 to account for spherical geometry of the Earth and the albedo parametrization described in post). Dashed black lines are two OLR curves for no greenhouse effect (top line) and one with a parametrized greenhouse effect
Figure 2 shows three colored plots; the green line corresponds to a solar insolation value of S0=1370 W/m2 (with the blue and red lines, half and double that, already weighed by the ¼ geometrical cross-section factor) with a parametrized albedo that is bounded between 0.2 (warm climate) and 0.6 (cold climate) and is linearly interpolated between those values between T=263 and 283 K. The dashed black lines are the OLR curves for a no-greenhouse scenario (top curve) and one in which the greenhouse effect forces the planet to radiate at 60% efficiency for some given temperature. Where the curves intersect corresponds to a possible climate state. Note that the 0.5* S0 case is always locked in a cold-snowball regime with this greenhouse effect. For the modern solar insolation value, only the greenhouse effect scenario is consistent with a stable, warm climate. With no greenhouse effect the Earth would be in a snowball state. The 2* S0 scenario is always in the warm state however. Note however that because of the ice-albedo feedback, the ‘snowball planet’ case is a plausible mathematical solution with current solar and greenhouse parameters. If the Earth were magically thrown into a snowball state, it would not escape unless the greenhouse effect became substantially stronger or we waited for millions of years for the sun to brighten enough.
The key to understanding the ice-albedo feedback in the present day climate is the seasonality between absorbed solar radiation in the warm months and the release of heat by the ocean to the atmosphere in the cold months. Specifically, low-albedo open water will develop earlier in the melt season, and these areas will strongly absorb incoming sunlight. In the summer itself, there isn’t much surface-air amplification owing to a lot of energy being dedicated to melt or evaporation rather than temperature increase. At the close of the melt season, there is now higher heat content in the ocean mixed layer and a delay of sea ice formation in the cold months, increasing the vertical heat flux from the water to overlying air. This effect becomes more pronounced as the sea ice extent declines over the decades. Cloud cover also matters for the surface albedo feedback since they can efficiently scatter radiation and limit the effect of changed ice extent at the underlying surface, but also by enhancing downwelling infrared energy to the surface. The following figure shows how surface-air temperature anomalies evolve as a function of season over the next century, with a substantial summer and spring signal not emerging until later on, and an already Autumn amplification emerging.

NCAR CCSM3 depictions of: (a) near surface (2 m) temperature anomalies by month and year over the Arctic Ocean, and (b) latitude by height dependence of zonally-averaged October–March temperature anomalies for 2050–2059. Anomalies are relative to 1979–2007 means. From Serreze et al., 2009
The strength of Earth’s greenhouse is also sensitive to the strength of the lapse rate, going to zero greenhouse effect in an isothermal atmosphere where the surface temperature is equal to the emission temperature. It is expected that in the tropics, the moist adiabatic profile will shift toward warmer values so that the upper atmosphere warms more than the surface, thus reducing stability. The changed lapse rate is a feedback since now the bulk of the atmosphere radiates to space at a temperature warmer than it otherwise would have, which provides a cooling effect than can partially offset the water vapor feedback (or a warming effect that offsets a cooling water vapor feedback if the climate is in a cooling trend).

Held and Soden, 2006
Cloud changes are also a feedback since they modulate the flow of energy on both the incoming and outgoing side of the energy budget. Because both of those terms make up very large effects of opposite magnitude, they nearly cancel in the present-day climate but small errors in the relative effects can lead to large implications for climate sensitivity. It is well accepted that cloud feedbacks make up the bulk of uncertainty amongst the feedbacks in estimates of climate sensitivity, particularly on the shortwave side (which is dominated by low clouds that control the albedo more than other kinds). The longwave component of the cloud feedback is generally always positive in models.
I will try to make Part 2 available within the week or so…stay tuned.
]]>https://www.nap.edu/catalog.php?record_id=12782 ]]>
RealClimate is a high quality science website, and by now a lot of people in the scientific community are aware of its existence and it is quite common to find links to it on various academics’ homepages or university course sites. RC attracts people with all sorts of background, including
1)wingnuts who know nothing and have no desire to
2) curious students who want to learn more but don’t currently have background in atmospheric sciences or math/physics
3) curious students who know a fair amount of technical detail and still want to learn more at a somewhat high level
4) Overlapping somewhat with the last group are those commenters who know enough to answer general questions with high confidence. They are not necessarily “experts” but have been initated into the language of the field, have experience reading the primary literature or going to academic conferences, and would have the ability to speak authoritatively about certain issues to non-technical audiences. These people can stimulate very interesting discussion within the comments and clarify points of confusion that people in the previous categories have, making it much easier on the scientists such as Rasmus or Gavin from having to respond in detail to everything. “Moving forward” in understanding is probably the most difficult for this group because by this point, the resources which are easily accessible (e.g., the web) are no longer highly educational and any further detail will likely require taking several years to go to grad school or delve into upper-level textbooks.
5) Finally, there are experts who have spent decades working in the field and have learned (and work with) the very fine details of the topic in question, and can thus discuss the very nitty gritty if the comments happen to ever reach that point.
One can expand and sub-expand upon these…perhaps including children and high school age people who you want to get “listening” without overwhelming with technical details. How one falls into such broad categories of course depends on the specific topic. One can be in the last category and have expertise in ice core research yet fall in the second to last category and only have a “good enough” understanding of radiative transfer. Group 3 in particular is likely to encompass engineers, biologists, chemists, etc….people who can follow scientific arguments but don’t necessarily know a whole lot about climate change. Presumably group 2 encompasses the vast amount of readership on the climate blogosphere, and is probably a good target audience for popular discussions of the greenhouse effect. Outside of RealClimate and other sites, there is of course a much larger group in the real world: those who don’t even think about climate change. This is most people. At most you might get a few words muttered about global warming at the dinner table, maybe from watching Al Gore, but for this group it’s an issue isolated from them and not within their scope of interest. It’s not my intention in this post to describe how to get this group listening, but that’s clearly a big subject for another discussion.
I believe that it is necessary to have information available at different levels of sophistication, particularly for those people who already know the basics and want to move past simple “cartoon diagrams” of the greenhouse effect, yet at the same time have no desire to read literature at the level of Goody and Yung or go through the integrated forms of the Schwartzchild equation describing the transmission and emission of radiation through a medium.
Communicating to group 1 is not possible. It is insane to presume one can teach someone that has no intention of learning, or that you can fill their “knowledge cup” with water when it is already full of mud. It is still worthwhile to respond to their criticisms, not for group 1’s sake, but to help people in the other groups sort fact from fiction while simultaneously enhancing their own knowledge.
Concerning Rasmus’ post at RC, it is appropriate to introduce the basic concepts of radiant heat transfer (described by Planck’s law), global energy balance, the type of molecules which absorb IR, and build this up to optical-depth type of thinking. This was a good approach. It is also unclear to me who the target audience was. There was a good quote however in comment #55 by the poster “wili” who stated
It reminded me of old “Scientific American” articles from the ’70’s that I would struggle to understand as a highschooler and college student. Often I didn’t get past the first page or so, but if I really worked at it and talked about it with my nerdy, more-scientifically-literate friends, I could usually figure out most of it and felt better for the mental exercise.
Now I realize many readers may not have access to nerdy scientific friends, although RC has a comment board where it is easy to ask questions, discuss amongst groups 2/3 who can share links and ideas, and obtain answers from groups 4/5 (who also serve to to push groups 2 and 3 in the right direction should their well-intentioned curiosity start to take them to wrong answers). The argument that the post is “too technical” is not convincing, and as wili points out, work of this sort can serve as a great mental exercise for those curious about building up a more complete understanding. The post itself links to many external resources as well as other RC posts covering the same topic from different angles. This, with the help of fellow peers on the comment board, should allow most people to work through the logic of Rasmus’ post.
If the object is to use Rasmus’ approach in more accessible venues, such as general talks to college students at universities, secondary media outlets, etc then I think it is a good one although with some trial and error modifications. It is a good approach to build up a step-by-step case for the greenhouse effect and global warming where each step can be understood completely and without complicated jumps in logic. It is also reassuring to know that the argument for global warming stems from physics which has its roots in pioneering work that is over a century year old; it does not only emerge in complex computers, nor is it a “hunch” by scientists who simply seen a temperature-CO2 correlation and declared that it must be causative.
The part about feedbacks and stratospheric cooling tends to mesh discussions which are typically associated with the “amplified greenhouse effect” instead of the natural greenhouse effect itself. There is no reason they need to be exclusive, but they serve as an unnecessary point of confusion. Stratospheric cooling is sometimes helpful to point out, upon further questioning concerning the human fingerprint in global warming, but the broad picture of the greenhouse effect is not particularly sensitive to what is happening in the stratosphere. The part about negative feedbacks is unreadable to anyone who didn’t already know what feedbacks are. It is of course not possible to do justice to these details in one concise post (perhaps a multi-part series would have been better?) but if that’s the case then unnecessary complications, following the Einstein quote in the opener, are better left unmentioned.
There are different levels one can understand the greenhouse effect at. For quick and easy descriptions, such as one might communicate to a young audience or for a quick 30-second sound byte at dinner with you parents, you might leave it at “certain gases in our atmosphere absorb heat that is escaping to space making the surface warmer than it otherwise would be.” The most simple visualization is typically one which treats the atmosphere like a single slab of infrared absorbing molecules and is transparent to incoming solar radiation.

This is fine for illustrative purposes. I believe something similar to Rasmus’ post is a good next step up. I find the more sophisticated versions of the greenhouse effect tend to move the focus from a “slab” of molecules radiating energy downward to a focus on the top of the atmosphere energy balance.
Some versions, such as described in David Archer’s “Global Warming: Understanding the Forecast” and Dennis Hartmann’s “Global Physical Climatology” articulate the so-called “layer model” where you throw in a bunch of “layers” at different altitudes which radiate according to their temperature by Stefan-Boltzmann. Often they are assumed to be fully transparent in the visible and a blackbody in the IR, although this does not need to be the case, it just makes for ugly algebra (Grant Petty works through a simple example of non-unity absorptivity and emissivity in a grey atmosphere in his Radiation book). I’m not sure how helpful the “layer model” is and it usually involves a good deal of trickery to get results which make sense (e.g., “one layer still isn’t enough but adding two layers gives you the observed temperature!!”). What does this even mean with respect to the real world?
At still more complete versions, one inevitably needs to account for a convective troposphere and the spectral dependence of absorbing gases. It takes some time to build up an intuition and some higher-level reading in order to discuss the processes involved at this level, but one does not have to be in expert in group 5 to do so. Rasmus’ post serves as a useful bridge for the most simple of descriptions to the more complicated split-spectrum and lapse rate descriptions.
The aim is good communication and this requires information accessible to a broad range of audiences. The reader will have to judge for themselves whether they are equipped with the tools to handle the level of sophistication in any particular description, or how willing they are to learn, but it is very easy to find articulations of the greenhouse effect accessible to almost anyone. But I do like Rasmus’ and others suggestion that a paradigm shift should be made to articulating global warming to lay audiences through the framework of step-by-step physics.
]]>
For a very good overview of some of the basic features of the Venusian atmosphere, I suggest this 2001 paper by Bullock and Grinspoon who discuss the very important role of CO2, as well as the various competitive roles of H2O and SO2 in its climatic history. Goddard, Motl and many bloggers feel that this description is all wrong based on fundamental physical misunderstandings.
From high school mathematics, we know that a straight line can be represented by the equation y=mx + b, where m is the slope, and b is the intercept of the line. It’s important to see that the slope alone cannot tell you the absolute value at a single point, only the difference between two points. It is this that neither Motl nor Goddard can grasp. The lapse rate in an atmosphere without a condensable substance can be derived fairly easily. Starting from the first law of thermodynamics:

and from taking the derivative of the ideal gas law for a mole of substance,

Note that R = cp – cv. Re-arranging, and for an adiabatic process,


Using the hydrostatic equation, where 


This gives the rate of temperature change as one changes altitude. For a dry case on Earth, this equation corresponds to a temperature decline of nearly 10 K km-1. The actual value is somewhat less (closer to 6 K km-1) because the latent heat release of water vapor acts to slow the rate of temperature decline relative to the dry case. Alternatively, in pressure-space, one can use Poisson’s equation to determine the temperature T(p) at some level. For an atmosphere whose temperature profile is given by the dry adiabat, the surface temperature
is
where the exponent is approximately 0.286 on Earth and about 0.23 in a pure CO2 atmosphere. The “rad” subscript designates a mean radiating level. On Venus, the ideal gas law does not hold well in the lower atmosphere, but nonetheless the lapse rate can be found to somewhat resemble that of Earth

Bullock and Grinspoon, Icarus 2001
What the IR heating from the greenhouse effect does is primarily to establish the intercept (e.g., the lower tropospheric temperature) while on Earth convection essentially keeps the atmosphere near some adiabat and thus establishes the vertical structure of the atmosphere. See below for example:

Viewed in terms of mass the tropopause isn’t deeper than on Earth. On both planets, some 90% of the mass is contained within the troposphere. There are two ways to get a very high tropopause though: a low lapse rate or very large optical thickness. The latter is what is important for pushing up the Venusian tropopause so high, well above Earth’s. This rate of change establishes the difference between two layers in the atmosphere. Strictly speaking, a greenhouse effect does not require a surface (a greenhouse effect still exists on the gaseous planets); one simply needs to extrapolate along the adiabat to some new level below prad and using Poisson’s equation one can find the temperature at that level. For Venus, one can see that prad is quite high, since transmission is related to the opacity of the atmosphere in a declining exponential function. This, among many other things, is Goddard’s misunderstanding within his perspective for why the greenhouse picture is “absurd” in his first post. Also, the Venusian surface does receive a relatively small trickle of solar radiation to the ground, and actually this small trickle is very important for establishing the temperature structure of the planet.
There are three lines depicted in the the second graph above. Line “A” and “B” represent the same sloped adiabat, which means that the difference in temperature between the surface and some point in the atmosphere is the same. The difference is of course where the line is shifted which cannot possibly be due to pressure, but rather through energy balance…either because the planet with line “B” has a higher solar constant, a lower planetary albedo, or a stronger greenhouse effect. This falls right from the basic energy balance equation, where

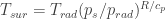
for a planet with a fully transmissive atmosphere (i.e., prad = psur). The greenhouse effect is thus defined as
G =

Since Venus radiates at the surface at several thousands of W m-2 and yet the outgoing radiation is even less than that of Earth, this shows how important a strongly opaque atmosphere influences the planetary surface.
Line “C” in the figure represents a planet with an even higher surface temperature, although with a more mild temperature gradient between two points on the line. This is actually how the negative lapse rate feedback works (which partially offsets the water vapor feedback), since the top of the atmosphere has now experienced a greater change in temperature than the surface, and can become a better emitter. In no case can the lapse rate be the reason for the very high surface temperature on Venus. It is simply not physical for the planet to be hotter than that value set by the incoming absorbed solar radiation in the absence of a greenhouse effect or some internal heat source
Note that pressure does matter for the greenhouse effect. Continuum opacity due to CO2 pressure-induced transitions in the Venusian atmosphere are very important. On a planet like Mars with little atmosphere, very little broadening from collisions makes CO2 a much less effective absorber over a variety of wavelengths. Bottom line is CO2 becomes a much better greenhouse gas at high pressures. In addition, scattering of infrared radiation, unlike Earth, plays an important role in the energy balance.
Another issue that has popped up in discussions is the logarithmic relation between CO2 concentration and radiative forcing. Some have even tried to extrapolate Venus concentrations using a logarithmic law to get some guesstimate for Earth-like sensitivity. This is really apples and oranges. One issue is that you lose the logarithmic relationship at high enough CO2 concentrations. If you put in too much CO2, you make the overall width of the principal absorption region wide enough that you get out into a different shape of envelope which would happen at a significant fraction of Earth’s atmosphere (say, 0.2 bars or so) let alone on Venus. On Venus, a lot of weak bands that are inconsequential on Earth become dominant in determining the changes in OLR. It’s also worth keeping in mind, that CO2 absorption at high wavenumbers which are important on Venus but not on Earth come into play. These are crucial for understanding the main absorption on Venus, and unfortunately, high wavenumber areas are not satisfactorily resolved by databases such as HITRAN.

From R.T. Pierrehumbert, Principles of Planetary Climate, in publishing progress
As a conclusion, the blogosphere has not revolutionized the field of planetary climate or the greenhouse effect. They have made elementary mistakes that would be resolved by taking a basic undergraduate course in atmospheric thermodynamics. Neither Motl nor Goddard understand what they are talking about, and this is just another fad that will be forgotten about soon.
]]>Cheers
]]>
The global climate system is ultimately driven by the radiative balance at the top of the atmosphere and surface energy budget terms. Heat flows from the warm surface to the cold atmosphere and from the warm tropics to the cold equator to help eliminate the gradients that would be produced by radiation alone. The first image below shows the globally and annually averaged heat fluxes. The second shows the latitudinal distribution of solar and terrestrial heat fluxes.

Trenberth et al 2009

For understanding the greenhouse effect (see here) we’re interested in the ability of various atmospheric gases to retard the outgoing infrared energy exiting the planet. We can see how these gases takes “bites” out of the outgoing spectrum (this is upwelling infrared, as would be seen for example by a viewer from space) and thus makes the planet a less effective emitter at a given temperature. We can also look at transmittance, which is essentially one in”atmosphere windows” or zero in strongly absorbing regions.

We can look at the same effect in terms of “brightness temperature.” This is an inverted form of the Planck law. It is noteworthy that in regions where gases do not really absorb strongly (say, 8-12 microns) that a viewer looking from space would see radiation coming from the surface, at the hot temperature of the surface (close to 290 K). In strongly absorbing regions, a viewer from space does not need to look very far down and will see radiation emanating from higher, colder parts of the atmosphere.

Of prime importance to us is increases in global temperature. A fairly standard time-series showing the evolution of temperature anomalies (i.e., the departure from some arbitrary mean value, in this case the 1951-80 climatology) is:

This can be decomposed into hemispheric contributions, as seen below:

These images were obtained from the NASA GISTEMP page, as are some sample outputs produced below, which show a global map of temperature anomalies so that one can see the zonal and meridional structure of global warming.
This plot is for 1995-2009 anomalies relative to the 1951-1980 mean.

And a 2000-2009 anomaly map

In understanding this temperature rise, we are interested in the radiative forcing of various agents, such as fluctuations in greenhouse gases, anthropogenic aerosols, solar flux, and volcanoes. Radiative forcing is a useful tool to compare the influence of different things on a side-by-side basis:

https://www.yaleclimatemediaforum.org/pics/0108_radiative_forcing.jpg
Positive forcing indicate warming influences, and negative forcings, cooling influences. More detail here. As we can see, aerosols have done a considerable job at offsetting greenhouse warming, but they also have a lot more uncertainty associated with them. There are some examples of the global distribution of radiative forcing. For instance, a model output of the RF from CO2 from 1880-2000 reveals that the RF is not completely uniform over the globe

This is a result of the increase in CO2 over industrial time, plotted below

https://www.esrl.noaa.gov/gmd/ccgg/trends/#mlo_full
There is a very clear upward trend in CO2, as well as a beautiful annual cycle associated with the disproportionate vegetation responses between hemispheres over a year. We can see a human-induced fingerprint in the rise of atmospheric CO2 by looking at the decline of oxygen, which is a result of combustion, as well as a decline in C13/C12 ratio which is consistent with burning fossil fuels:

IPCC 2007 chapter 2, thanks to Jim Eager for suggestion
To-date and projections of future CO2 emissions are below in GtC yr-1. We are currently tracking on the high end of various economic scenarios:

Copenhagen report, 2009
pCO2 can be reconstructed from the trapped air in the bubbles of ice cores in Antarctica (they do not currently use Greenland for CO2, maybe some hope in the future), but the longest record in ice cores can go back 800,000 years.

Luthi et al 2008, Nature
Currently, CO2 concentratios are at 390 ppm, much higher than at any time in that record. This can also be put into the context of radiative forcing over long periods of time. For example, this plot shows the evolution of concentrations and the RF from CO2, methane, and nitrous oxide over the last 20,000 years.

Joos and Spahni, 2008, PNAS
Over the last 400,000 years, we can look at the evolution of concentrations and forcing, as well as sea level.

Hansen et al 2008
Here is the CLIMAP reconstruction of surface conditions of the LGM oceans relative to modern SST’s.

This plot is current best estimates of Northern Hemisphere temperatures over the last few millennia,

Mann et al 2008
The sea level rise over the last few decades is also large, coming in at over 3 mm yr-1. Here is a plot showing a recent time-series of sea-level rise with the seasonal cycle removed

see https://sealevel.colorado.edu/
As we’ve seen, greenhouse gases are the largest radiative forcing agent since pre-industrial time. Other things do matter though, and studying them is important. Here is a plot of solar intensity over the last few decades:

see https://www.pmodwrc.ch/pmod.php?topic=tsi/composite/SolarConstant
There has been essentially no secular trend in solar irradiance over this time, although there is a clear ~11-year cycle.
This is an interesting figure showing the amount of CO2 taken up by the oceans to 1994. The interesting thing to note is the North Atlantic, which represents a relatively small area of the global ocean, has taken up a disproportionately large amount of carbon (25% of inventory with 15% of area)

We can also get a feel for the penetration depth of CO2 in the ocean. Because the ocean mixes slowly, most of the CO2 is in a relatively shallow region. The deep mixing in the North Atlantic, which explains the phenomena is the preceding figure, is evident here:

Mauri Pelto has suggested some of these images of glacier mass balance over time:

https://www.nichols.edu/departments/Glacier/global%20glacier%20mass%20balance.htm

https://www.nichols.edu/departments/Glacier/global%20glacier%20mass%20balance.htm

https://www.nichols.edu/departments/Glacier/global%20glacier%20mass%20balance.htm
The rest of these images I just have for making them clickable somewhere else, sorry for lack of descriptions
Bifurcation diagram for temperature vs. CO2 (Pierrehumbert et al, 2011)

Modeled changes in a atmosphere free of non-condensing greenhouse gases (CO2, methane, etc, Lacis et al 2010)


CO2 Absorption features showing non-saturation


These following graphs have no physical significance…I’m placing them here for a bookmark only, do not cite:


]]>