| CARVIEW |
Radically better observability stack
Incident management meets observability.
At a fraction of the cost of competitors.
Datadog bill too high? Migrate today, the rest of your contract is on us.
Migration assistance and bespoke onboarding included.
Book a consultation


Tracing
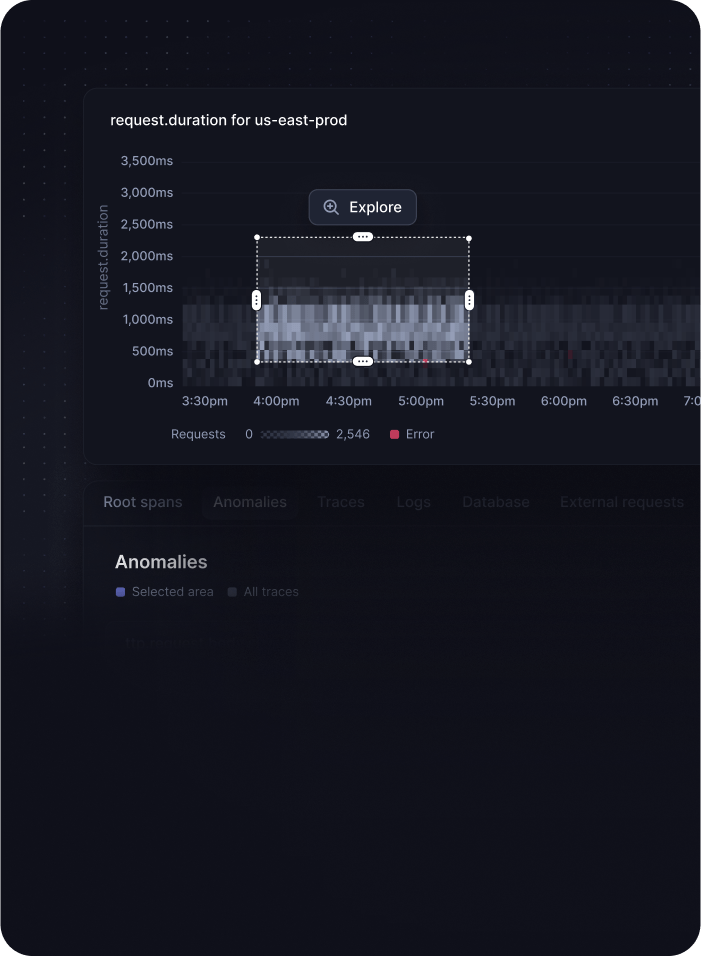
Explore with "bubble up"
Investigate slow requests visually with drag & drop to find root cause.
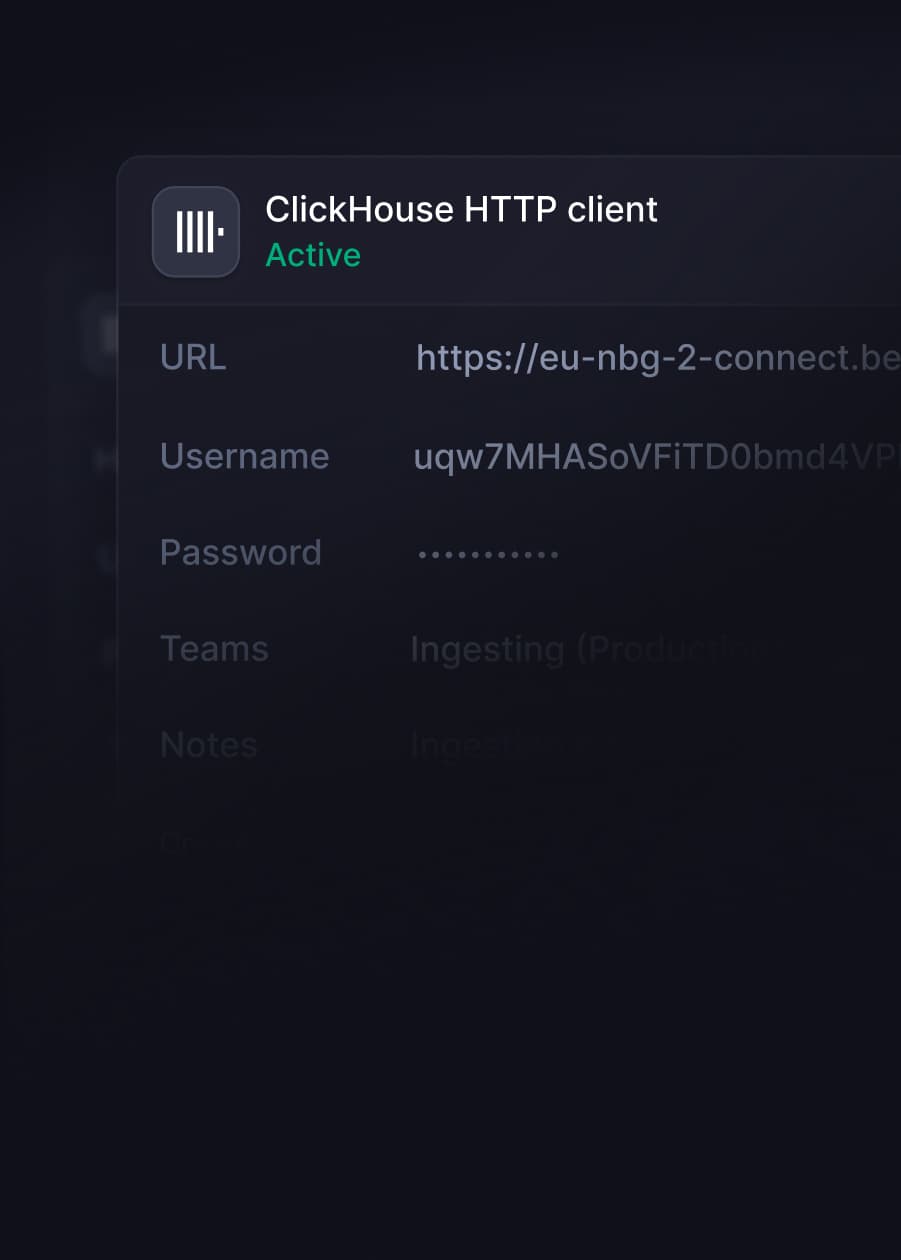
Instrument clusters with OpenTelemetry with no code change
Gather traces, logs, and metrics using eBPF and OpenTelemetry. Remotely monitor collector’s throughput and adjust sampling, compression, and batching as needed.

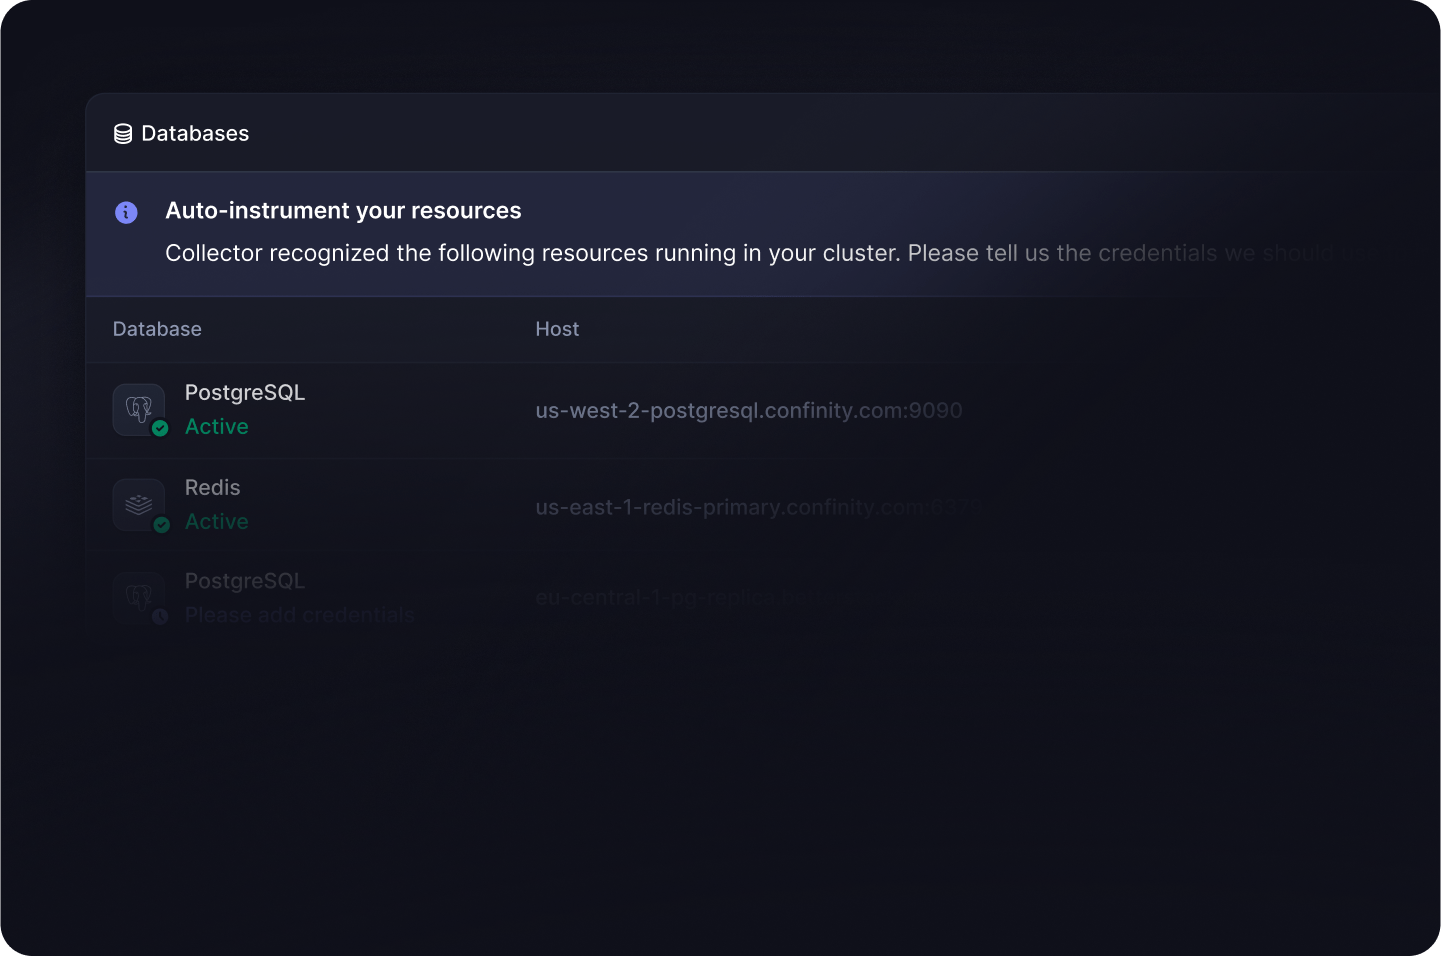
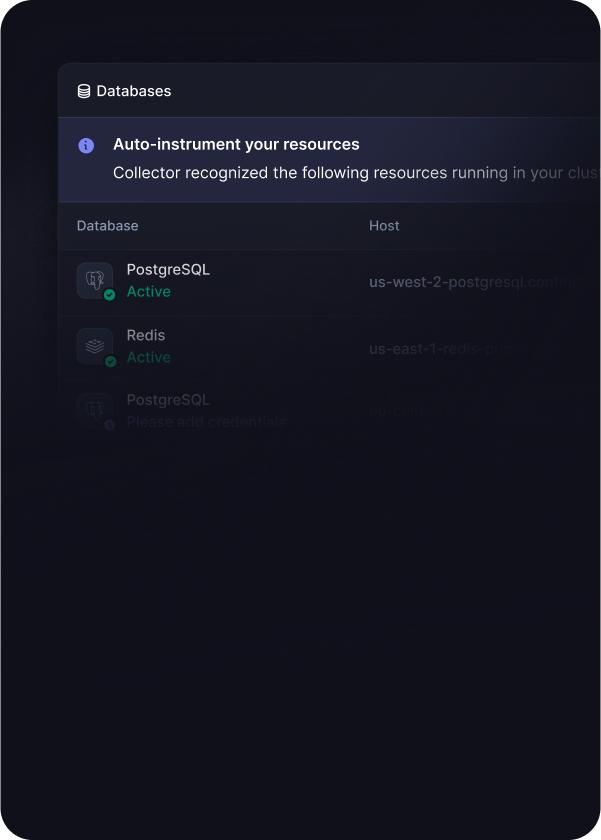
eBPF-based service map
See network flows, auto-instrument databases, and track SLOs.
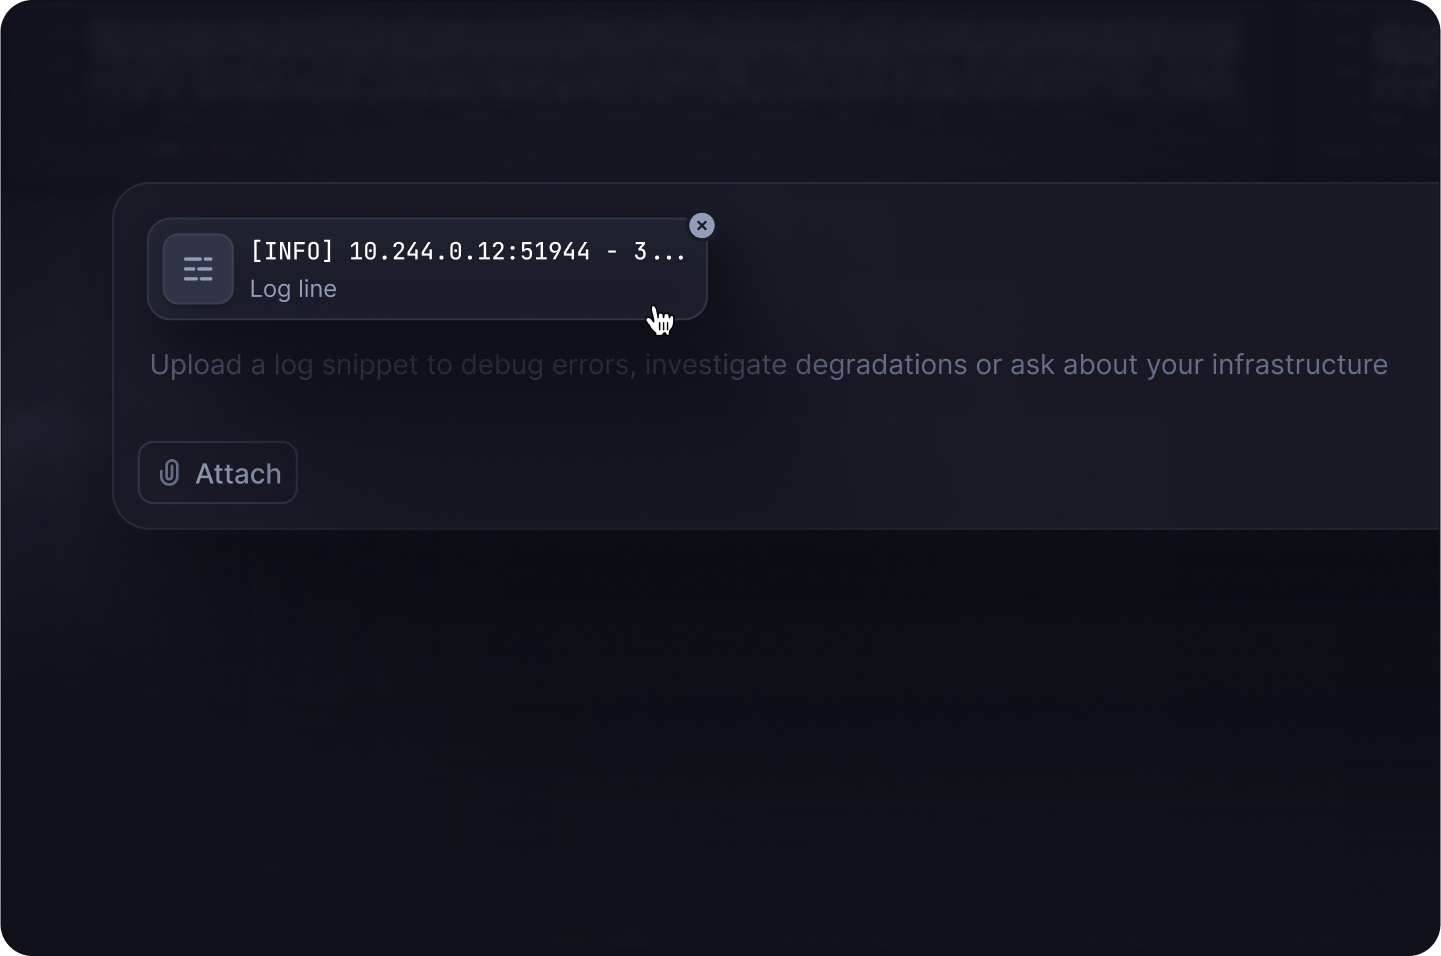
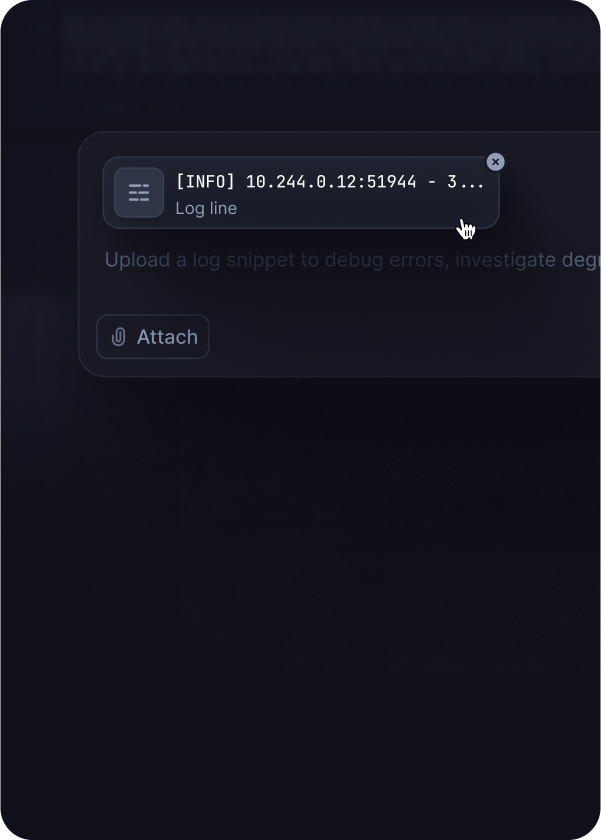
Get a “Cursor for SREs”
Leverage automated root cause analysis based on the eBPF-based service map and log analysis. A human is always in charge.
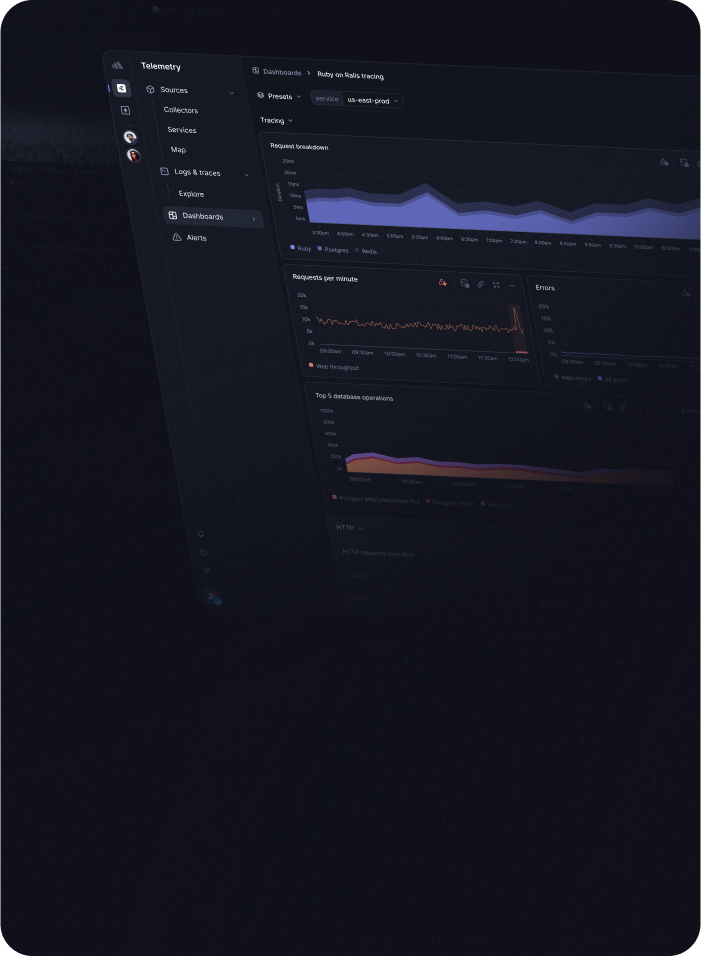
Request breakdown, Apdex, and RED metrics
Understand the overall health of a service in a single dashboard.
Tracing
Explore with "bubble up"
Investigate slow requests visually with drag & drop to find root cause.
Instrument clusters with OpenTelemetry with no code change
Gather traces, logs, and metrics using eBPF and OpenTelemetry. Remotely monitor collector’s throughput and adjust sampling, compression, and batching as needed.
eBPF-based service map
See network flows, auto-instrument databases, and track SLOs.
Get a “Cursor for SREs”
Leverage automated root cause analysis based on the eBPF-based service map and log analysis. A human is always in charge.
Request breakdown, Apdex, and RED metrics
Understand the overall health of a service in a single dashboard.
Incident management
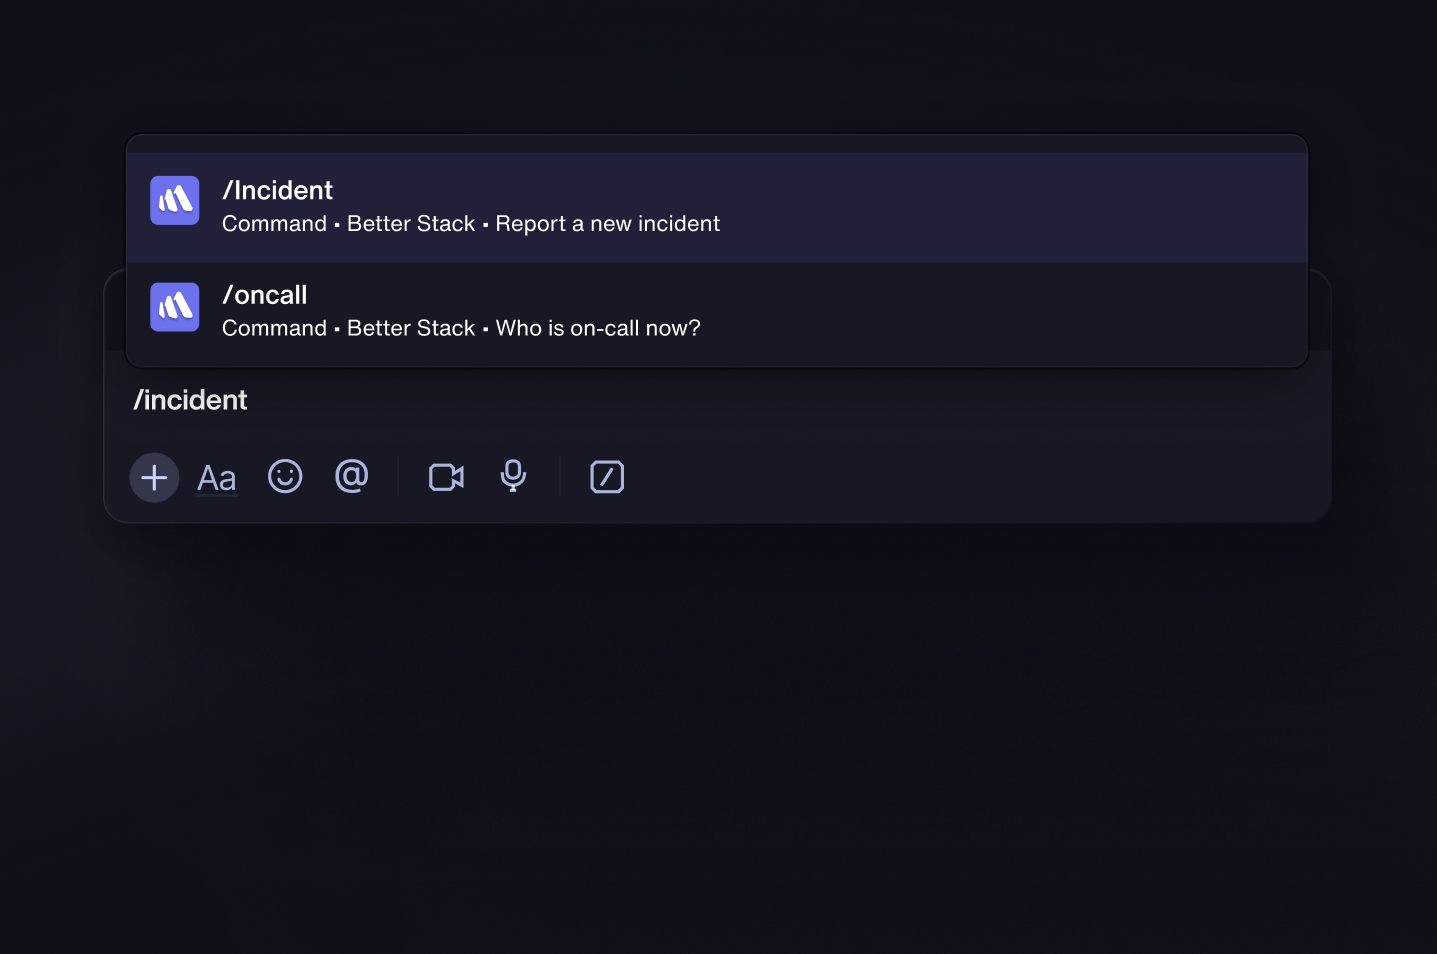
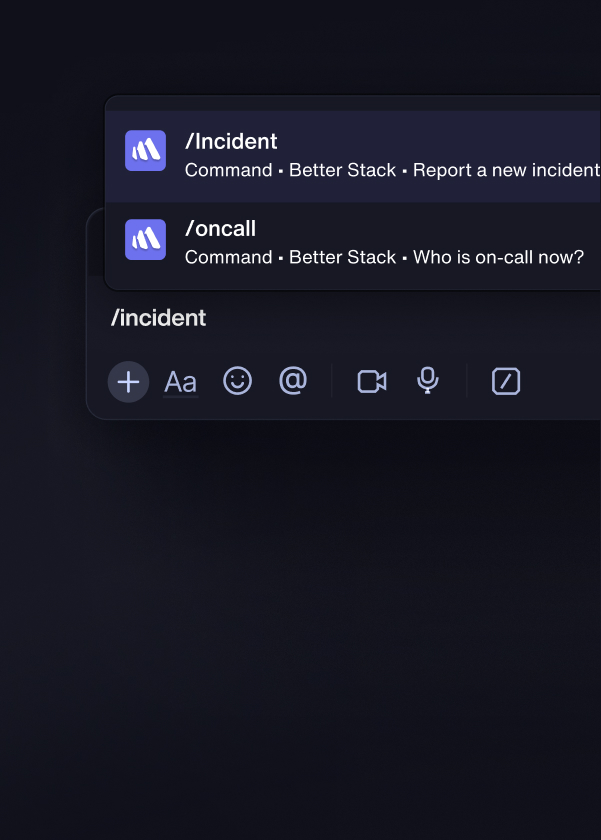
Slack-based incident management
Get the right team members involved with powerful templated workflows directly in Slack and decrease your MTTR.
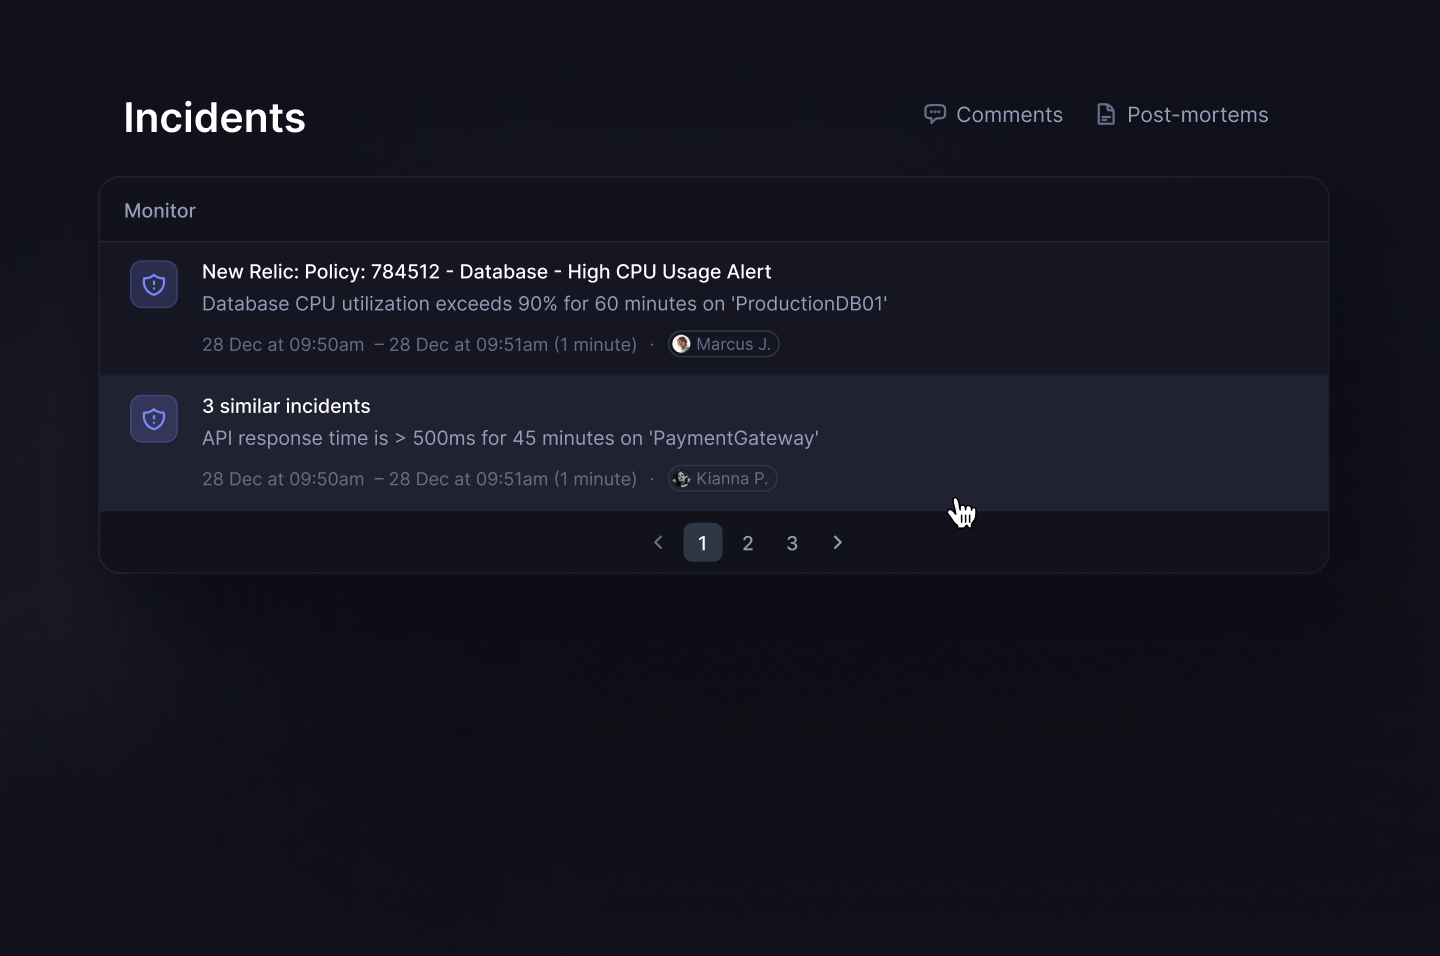
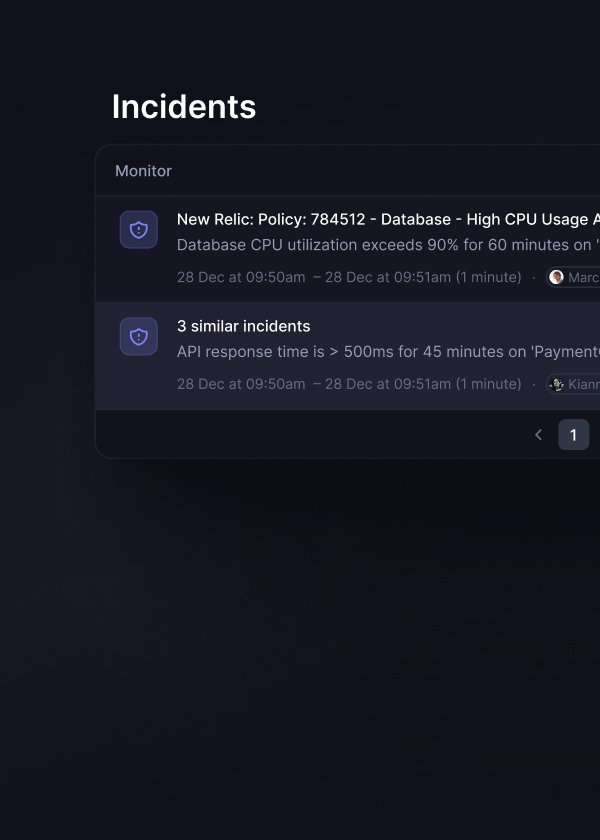
Smart incident merging
10 incidents created at the same time? Acknowledge them with a single tap and keep your phone from ringing while fixing the issue.
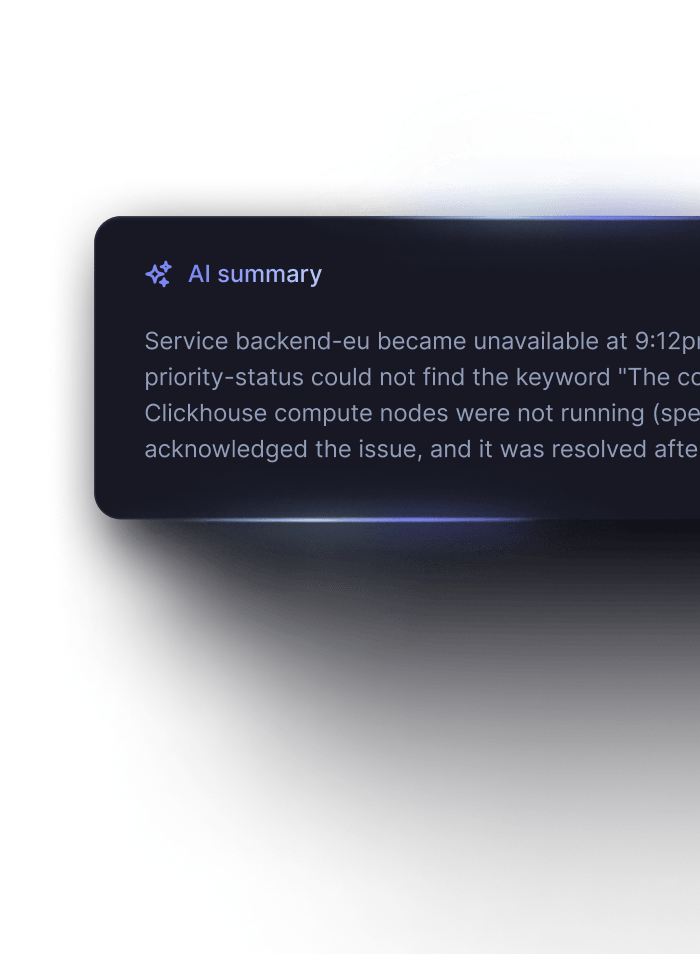
AI post-mortems
Learn from every incident instead of manually rewriting what happened.
Incident management
Slack-based incident management
Get the right team members involved with powerful templated workflows directly in Slack and decrease your MTTR.
Smart incident merging
10 incidents created at the same time? Acknowledge them with a single tap and keep your phone from ringing while fixing the issue.
AI post-mortems
Learn from every incident instead of manually rewriting what happened.
Uptime monitoring
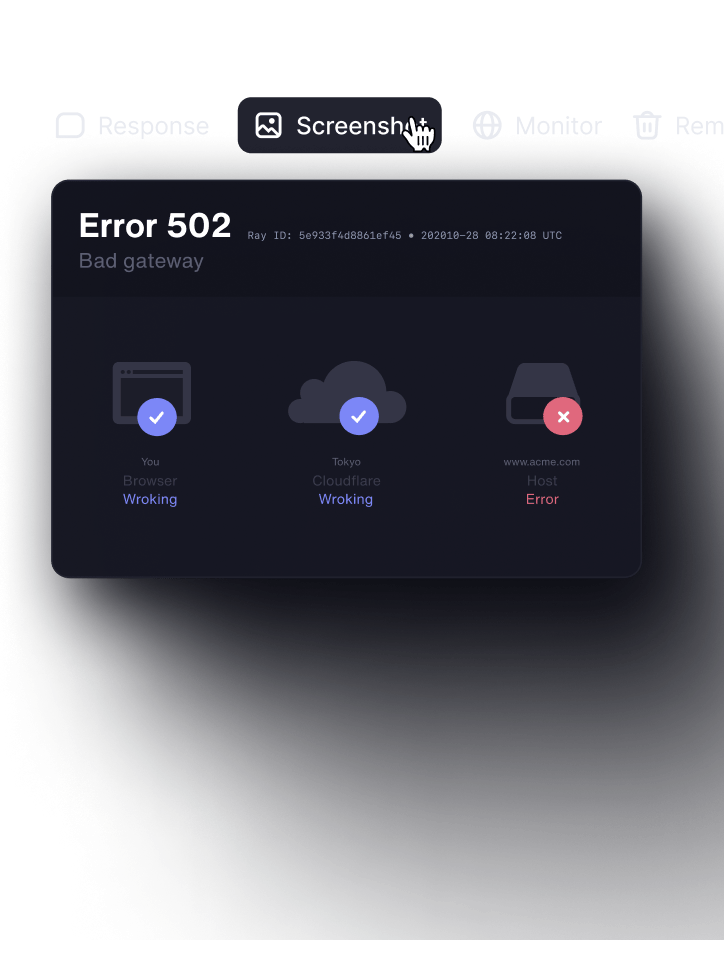
Screenshots for errors
We record the API errors and take a screenshot of your app being down.
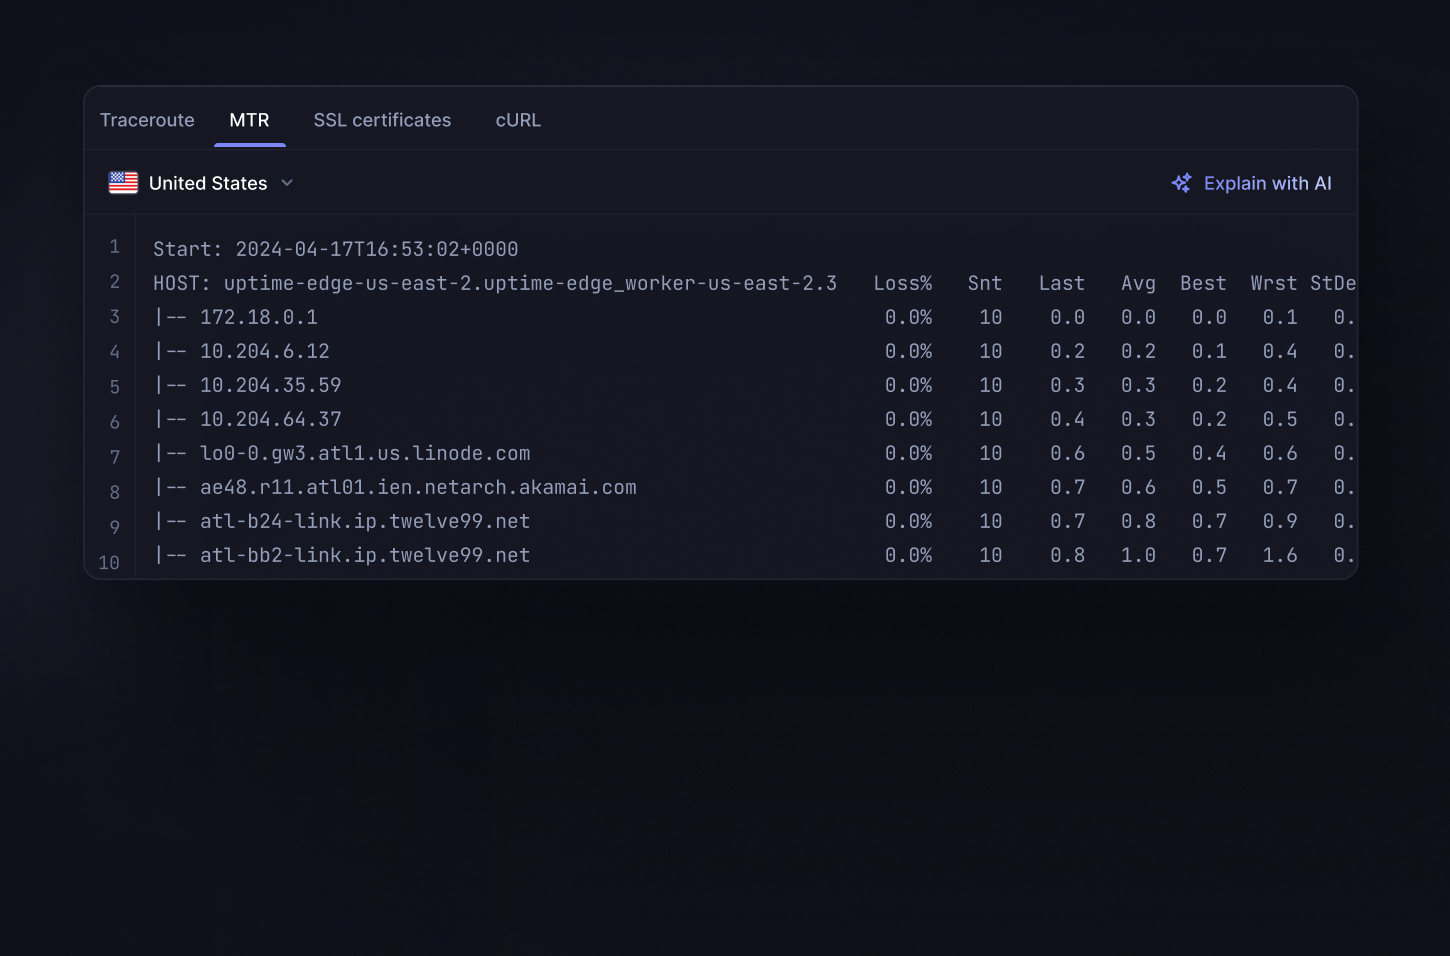
Traceroute & MTR for timeouts
Understand connection timeouts and request timeouts with edge-based traceroute and MTR outputs.
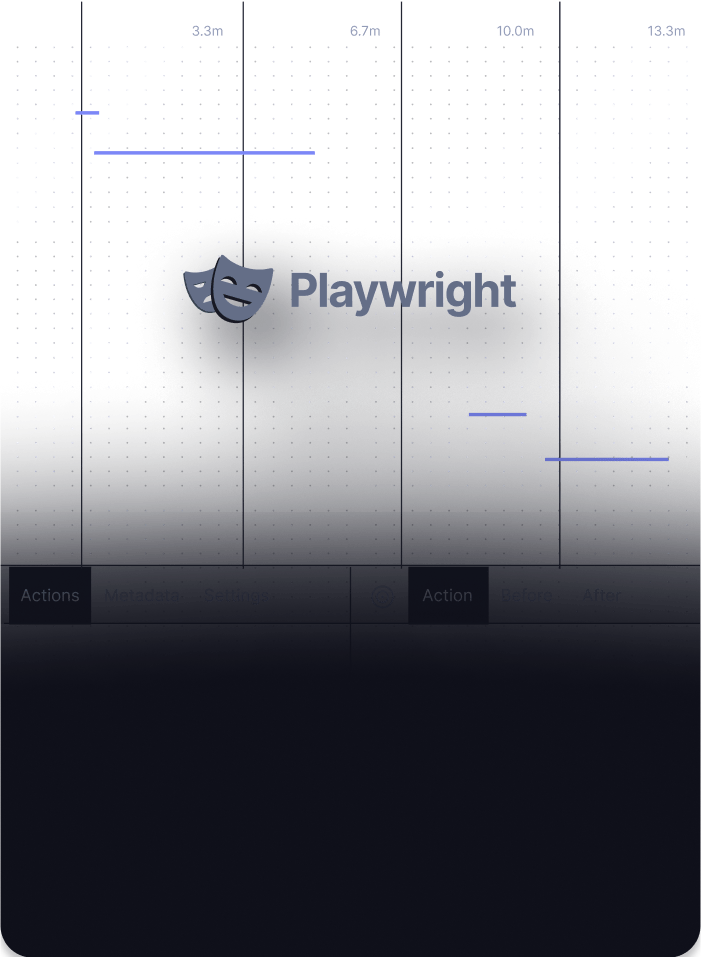
Playwright-based transaction checks
Run tests with a real Chrome browser instance with a JavaScript runtime.

Phone call alerts & SMS included
Unlimited global phone call alerts, sms, push notifications, and Slack notifications included with every Responder license.
Uptime monitoring
Screenshots for errors
We record the API errors and take a screenshot of your app being down.
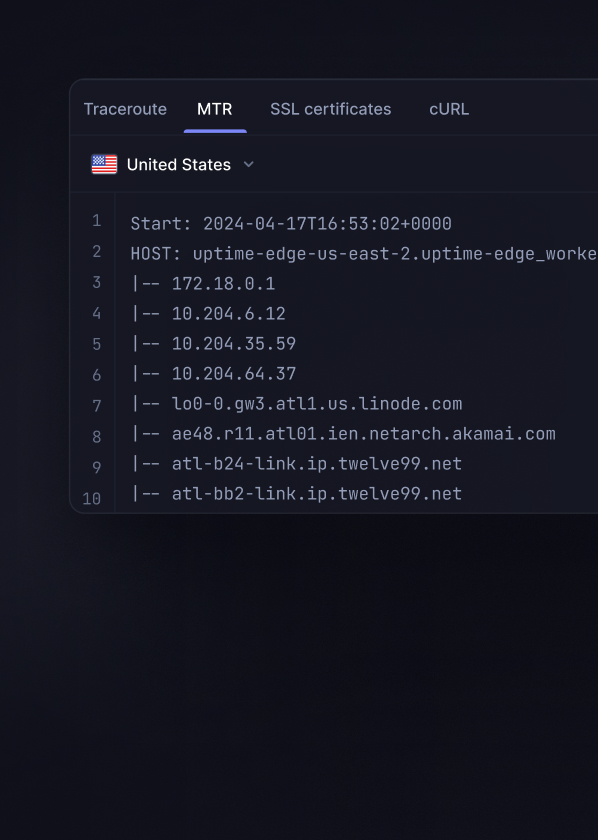
Traceroute & MTR for timeouts
Understand connection timeouts and request timeouts with edge-based traceroute and MTR outputs.
Playwright-based transaction checks
Run tests with a real Chrome browser instance with a JavaScript runtime.

Phone call alerts & SMS included
Unlimited global phone call alerts, sms, push notifications, and Slack notifications included with every Responder license.
Log management
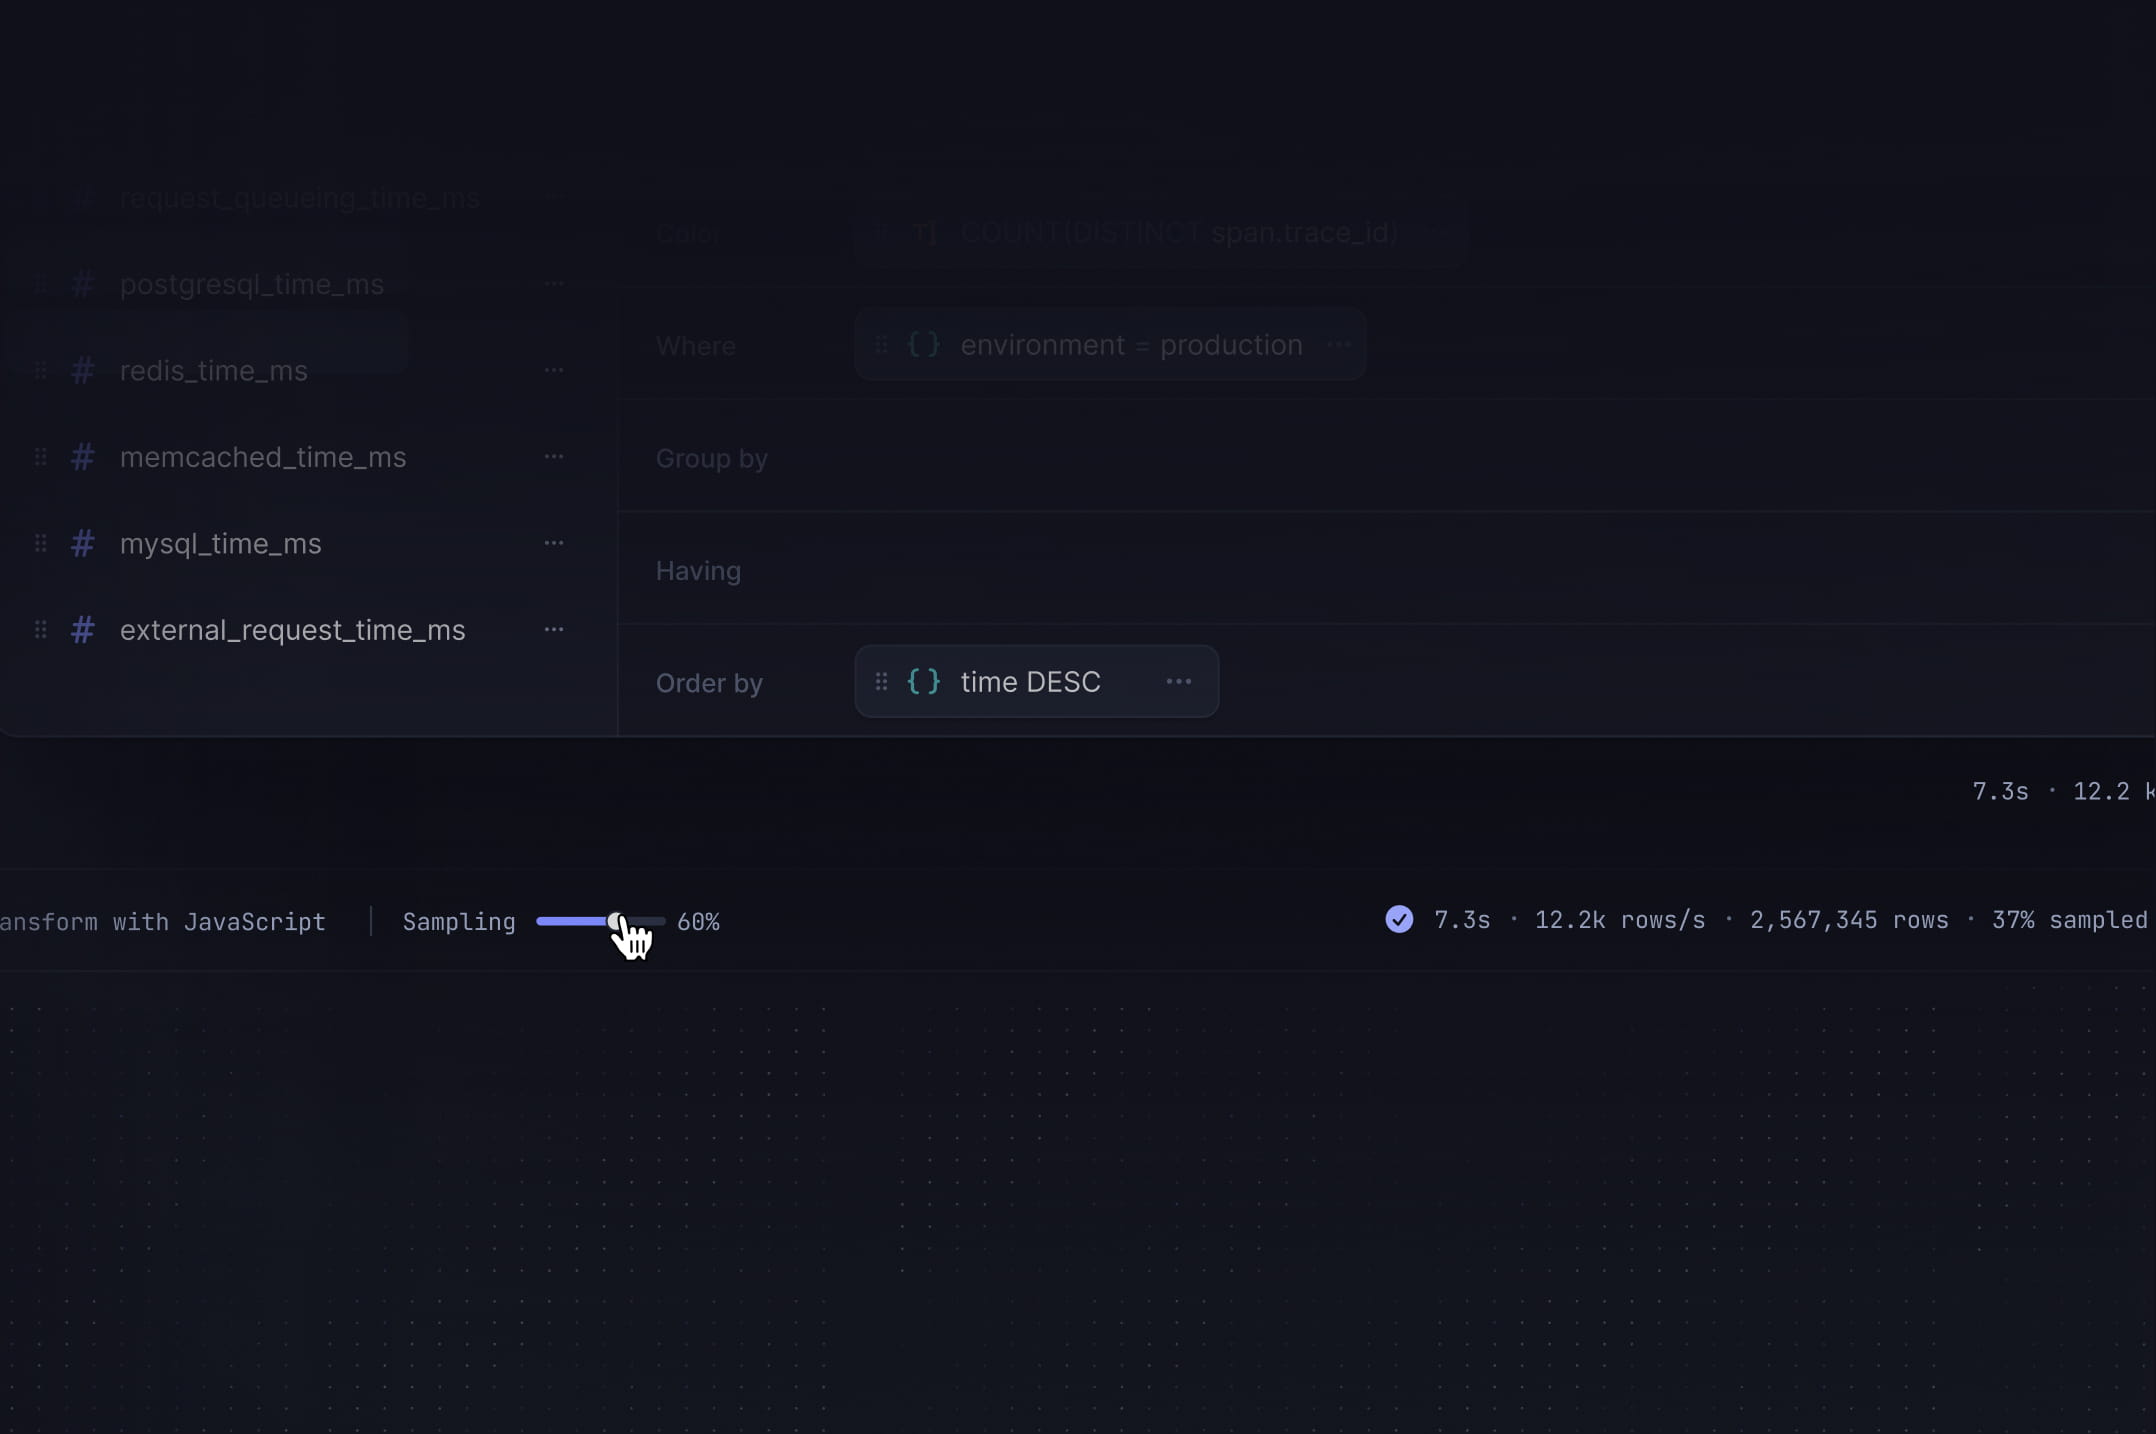
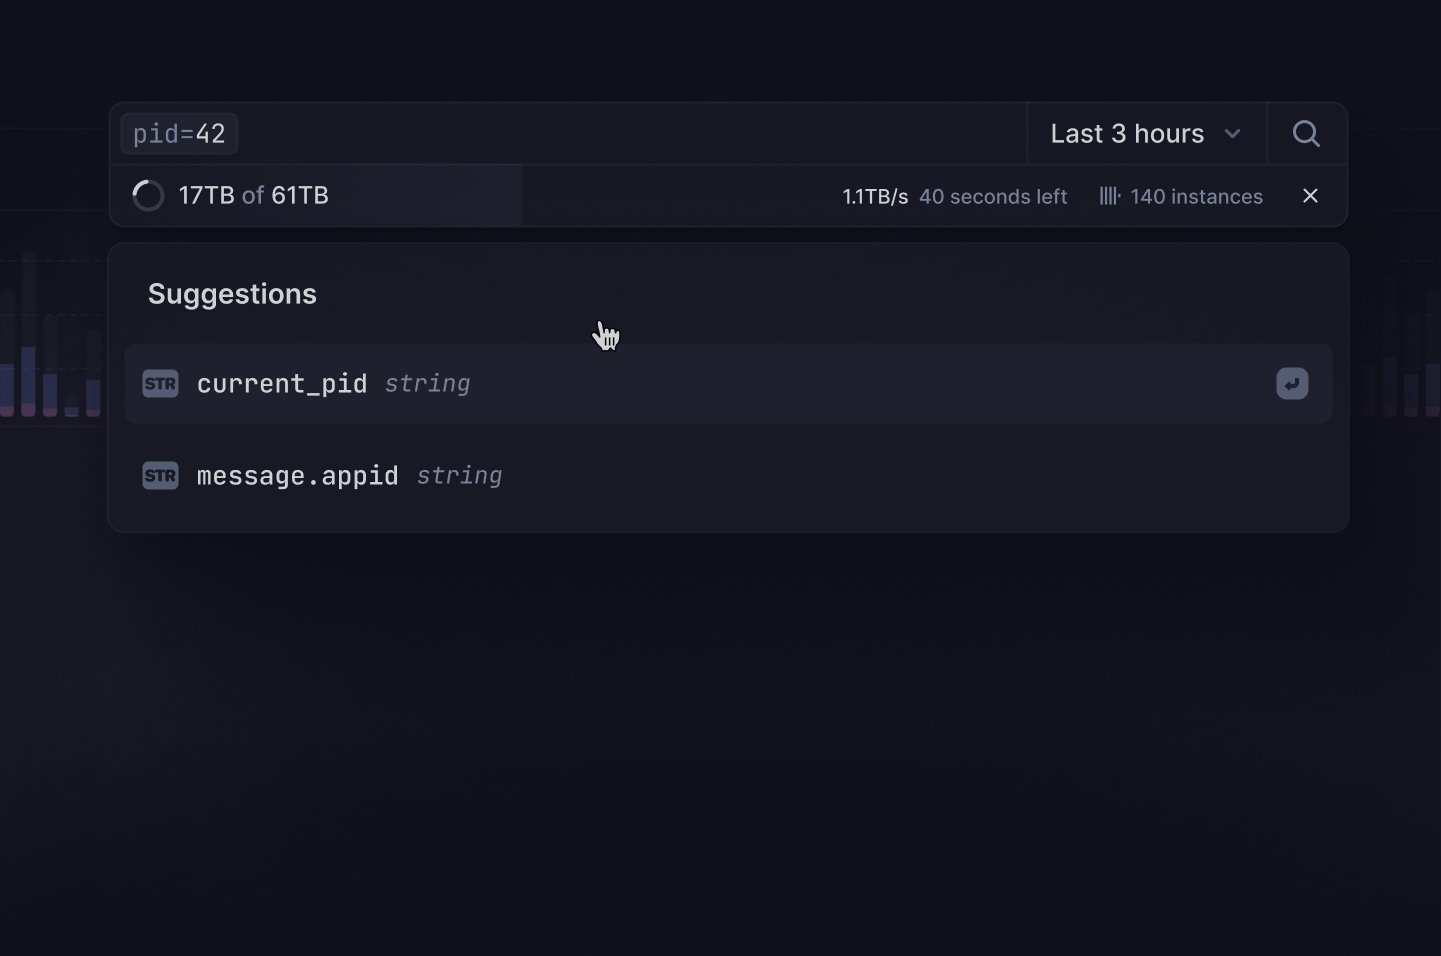
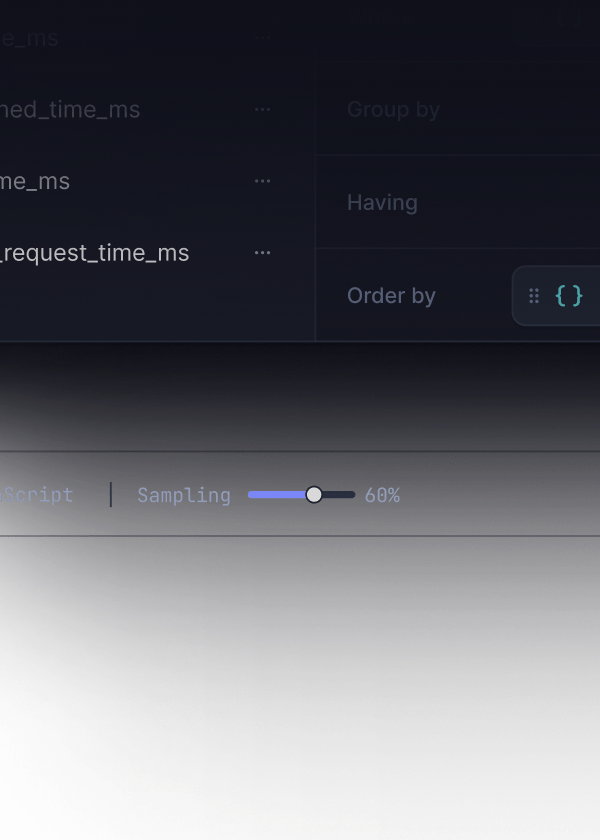
Analyze raw logs at scale
Run ad-hoc queries on raw logs at scale with our built-in query time sampling.
Query with SQL, PromQL, Drag & drop or a simple log filtering.

Don’t get billed for useless logs
Mark irrelevant logs as spam to exclude them and don’t get charged.
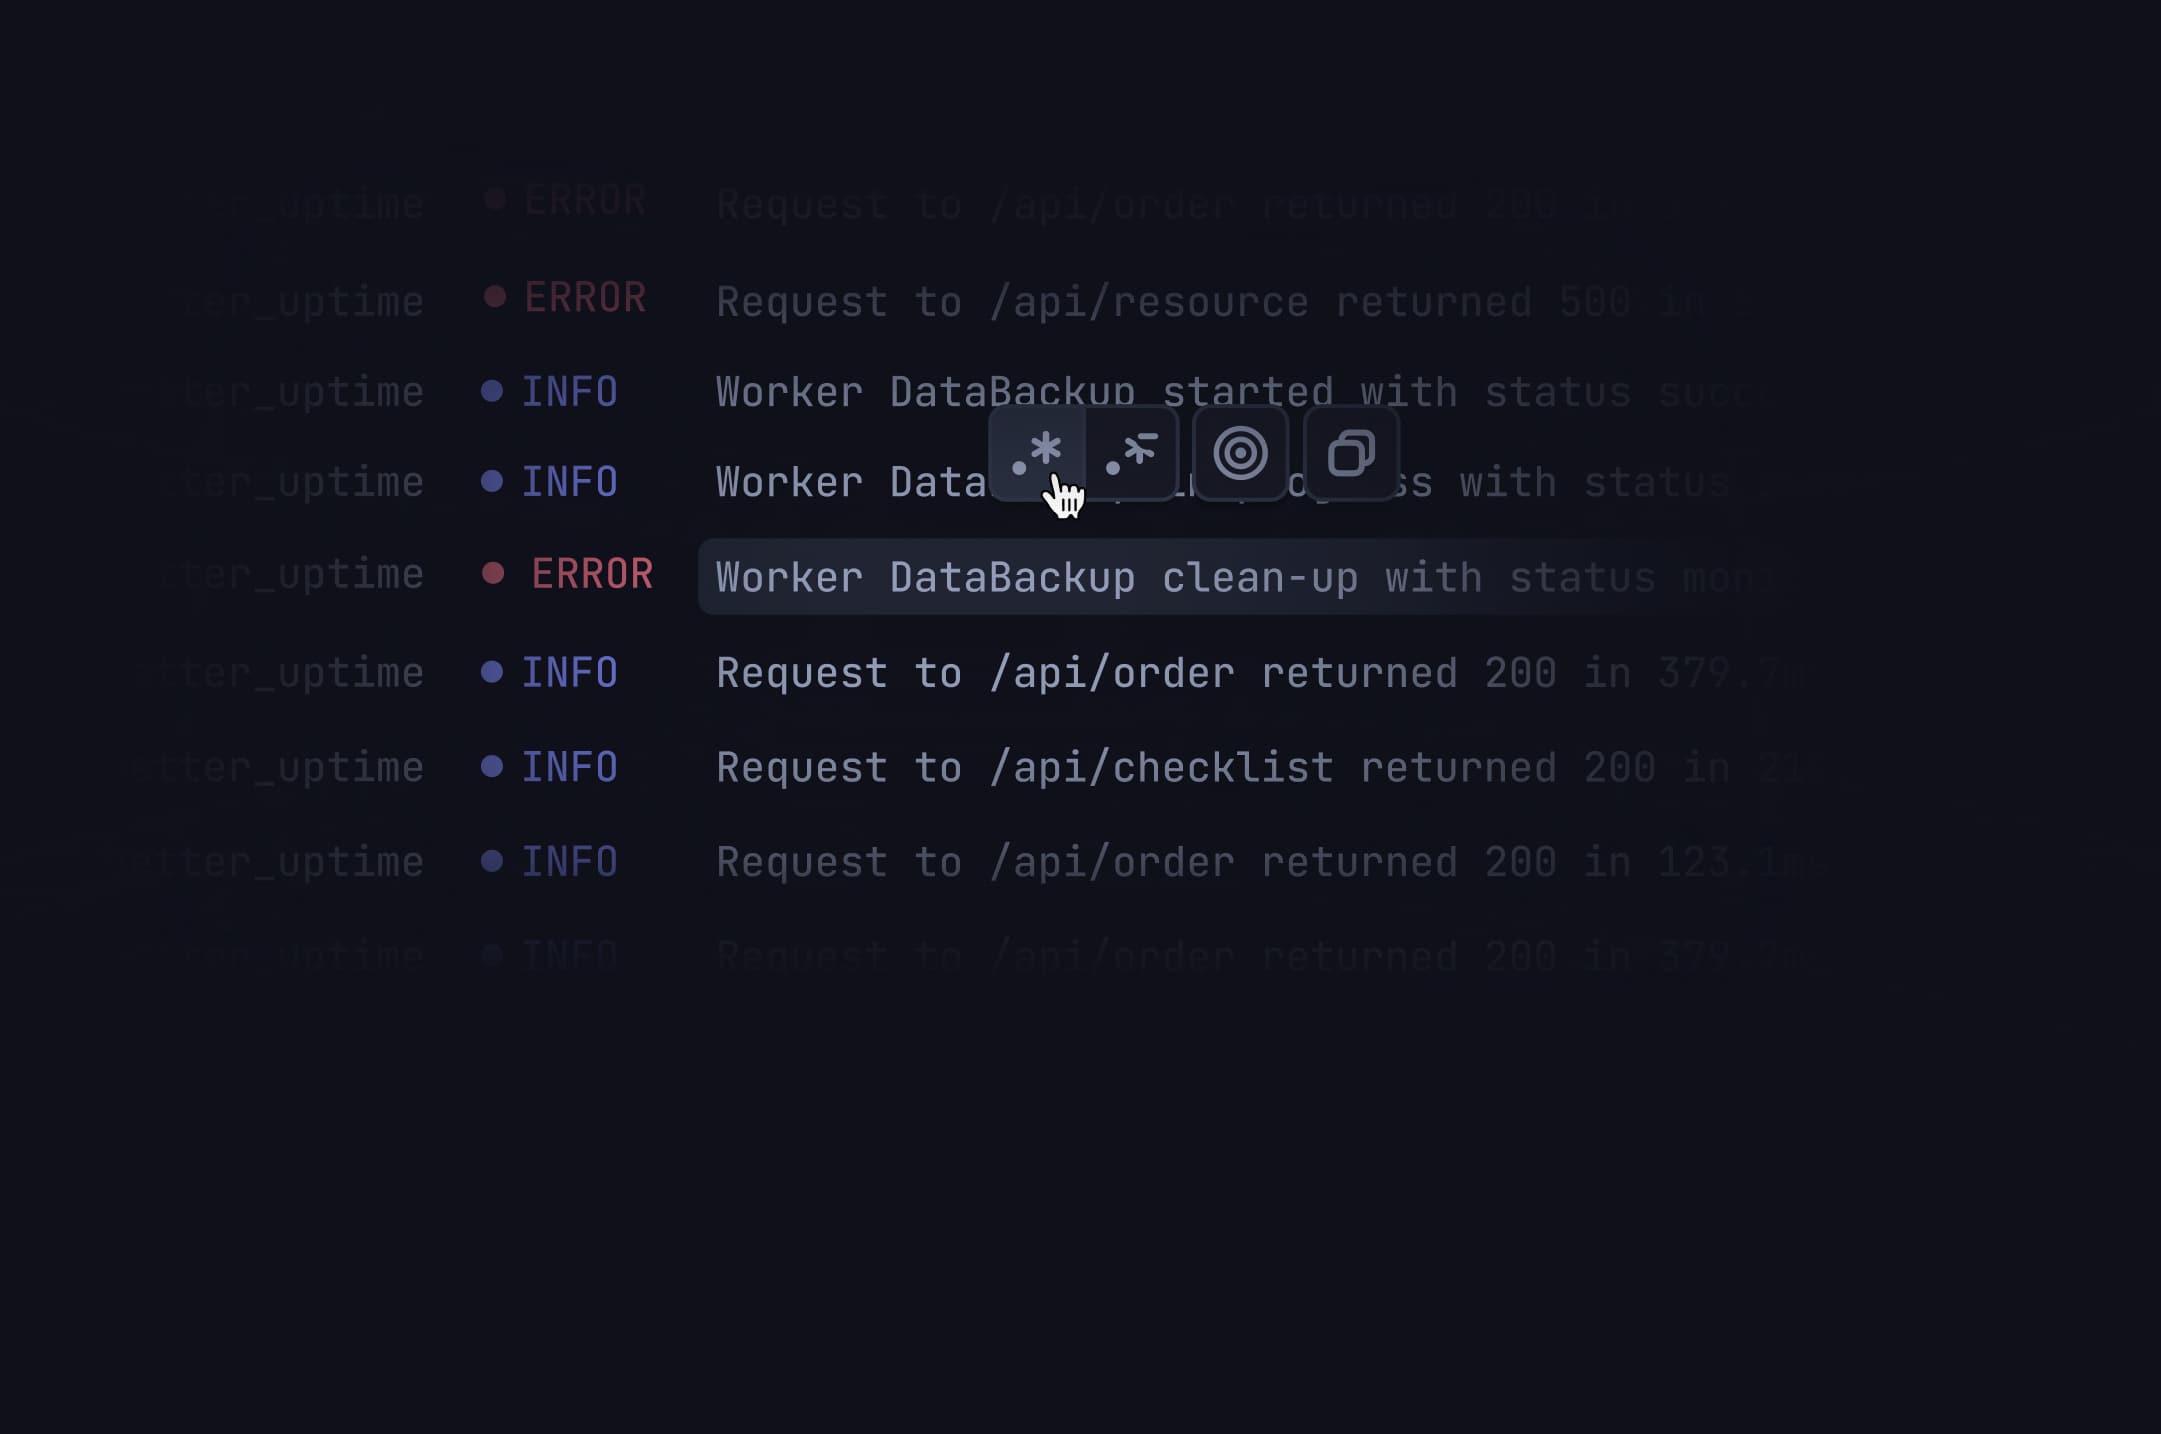
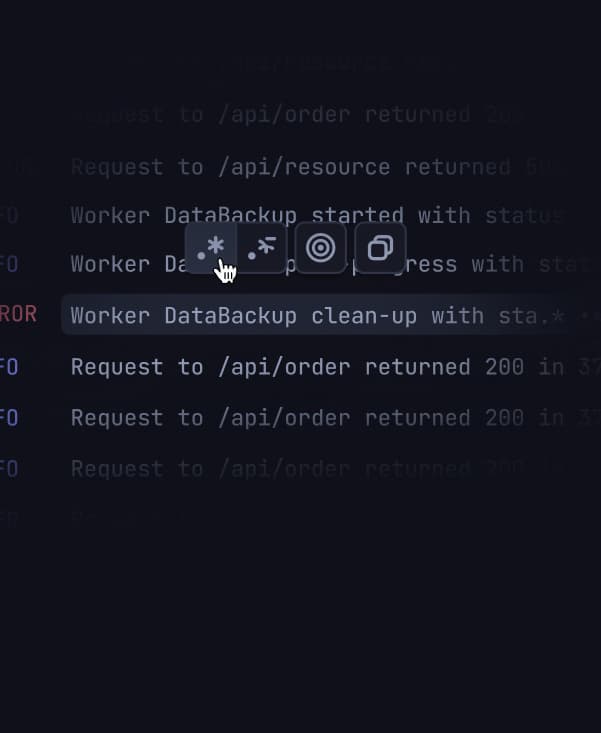
One-click pattern filtering
Group similar logs, filter or exclude patterns with a single click.
See surrounding logs from noisy neighbors.
SQL via HTTP API and MCP server
Query your logs, spans or metrics with SQL over HTTP API or our MCP server.
Store logs in your own S3 bucket
No more ‘hot storage’ and ‘cold storage’. Access all your logs all the time.
No need to rehydrate your logs from S3 ever again.
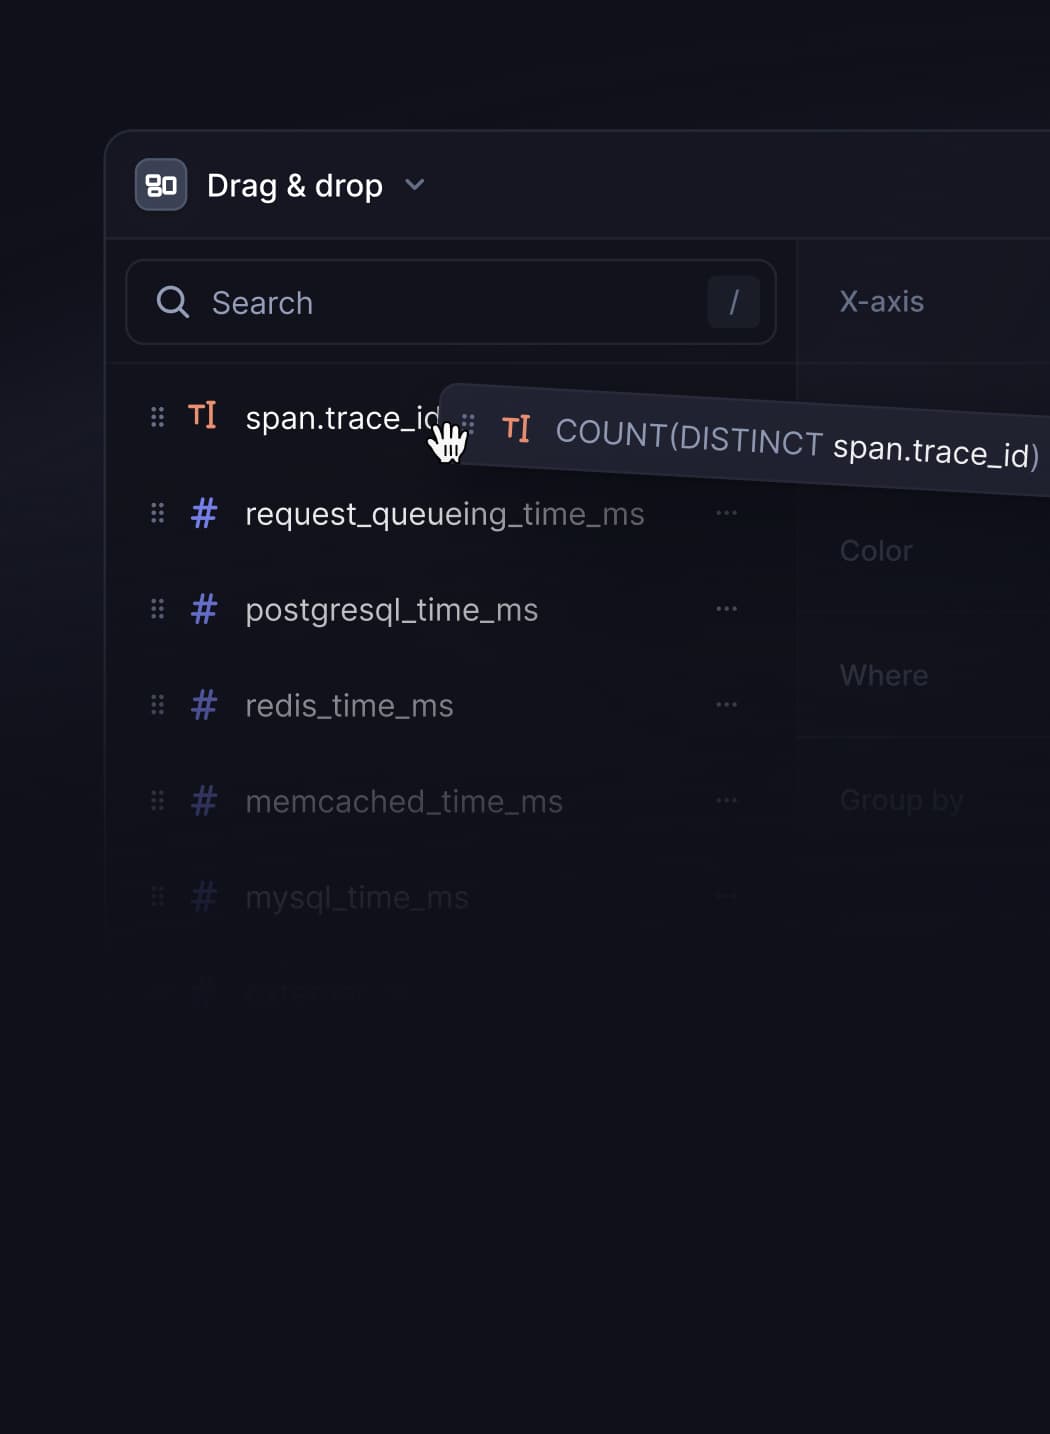
Drag & drop dashboards
Drag & drop the metrics you want to visualize. No SQL code necessary.
Log management
Analyze raw logs at scale
Run ad-hoc queries on raw logs at scale with our built-in sampling.
Don’t get billed for useless logs
Mark irrelevant logs as spam to exclude them and don’t get charged.
One-click pattern filtering
Group similar logs, filter or exclude patterns with a single click.
SQL via HTTP API and MCP server
Query your logs, spans or metrics with SQL over HTTP API or MCP.
Store logs in your own S3 bucket
No need to rehydrate your data ever again.
Drag & drop dashboards
Drag & drop the metrics you want to visualize. No SQL code necessary.
Infrastructure monitoring
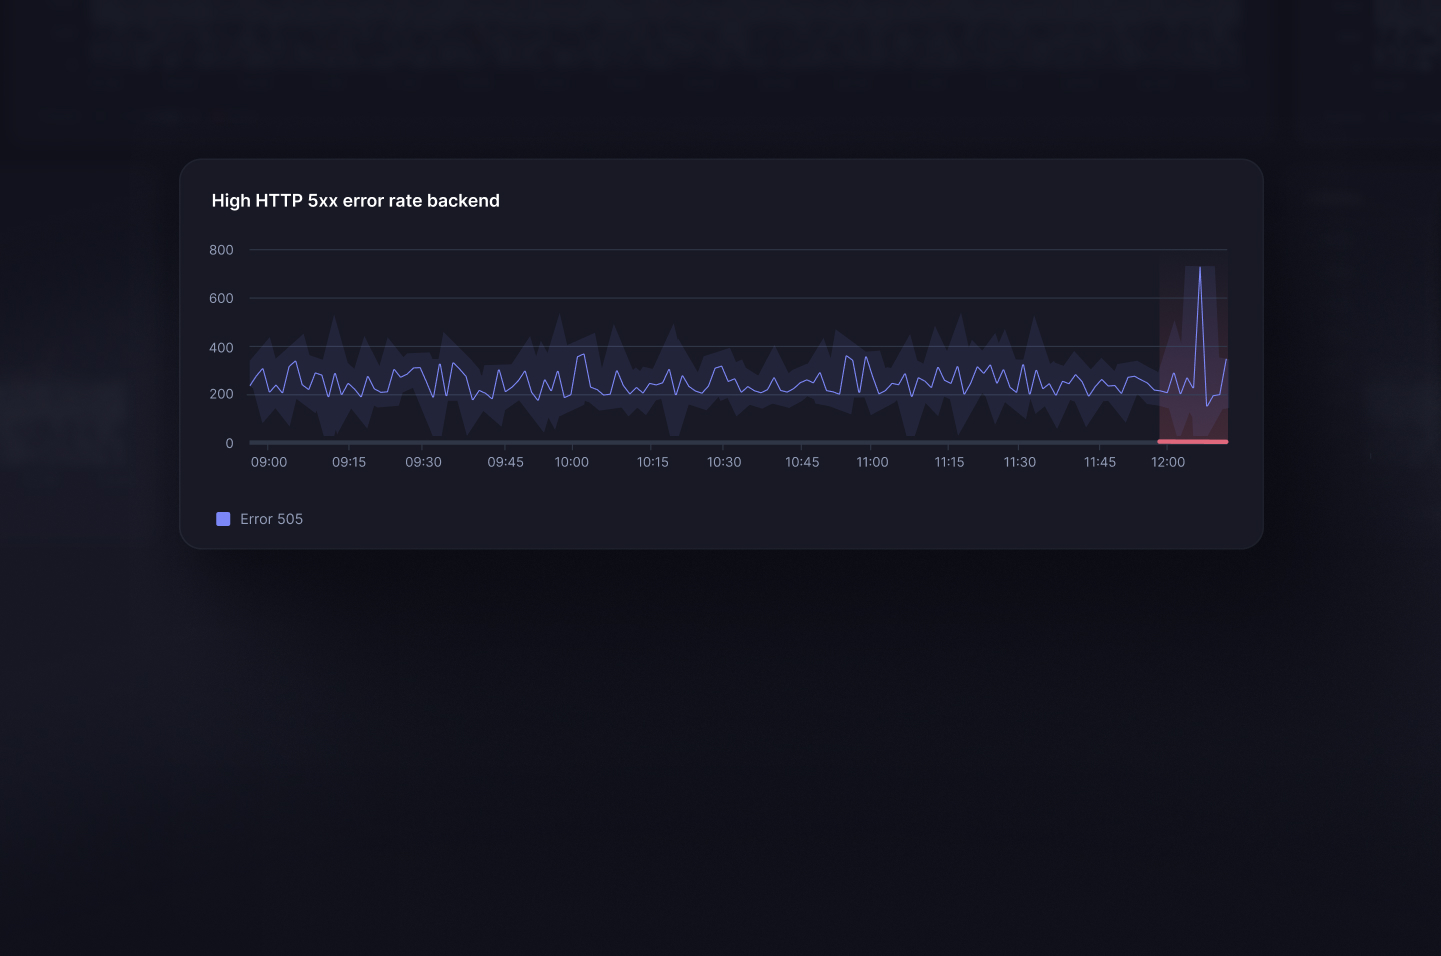
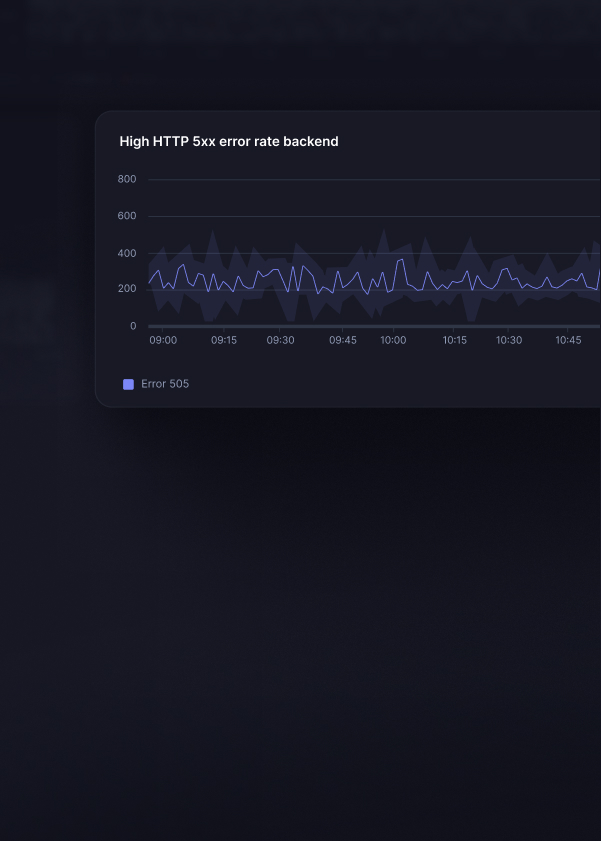
Anomaly detection alerts
Trigger alerts in real-time based on anomalies in logs and metrics. No need to configure exact alert thresholds. Get alerts via Slack, e-mail, phone, SMS, and more.
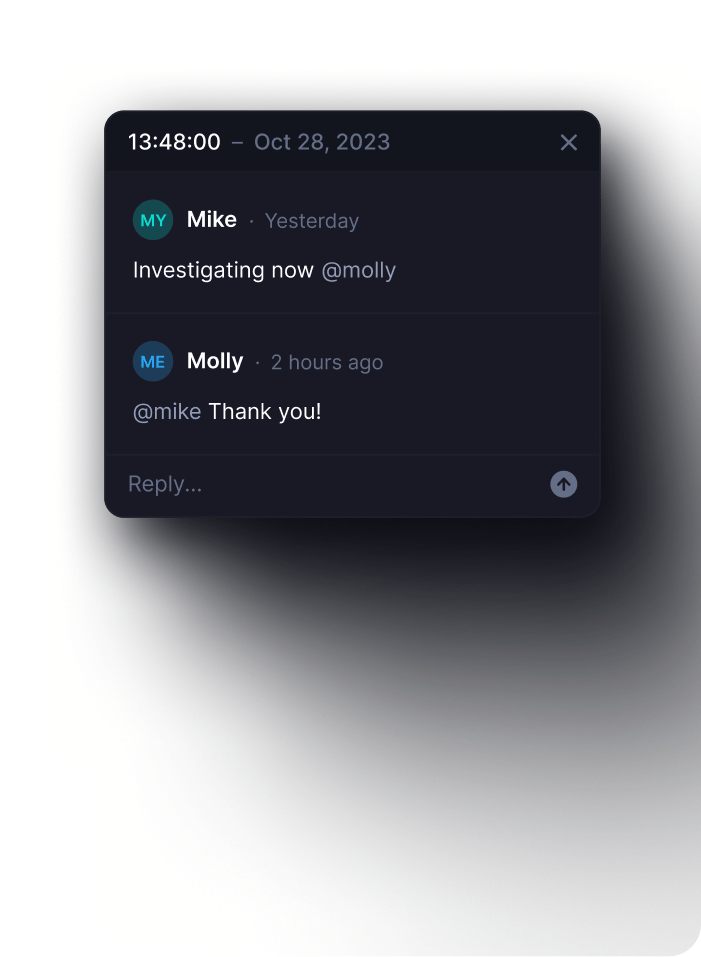
Collaboration built-in
Observe your teammates and comment on note-worthy data spikes.
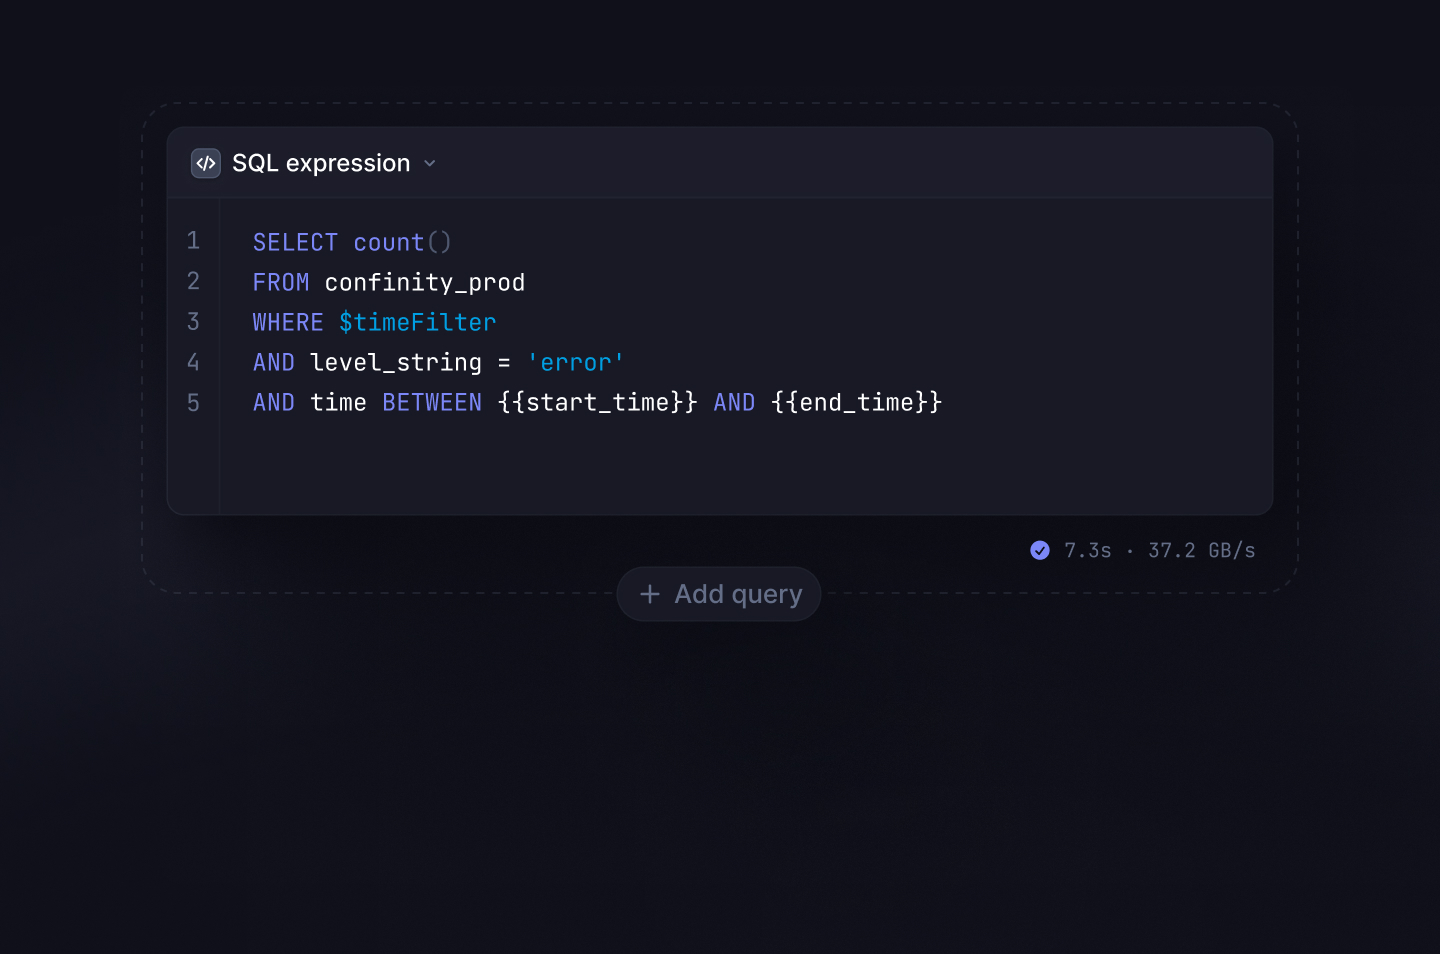
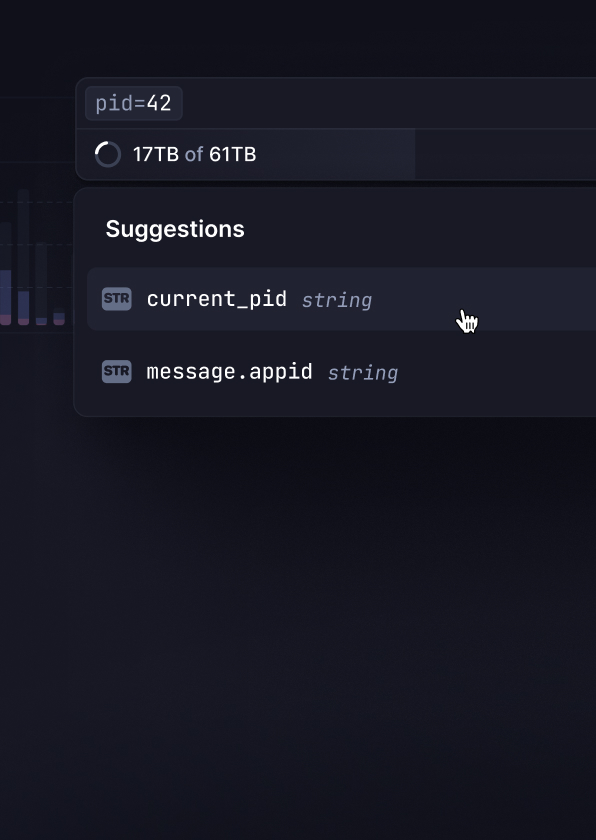
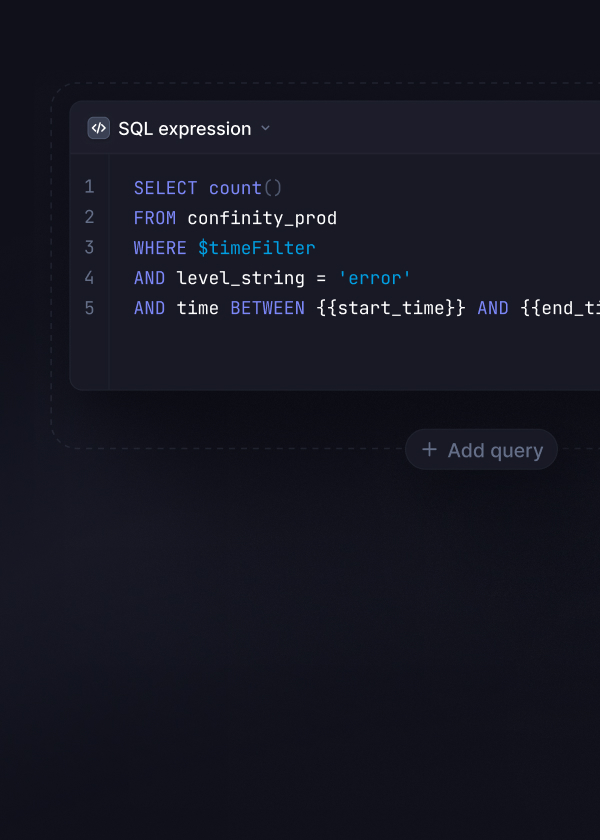
Query with Drag & drop, SQL or PromQL
Get answers fast with a powerful SQL query builder. No need to learn a new querying language or ask your data analyst.

OpenTelemetry & Prometheus-native
Connect metrics in minutes using existing open-source collectors.
Infrastructure monitoring
Anomaly detection alerts
Trigger alerts in real-time based on anomalies in logs and metrics. No need to configure exact alert thresholds. Get alerts via Slack, e-mail, phone, SMS, and more.
Collaboration built-in
Observe your teammates and comment on note-worthy data spikes.
Query with Drag & drop, SQL or PromQL
Get answers fast with a powerful SQL query builder. No need to learn a new querying language or ask your data analyst.
OpenTelemetry & Prometheus-native
Connect metrics in minutes using existing open-source collectors.
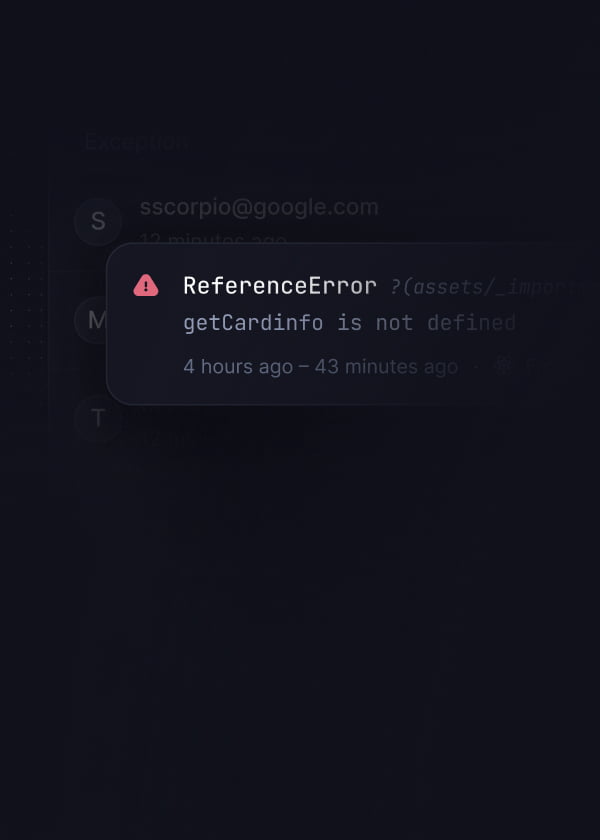
Error tracking
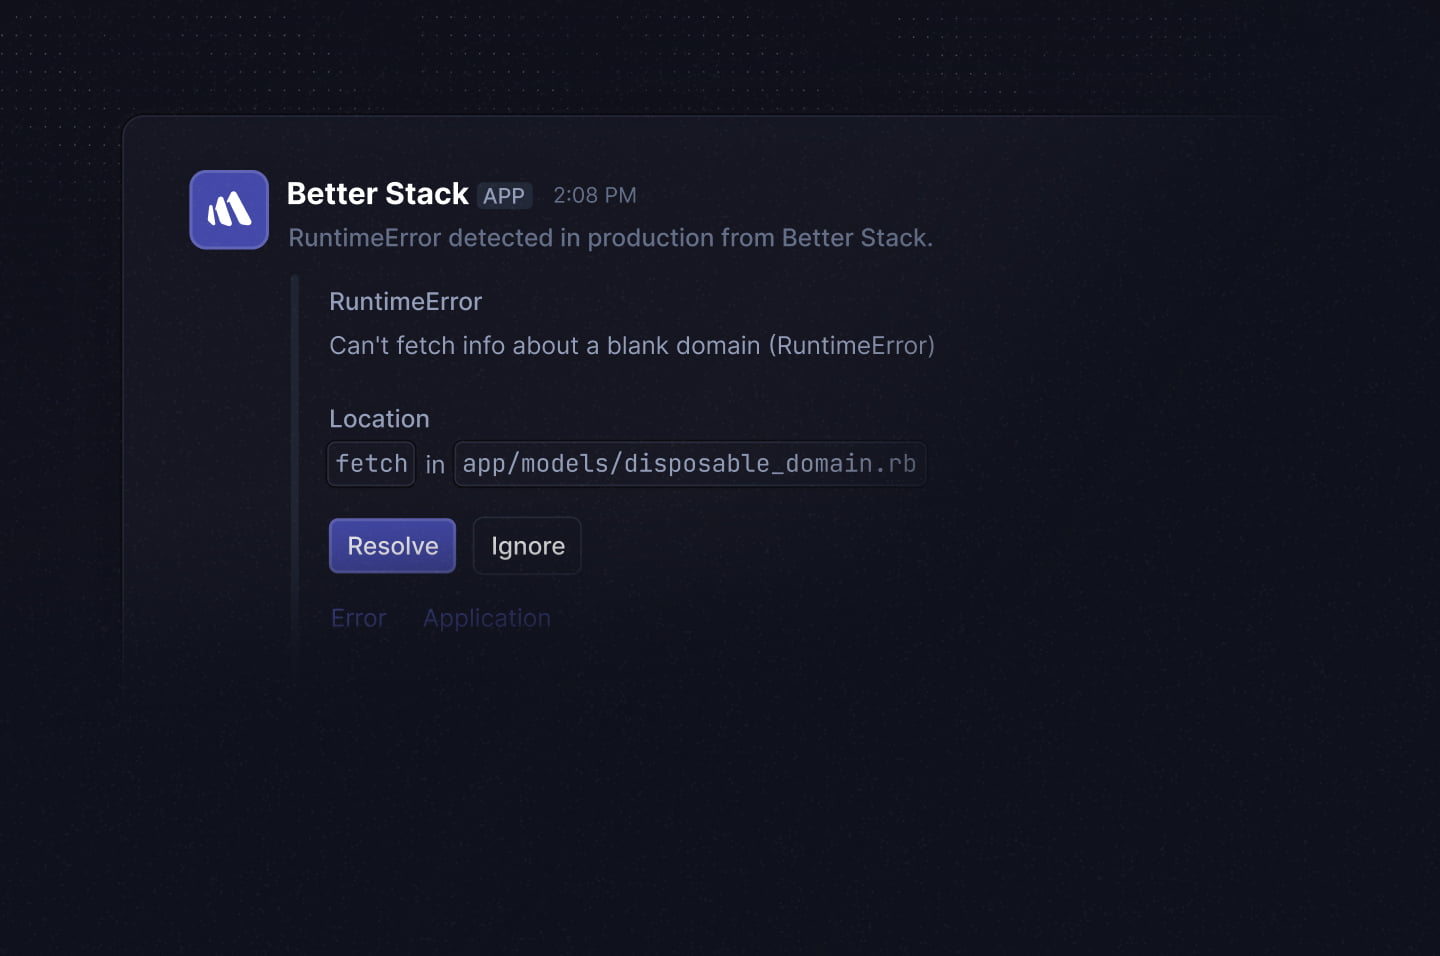
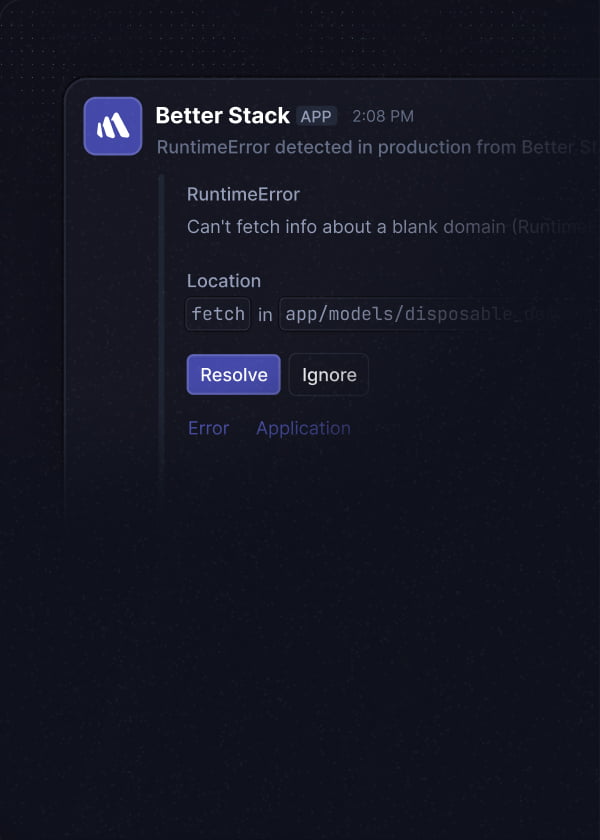
Made for Slack, Linear, Microsoft Teams, and Jira
Integrate with tools you already use to get alerted with rich contextual notifications. Need an urgent fix? Leverage the built-in incident management.
Compatible with Sentry SDKs
Track errors from 100+ platforms with the industry-standard Sentry SDKs.
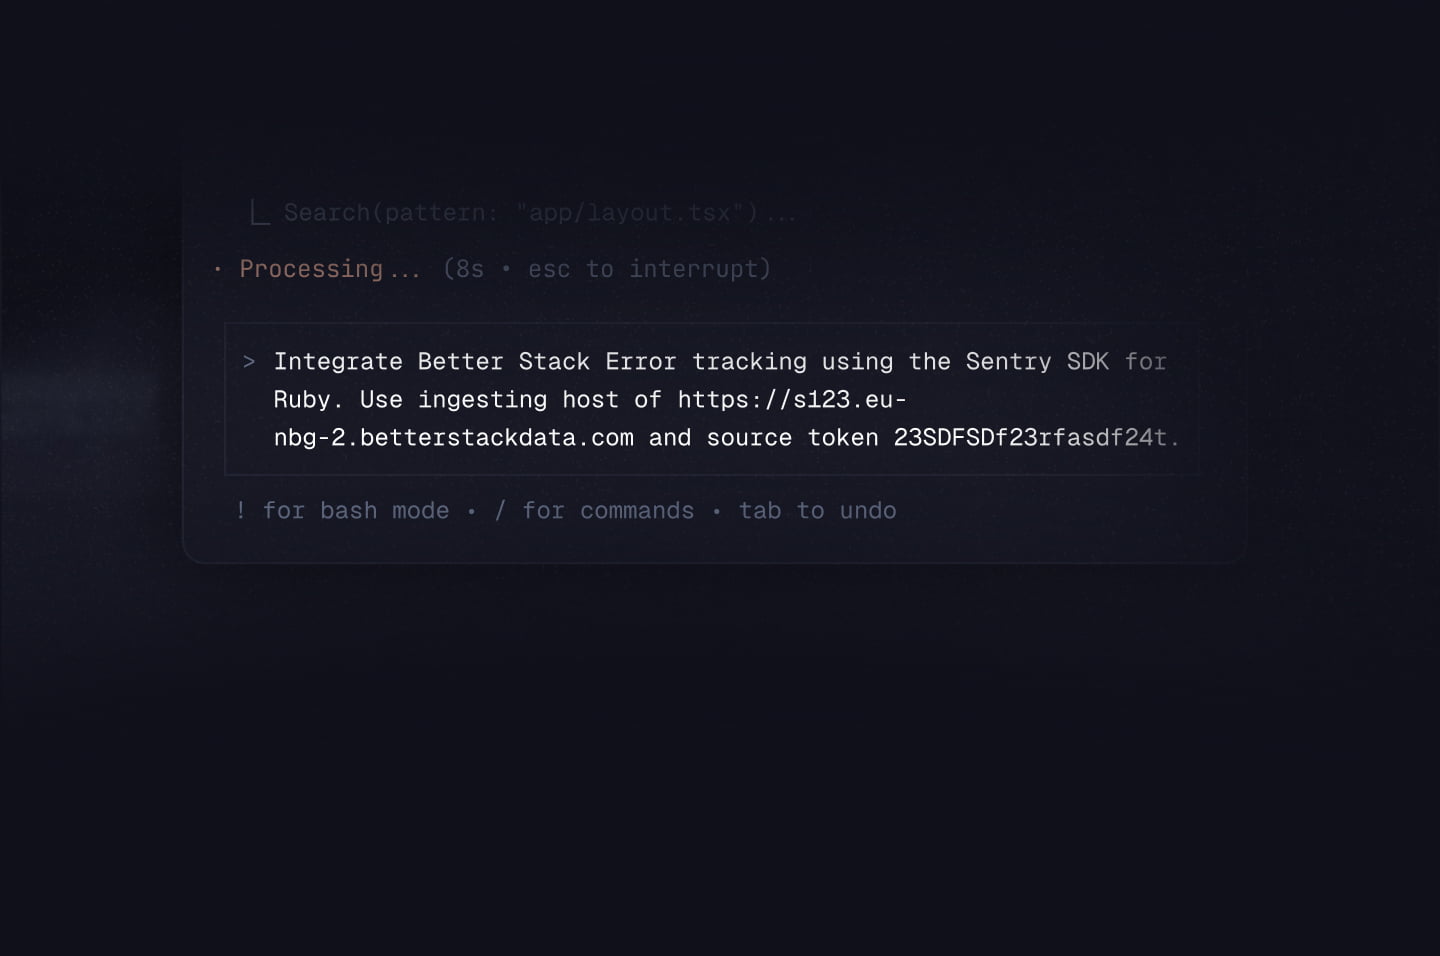
Integrate with Claude Code or Cursor
Integrate Better Stack in seconds with a single prompt. Copy, run, and start tracking errors with Better Stack.
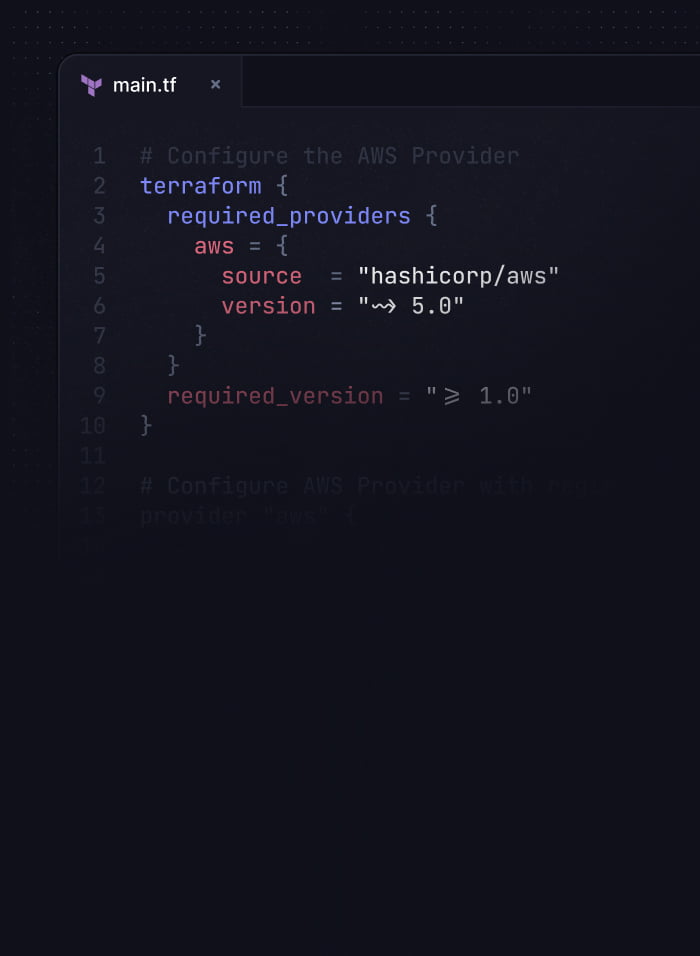
Terraform, API, and MCP server
Integrate new apps with Terraform and investigate errors with MCP.
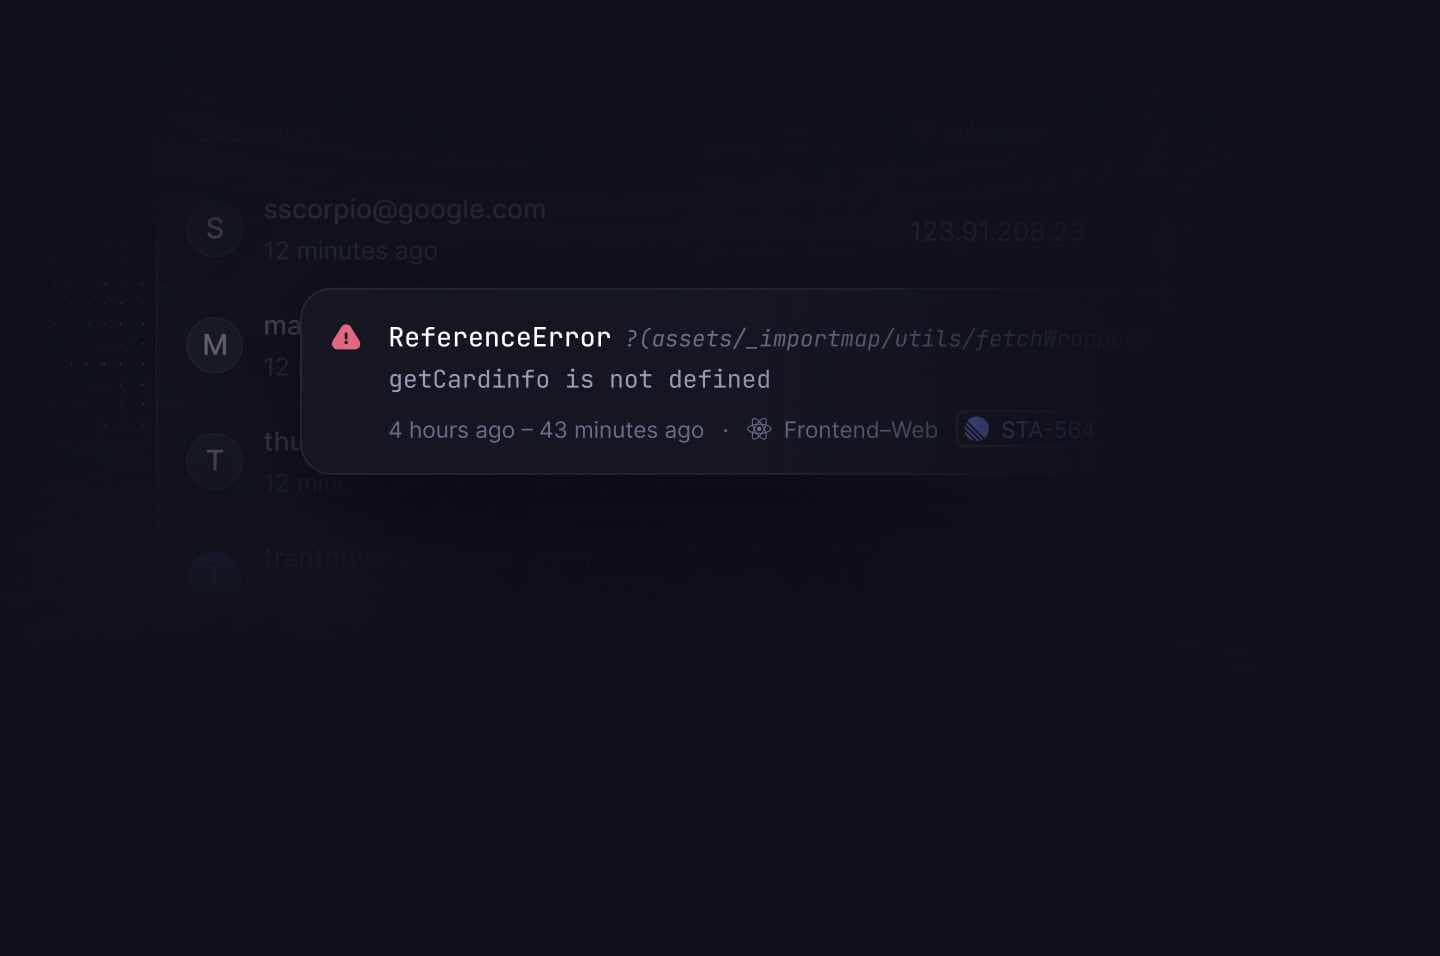
Configurable exception grouping
Have a non-standard stack and want to group exceptions in an atypical way? We got you covered.
Error tracking
Slack, Linear, MS Teams, Jira
Get alerted with rich notifications. Need an urgent fix? Leverage the built-in incident management.
Compatible with Sentry SDKs
Track errors from 100+ platforms with the industry-standard Sentry SDKs.
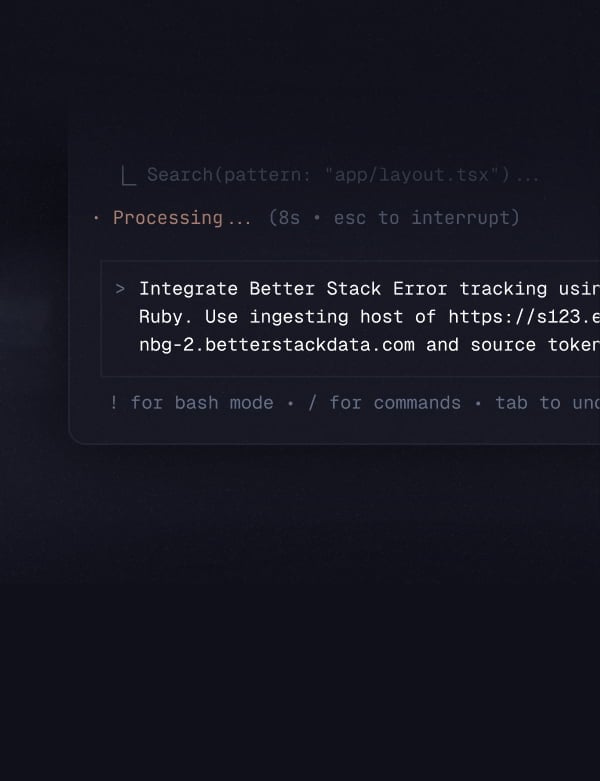
Integrate with Claude Code or Cursor
Integrate Better Stack in seconds with a single prompt. Copy, run, and start tracking errors with Better Stack.
Terraform, API, and MCP server
Integrate new apps with Terraform and investigate errors with MCP.
Configurable exception grouping
Have a non-standard stack and want to group exceptions in an atypical way? We got you covered.
Status page
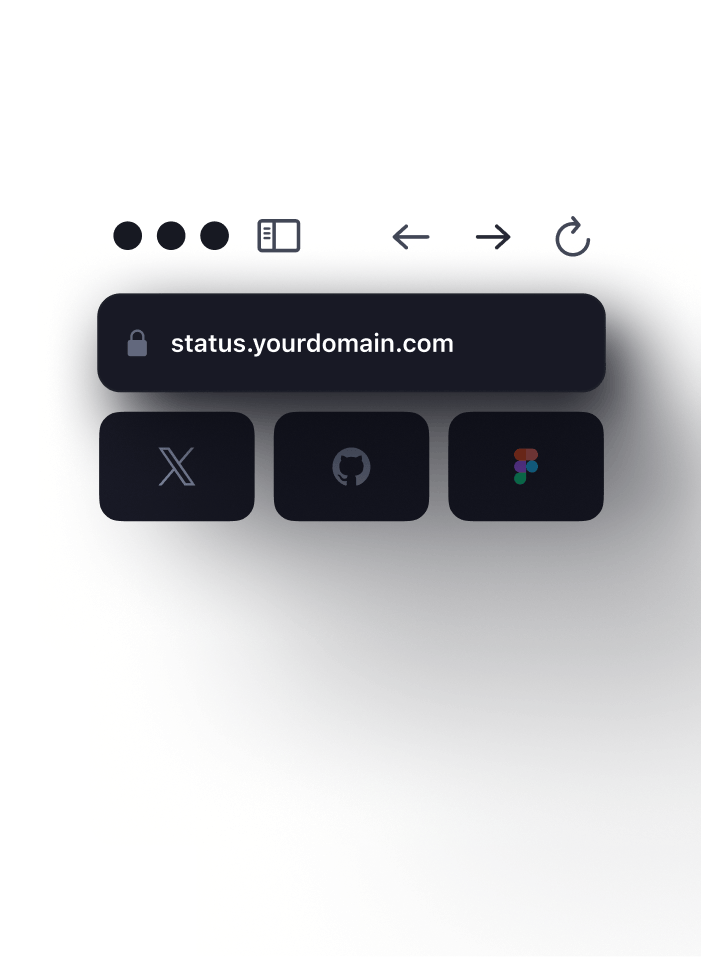
Branded page on your own sub-domain
Beautifully designed status page. Fully customizable with CSS and Javascript.
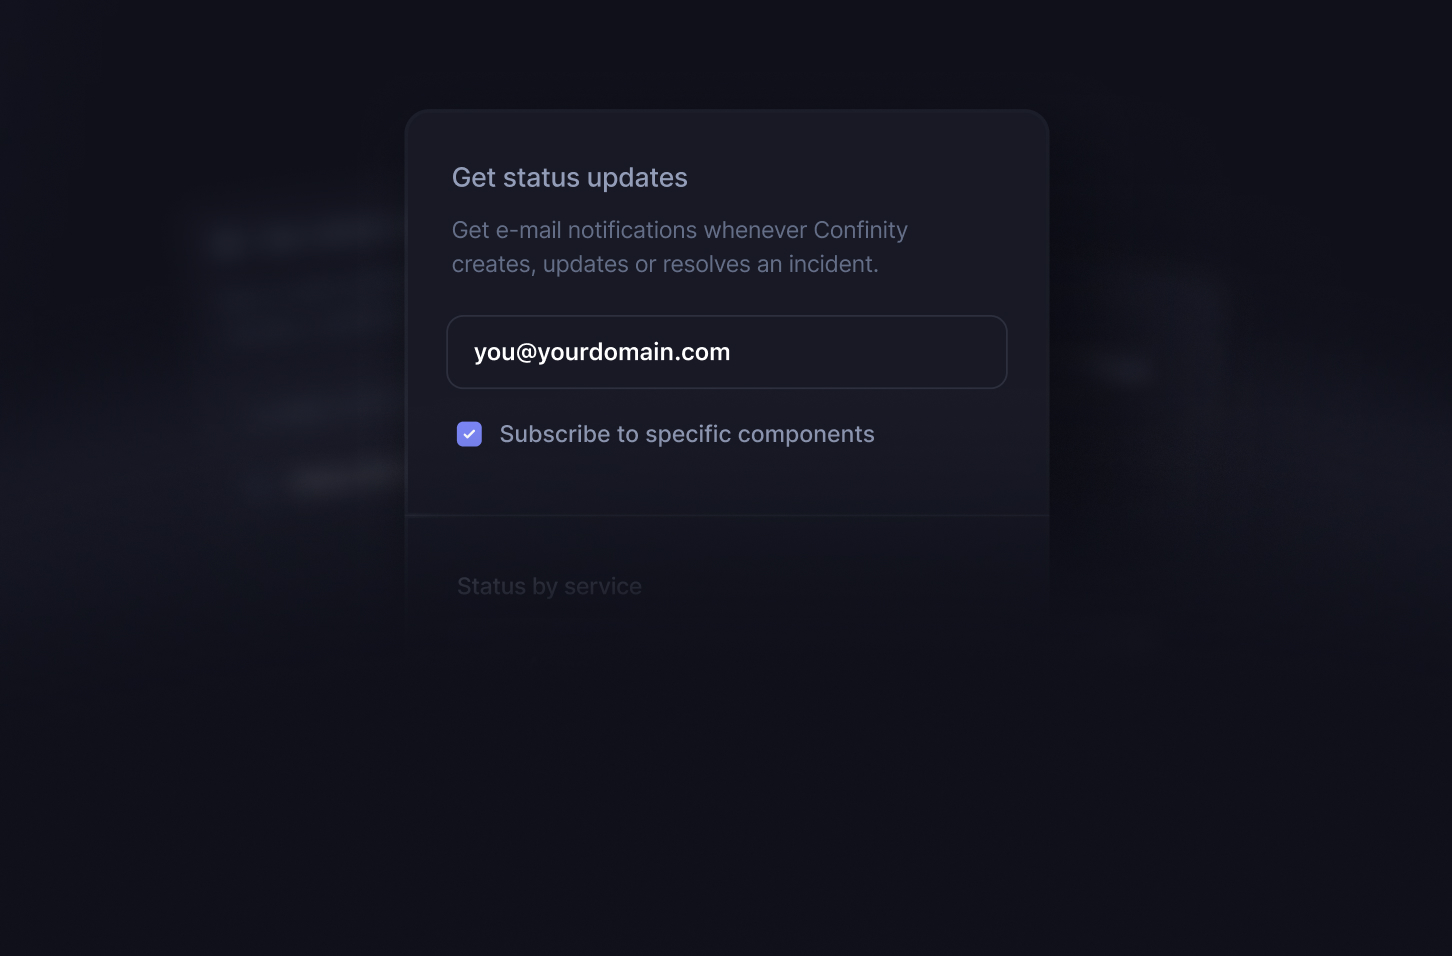
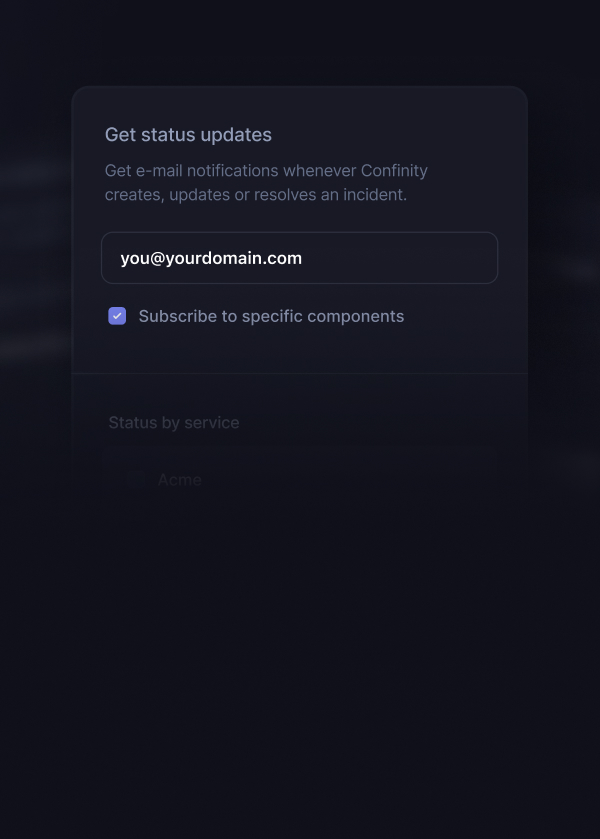
Subscribe to status page updates
Send automated updates to your customers when incident occurs. Let your customers subscribe to the entire status page or just selected components.
Translated into any language
Be perceived as a local by your foreign customers. Customize every translation.
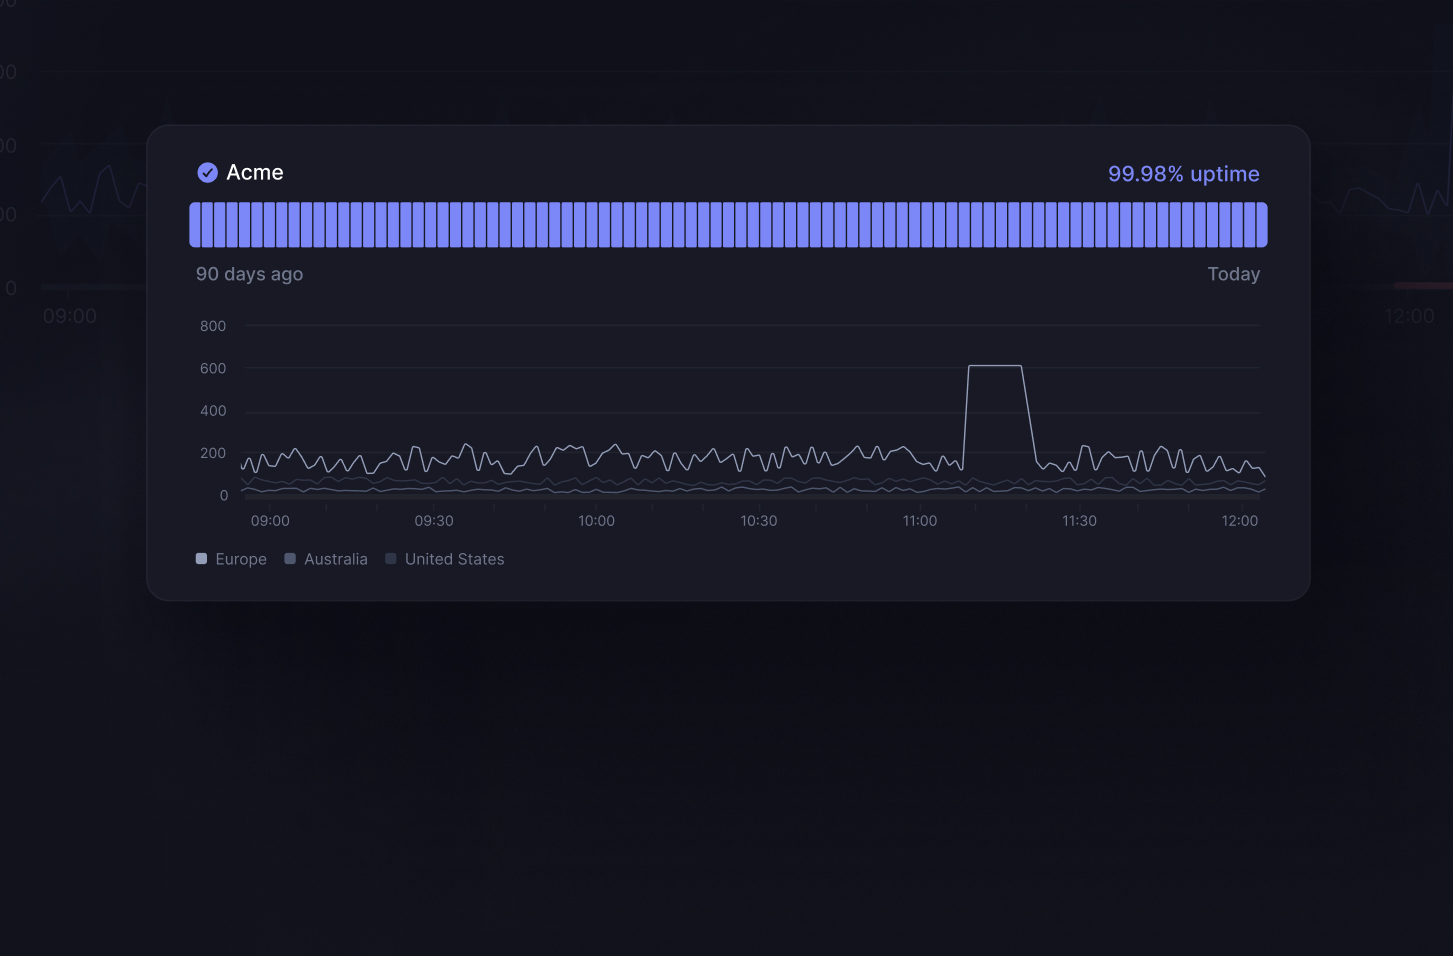
Embed custom charts
Show pre-built charts with response times or add custom metrics with advanced visualizations directly to your status page.
Status page
Branded page on your own sub-domain
Beautifully designed status page. Fully customizable with CSS and Javascript.
Subscribe to status page updates
Send automated updates to your customers when incident occurs. Let your customers subscribe to the entire status page or just selected components.
Translated into any language
Be perceived as a local by your foreign customers. Customize every translation.
Embed custom charts
Show pre-built charts with response times or add custom metrics with advanced visualizations directly to your status page.
Warehouse
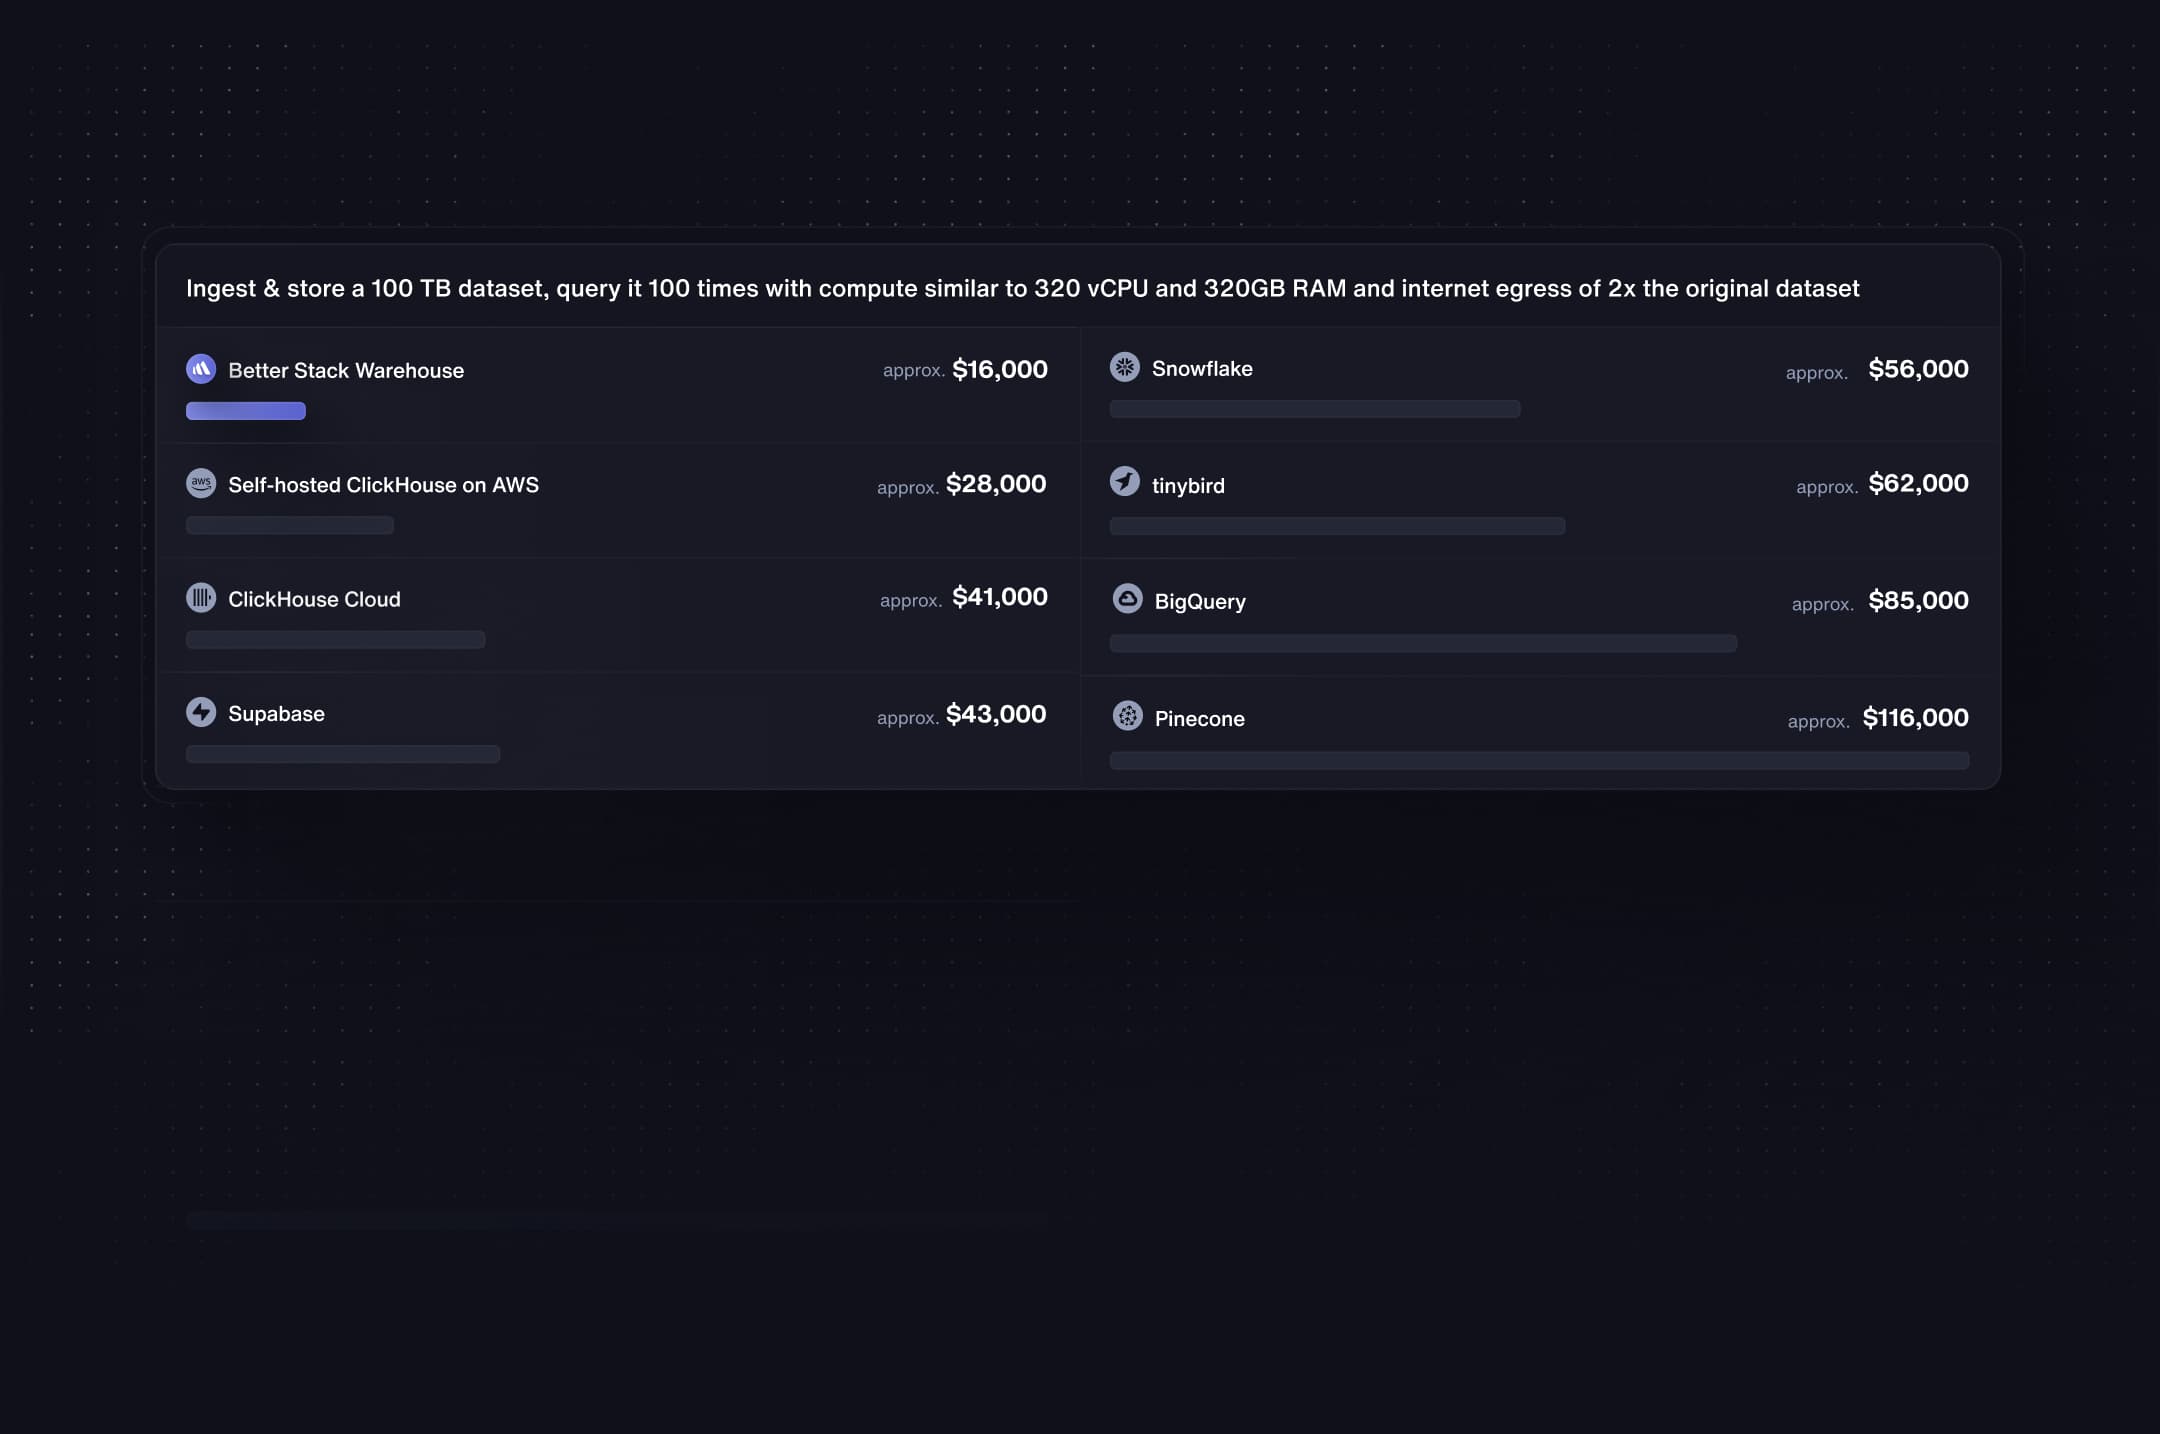
So affordable you’ll ask what’s wrong with it
Benefit from our economies of scale. We pass the savings on to you.
Cheaper than self-hosting on AWS.
Get serverless ClickHouse® as an API
Save query as a high-performance API you can securely call from frontend.

Built-in vector embeddings and approximate KNN
Generate vector embeddings without having to call an external API with our
built-in embedding model and query embeddings fast with vector indexes.
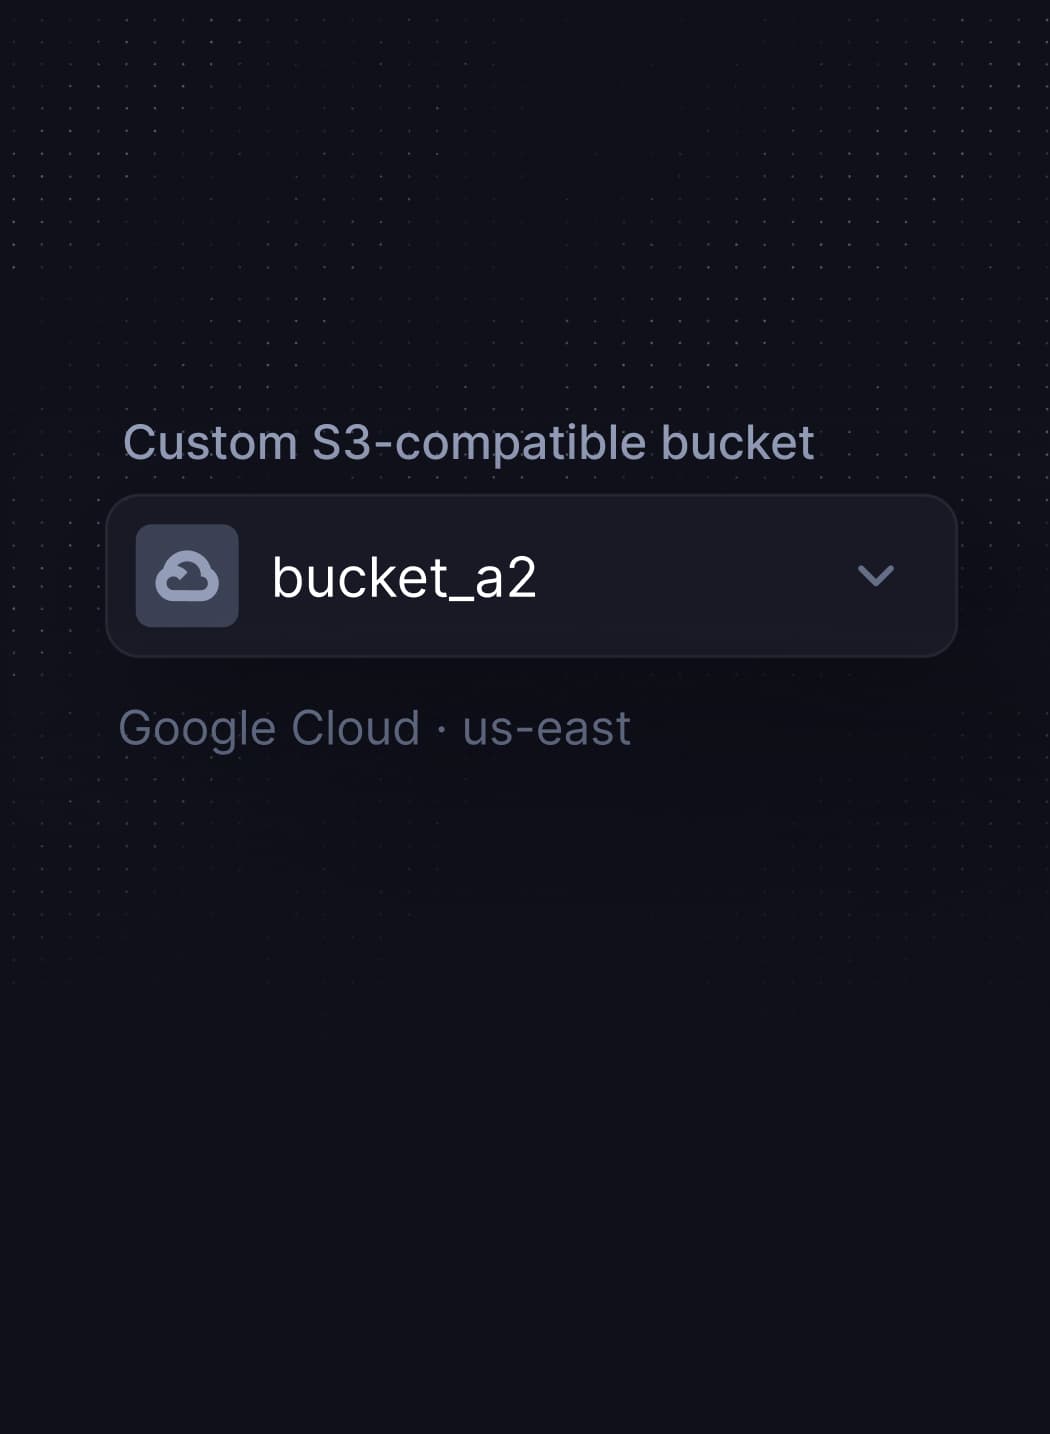
Open formats in your own S3 bucket
Store everything in your own cloud.
No vendor lock-in.
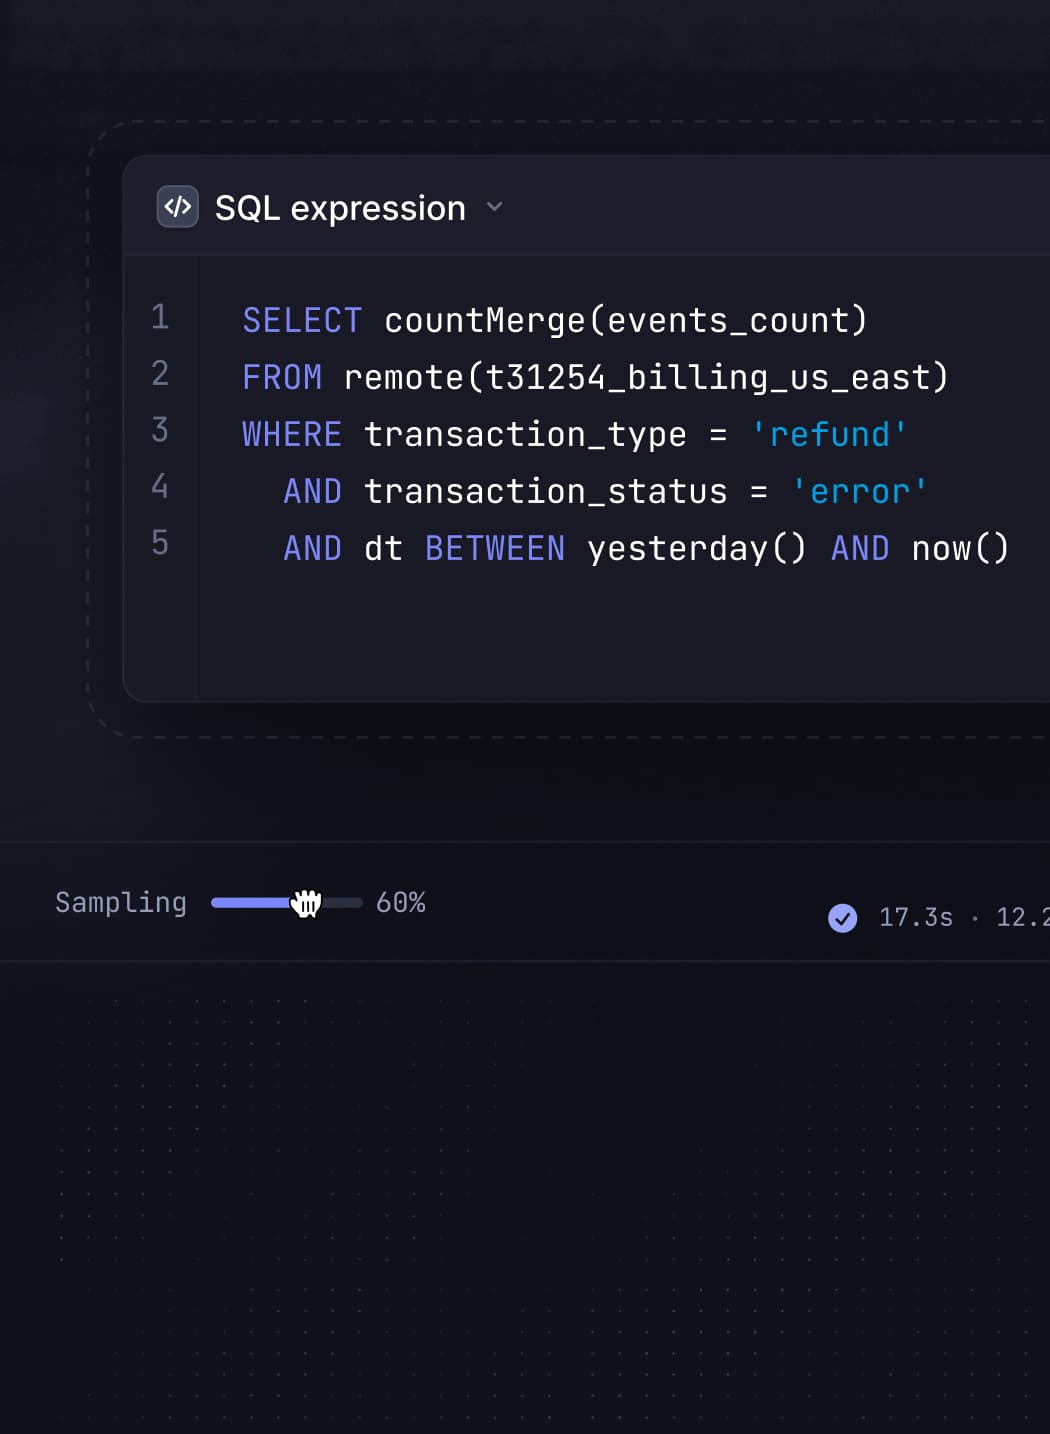
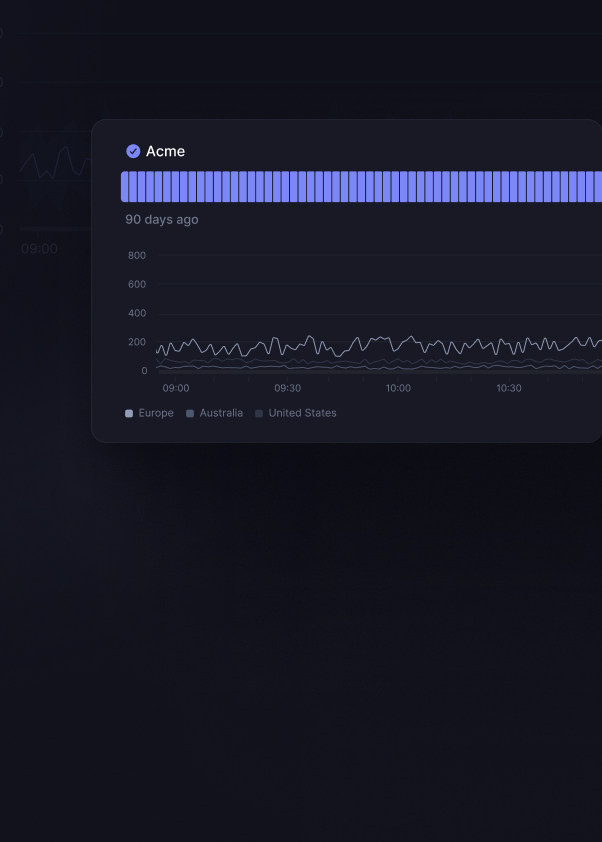
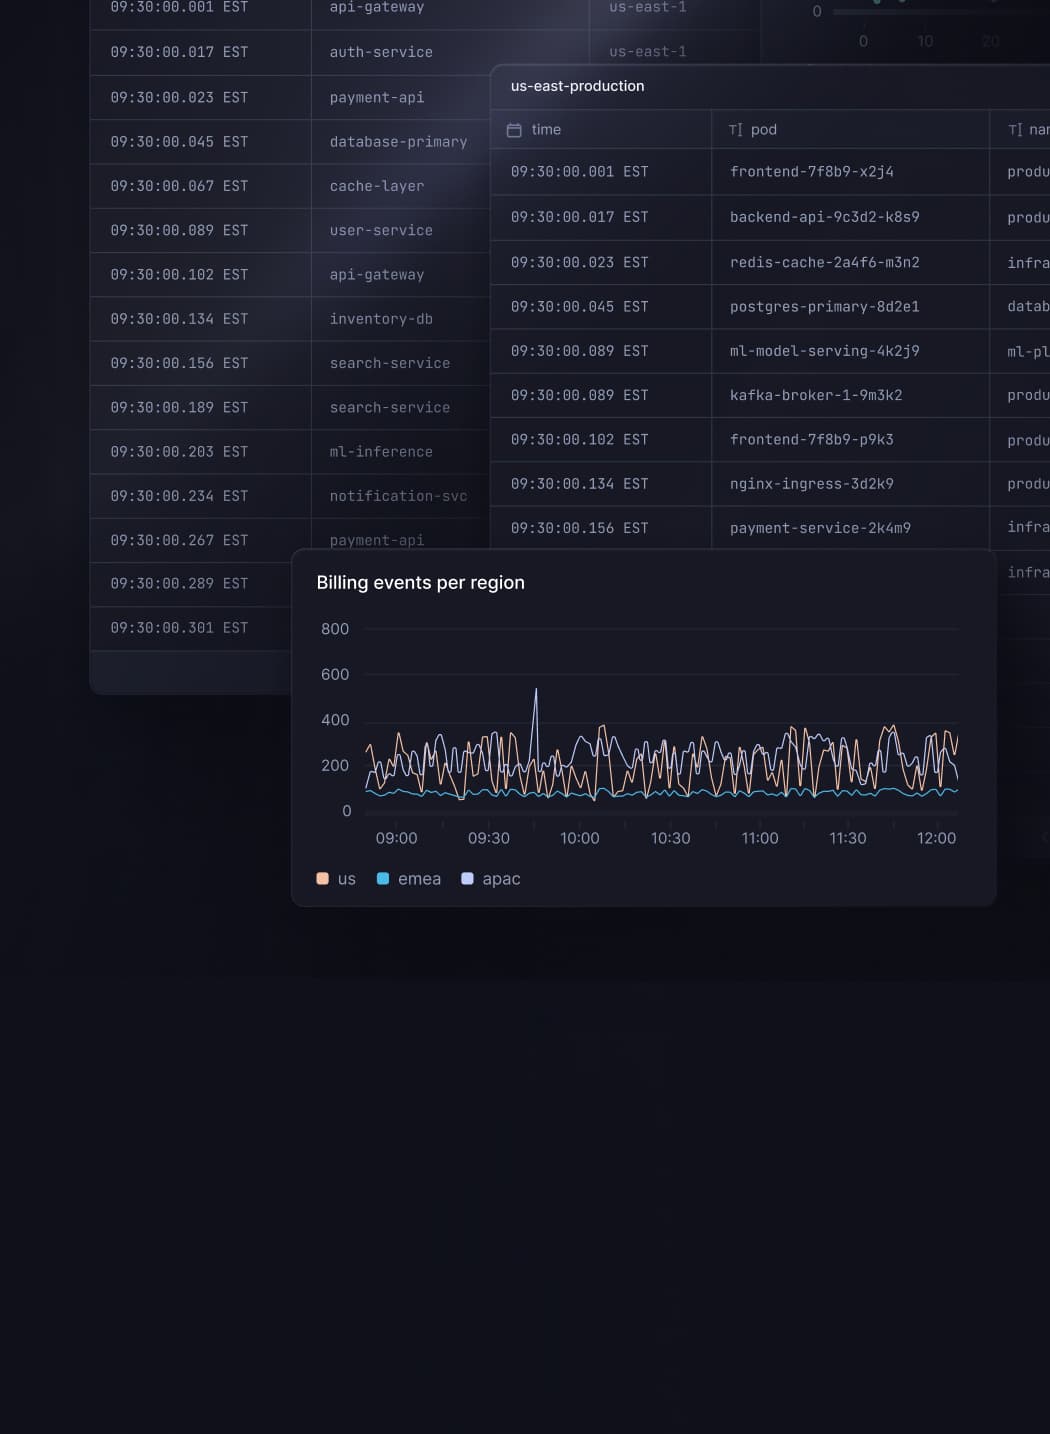
Analyze trends with analytical queries
Run arbitrary SQL queries at petabyte scale leveraging query time sampling.
Warehouse
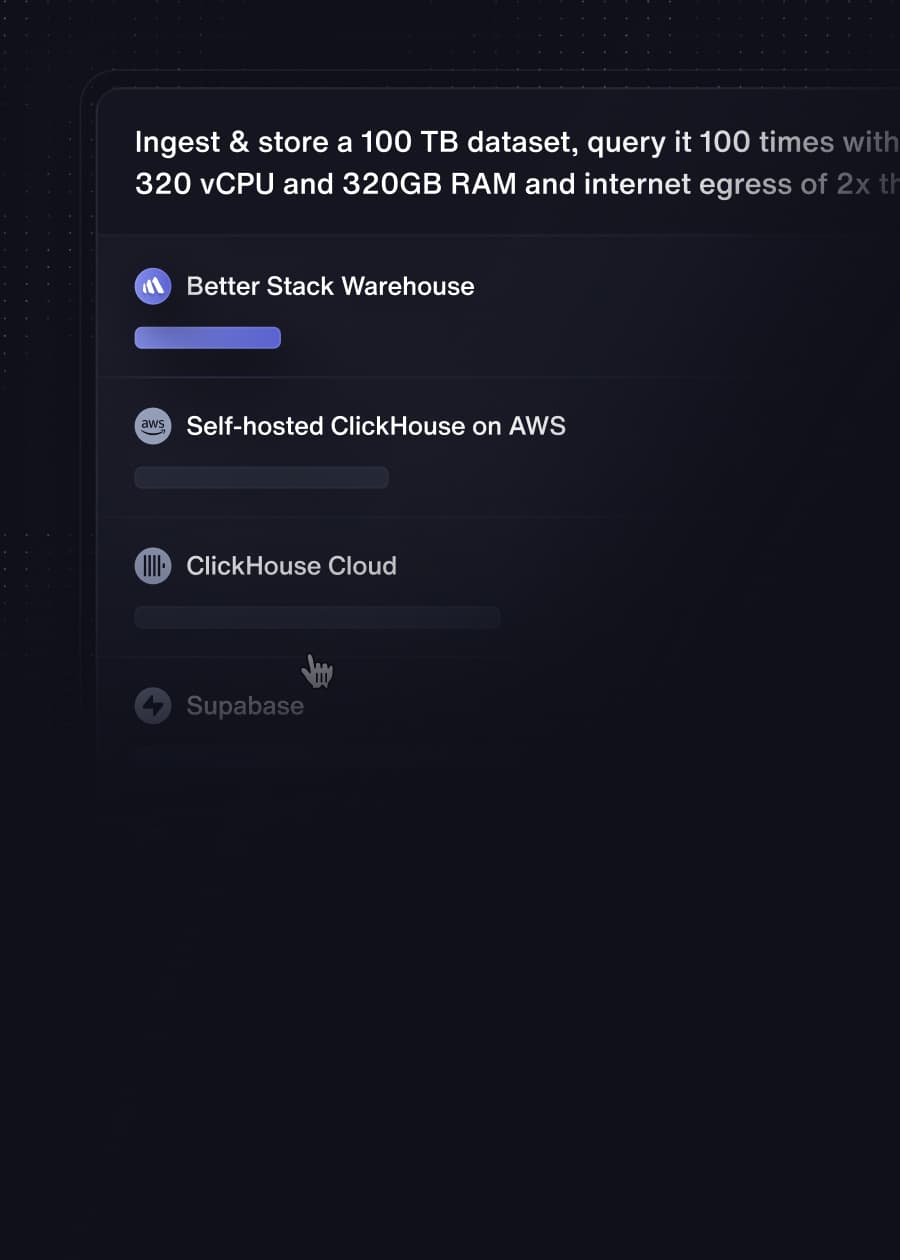
So affordable you’ll ask what’s wrong with it
Benefit from our economies of scale. We pass the savings on to you.
Cheaper than self-hosting on AWS.
Get serverless ClickHouse® as an API
Save query as a high-performance API you can securely call from frontend.

Built-in vector embeddings and approximate KNN
Generate vector embeddings without having to call an external API with our
built-in embedding model and query embeddings fast with vector indexes.
Open formats in your own S3 bucket
Store everything in your own cloud.
No vendor lock-in.
Analyze trends with analytical queries
Run arbitrary SQL queries at petabyte scale leveraging query time sampling.
At a fraction of
your current costs
Get an unrivaled price-to-performance ratio. Decrease your budget by 30x or keep your current budget but actually instrument all of your services, without sampling.
Ingest up to
33x more data
with the same budget
or save up to
97%
of your costs
An estimate only. Assumes annual payments, European data location, 1 responder with a production bundle, the average event size of 1 kB, $0.1 per 100 Datadog's "ingested custom metrics", 1 Datadog "ingested custom metric" being an approx. equivalent of 6,715 Better Stack's metric data points. Further assumes Datadog's $0.1 per ingested GB of spans & logs, and $2.5/million indexed spans & logs for 30 days. Adds up to $22,475 for metrics, $2,786 for logs, and $2,786 for spans per month.
Relied on by the world’s best engineering teams
Happy customers, growing market presence
Ship higher-quality software faster. Be the hero of your engineering teams.
Start monitoring for free or book a demo
Don’t just take our word for it
We're proud to be working with publicly traded companies as well as individual indie hackers and are thankful for their feedback, suggestions, and support.
@BetterStackHQ is one of the best products I've ever used. Went from 0-100 on logging in 15 minutes. Incredible
I tested @BetterStackHQ for @gamubsapp! So much easier to configure and the interface is better than @FreshworksInc!
@BetterStackHQ status page looks SO neat! A fantastic tool for SaaS products like @Snapodcast
By far @BetterStackHQ has given me more pleasant surprises other tool in this space. We had an outage due to a domain name expiring, and it turns out we can even be alered about that. Great user experience and UI on top of all the features. How is it not more popular?
One year one tool. @linear won my heart last year. This year so far, @BetterStackHQ is the frontrunner, well designed 👏
I just checked this out, and have never been so happy that I saw an ad 👏
Looking for a status page? I recommend
@BetterStackHQ.
Perfect support, answered my dms
in a couple of minutes, and it's the first actual cool looking status page which allows
custom domains (on the free plan 😱) haven't actually tried it, but it looks good so far.
#NotSponsor
Switched from @Statuspage to @BetterStackHQ over the week end, looking pretty good status.speakbox.ca
What are you using for logging and incident management?
For me the go to is currently
@BetterStackHQ
- love their simplicity and
powerful features. Would like to learn more about what's out there.
I'm utterly blown away by @BetterStackHQ! They do everything. I'm now monitoring one of our US servers for every kind of log Ubuntu creates, custom alerts for errors, website downtime, incident logging, Slack notifications, S3 log storage, and loads more. 😍
I absolutely love services like
@BetterStackHQ
simple, does a great job, and has a generous free plan for companies just starting out
I don't remember finding anything even close to it ~4 years ago when i was
looking for a monitoring tool for one of my projects
Please accept cookies
We use cookies to authenticate users, improve the product user experience, and for personalized ads. Learn more.