
Kochava’s cross-platform analytics empower marketers to dive into their performance data across 13 interactive views – capturing the big picture at a glance or drilling down to precise, granular detail.
| CARVIEW |
Select Language
HTTP/2 200
date: Thu, 02 Oct 2025 23:37:17 GMT
content-type: text/html; charset=UTF-8
vary: Accept-Encoding
server: Pagely-ARES/1.22.2
x-gateway-request-id: afb9eb427d06ee03381cd18439d6b8c7
link: ; rel="alternate"; title="JSON"; type="application/json"
link: ; rel=shortlink
access-control-allow-origin: *
x-gateway-cache-key: 1758904660.069|standard|https|www.kochava.com|||/product/data-and-analytics/app-analytics/
x-gateway-cache-status: MISS
x-gateway-skip-cache: 0
content-encoding: gzip
Real Time Mobile App Analytics | App Analytics Metrics by Kochava
Skip to main content
- Solutions
- Free App Analytics®
- Why Kochava
- Get Pricing
- Log In
Firebase Dynamic Links deprecated August 25. Get your links working again with Kochava SmartLinks.
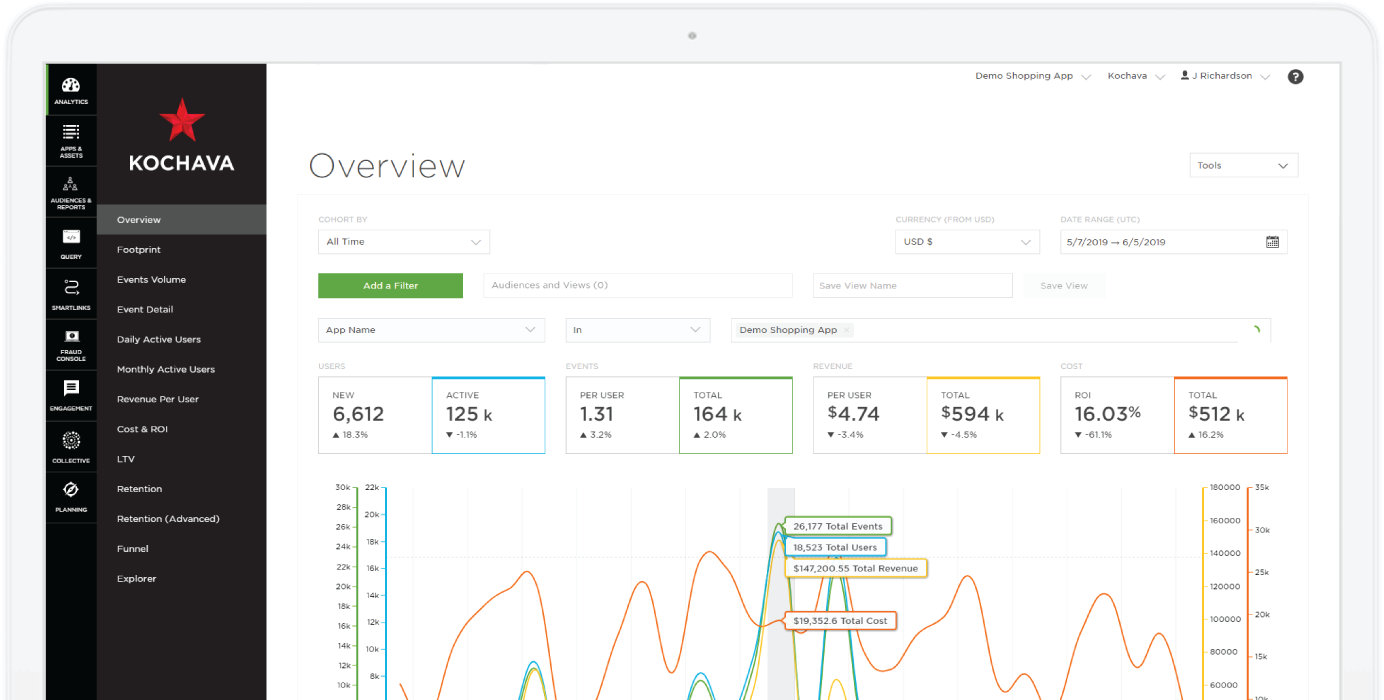
App Analytics Tools in Real Time
Visualize Your Campaign Performance as it’s Happening
1
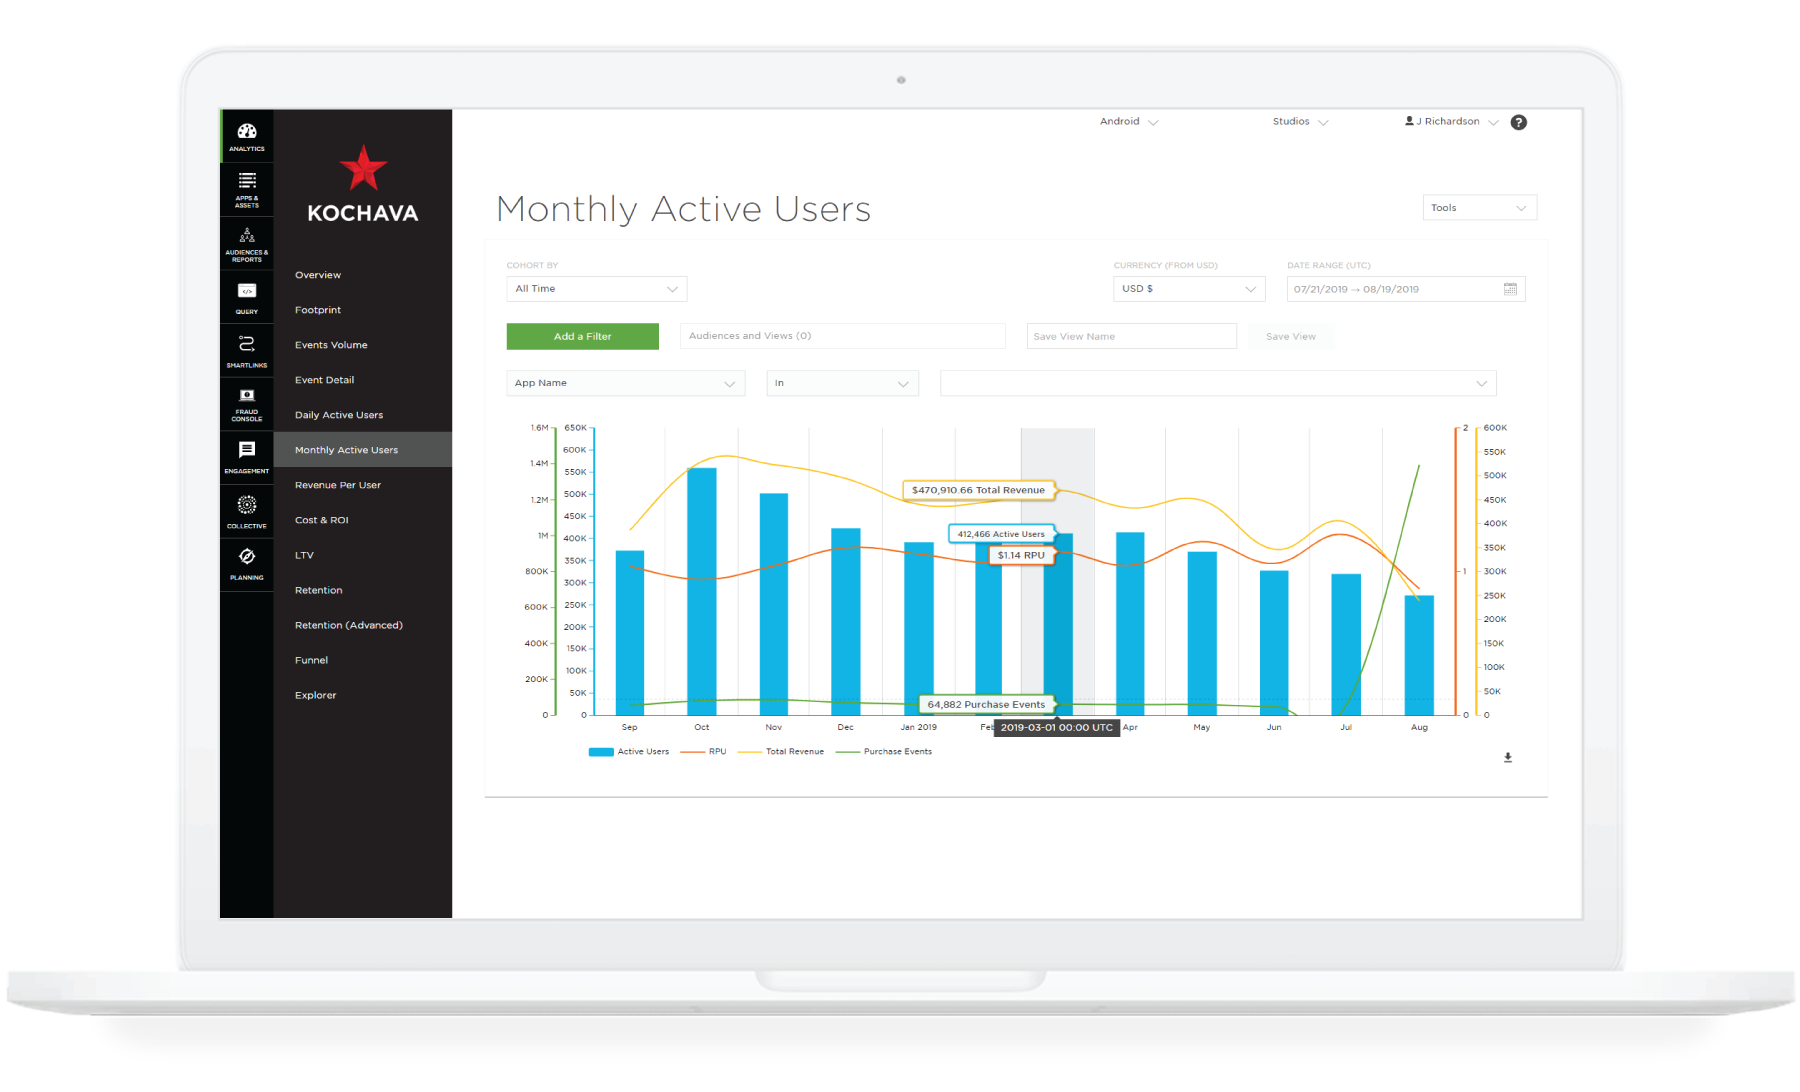
Analyze performance by specific cohorts or across all time
2
View stats across multiple apps and platforms simultaneously
3
Gather quick snapshots of key performance metrics
4
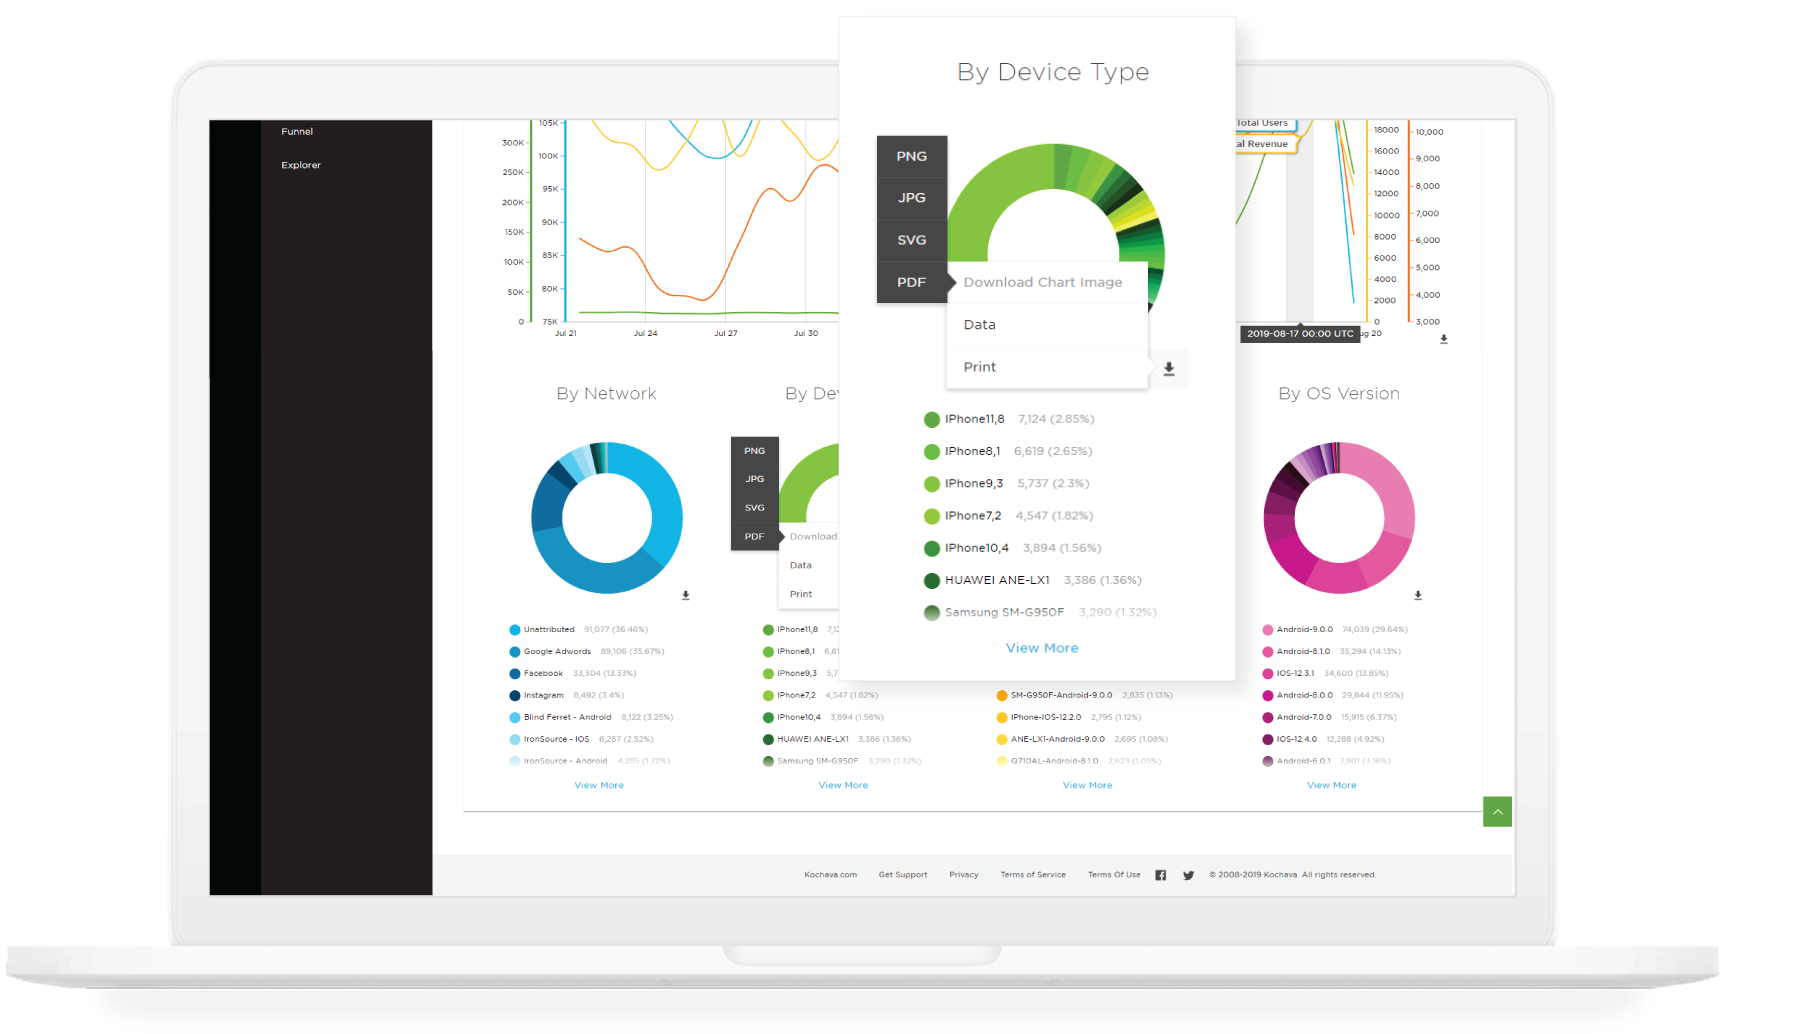
Explore and export data visuals
In today’s fast-paced world the success or failure of a marketing campaign can be decided in a matter of hours. Marketers need app analytics for instant visibility into key performance metrics to adapt in the moment and course-correct campaigns toward success.
REQUEST A DEMOKey metrics can be filtered and split by any combination of data attributes from channel and campaign down to specific creative IDs and keywords.
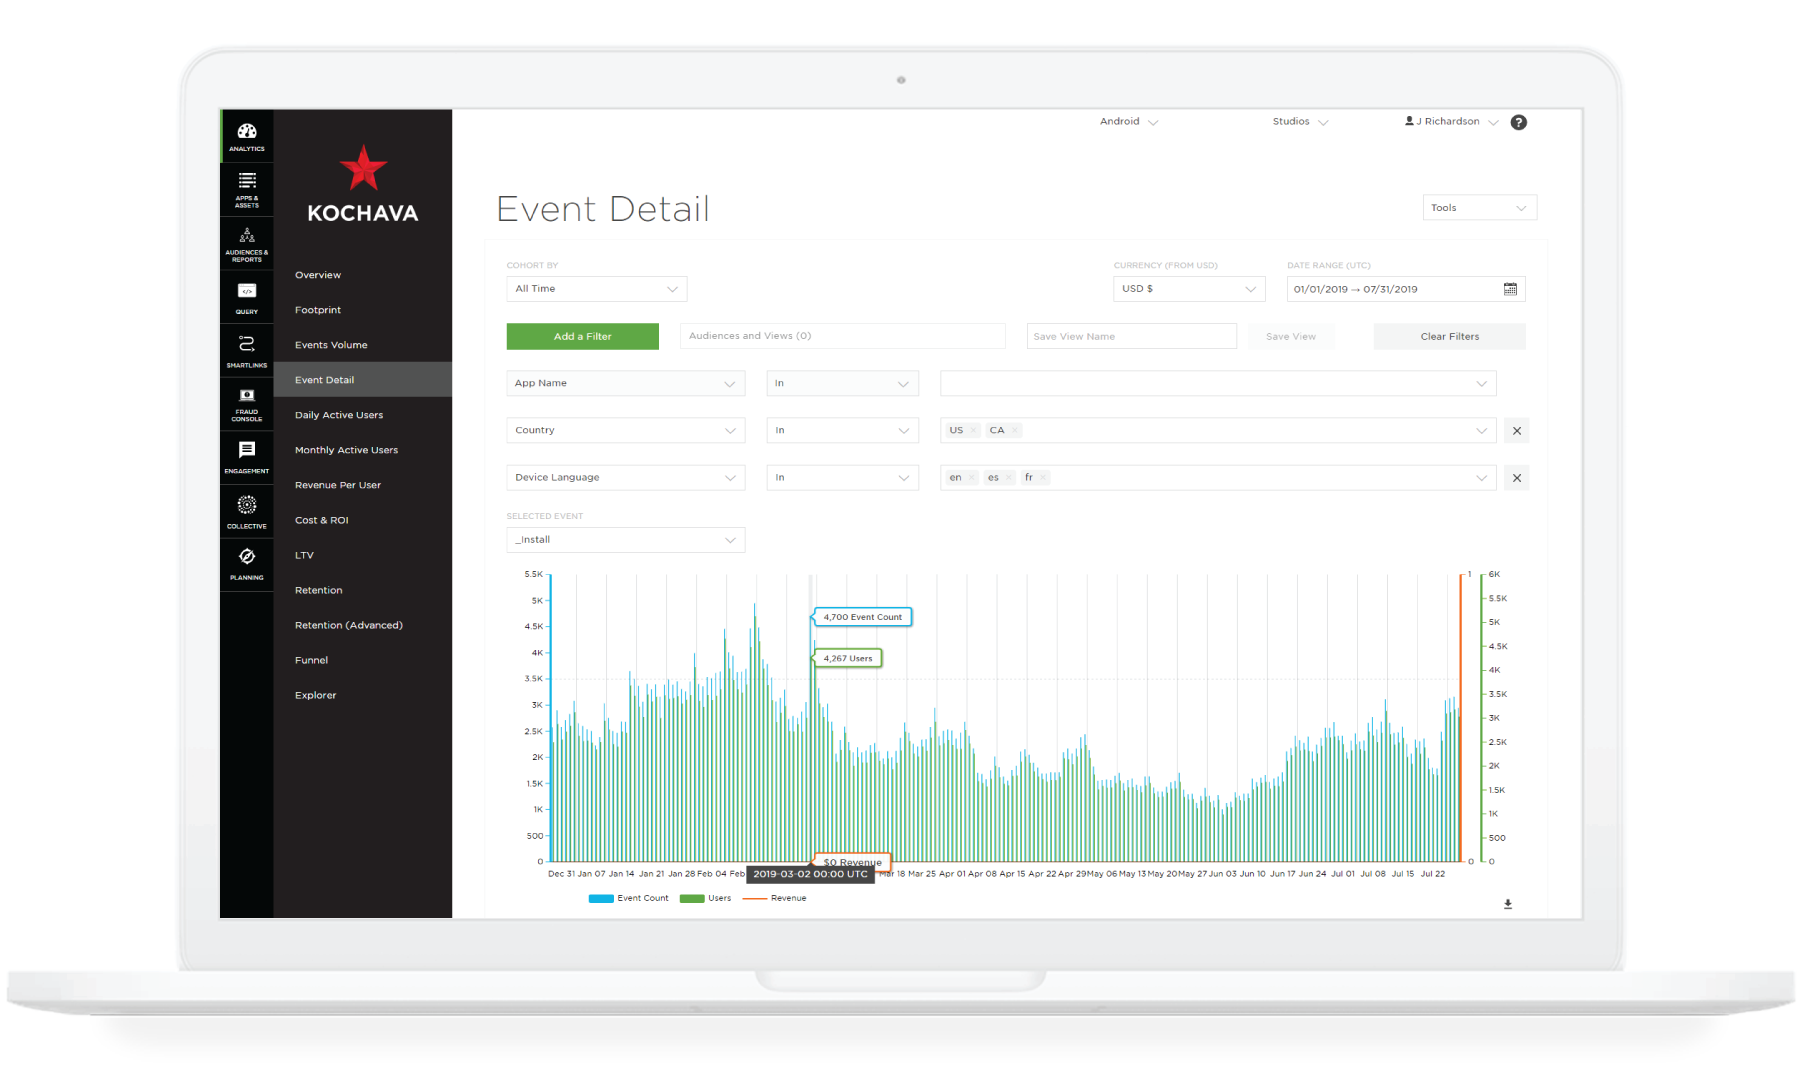
Visualize Key Performance Metrics
Monthly Active Users (MAU)
Daily Active Users (DAU)
Revenue Per User (RPU)
and more
Export Charts, Graphs & Datasets
Instantly download stunning data visuals
Export raw data to customize your own charts
Incorporate into your own internal reports
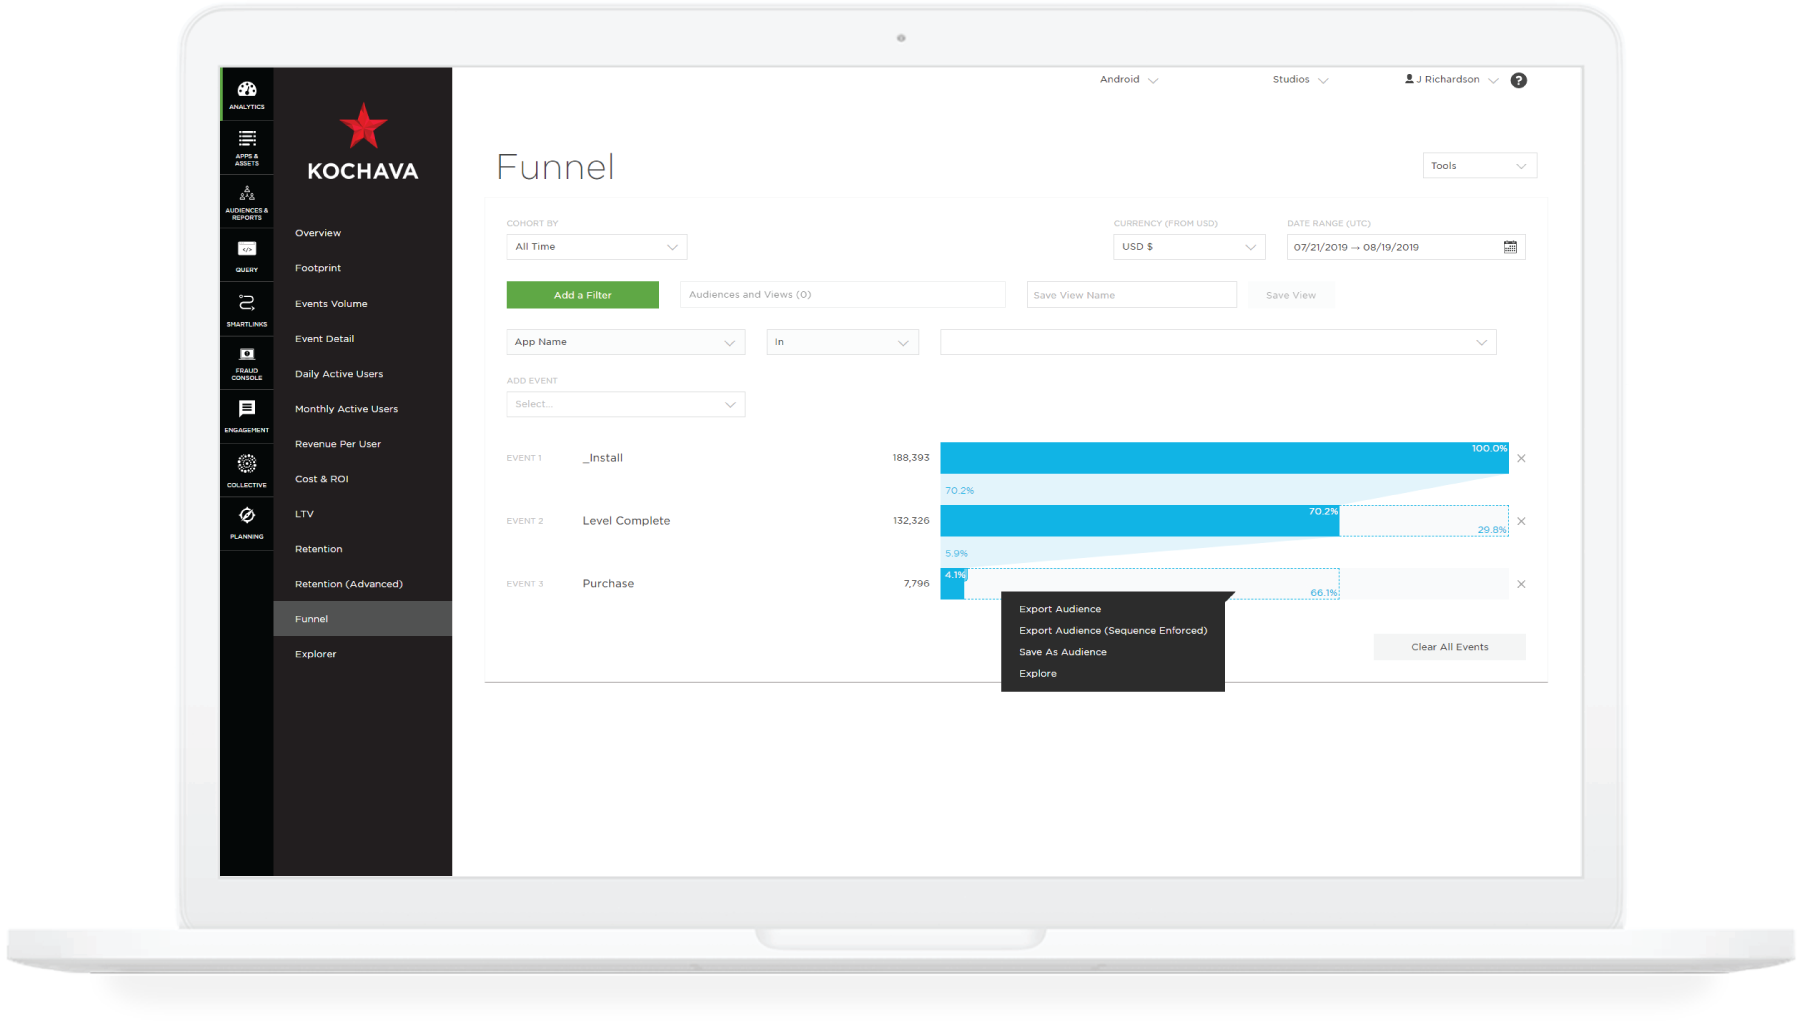
Explore the User Funnel
Analyze common event sequences
Identify user drop-off within the engagement funnel
Directly export or save audiences for retargeting
Create Flexible Filters
Robust filtering across any data attribute
Narrow to specific geos, campaigns and other dimensions
Save your favorite filters and views
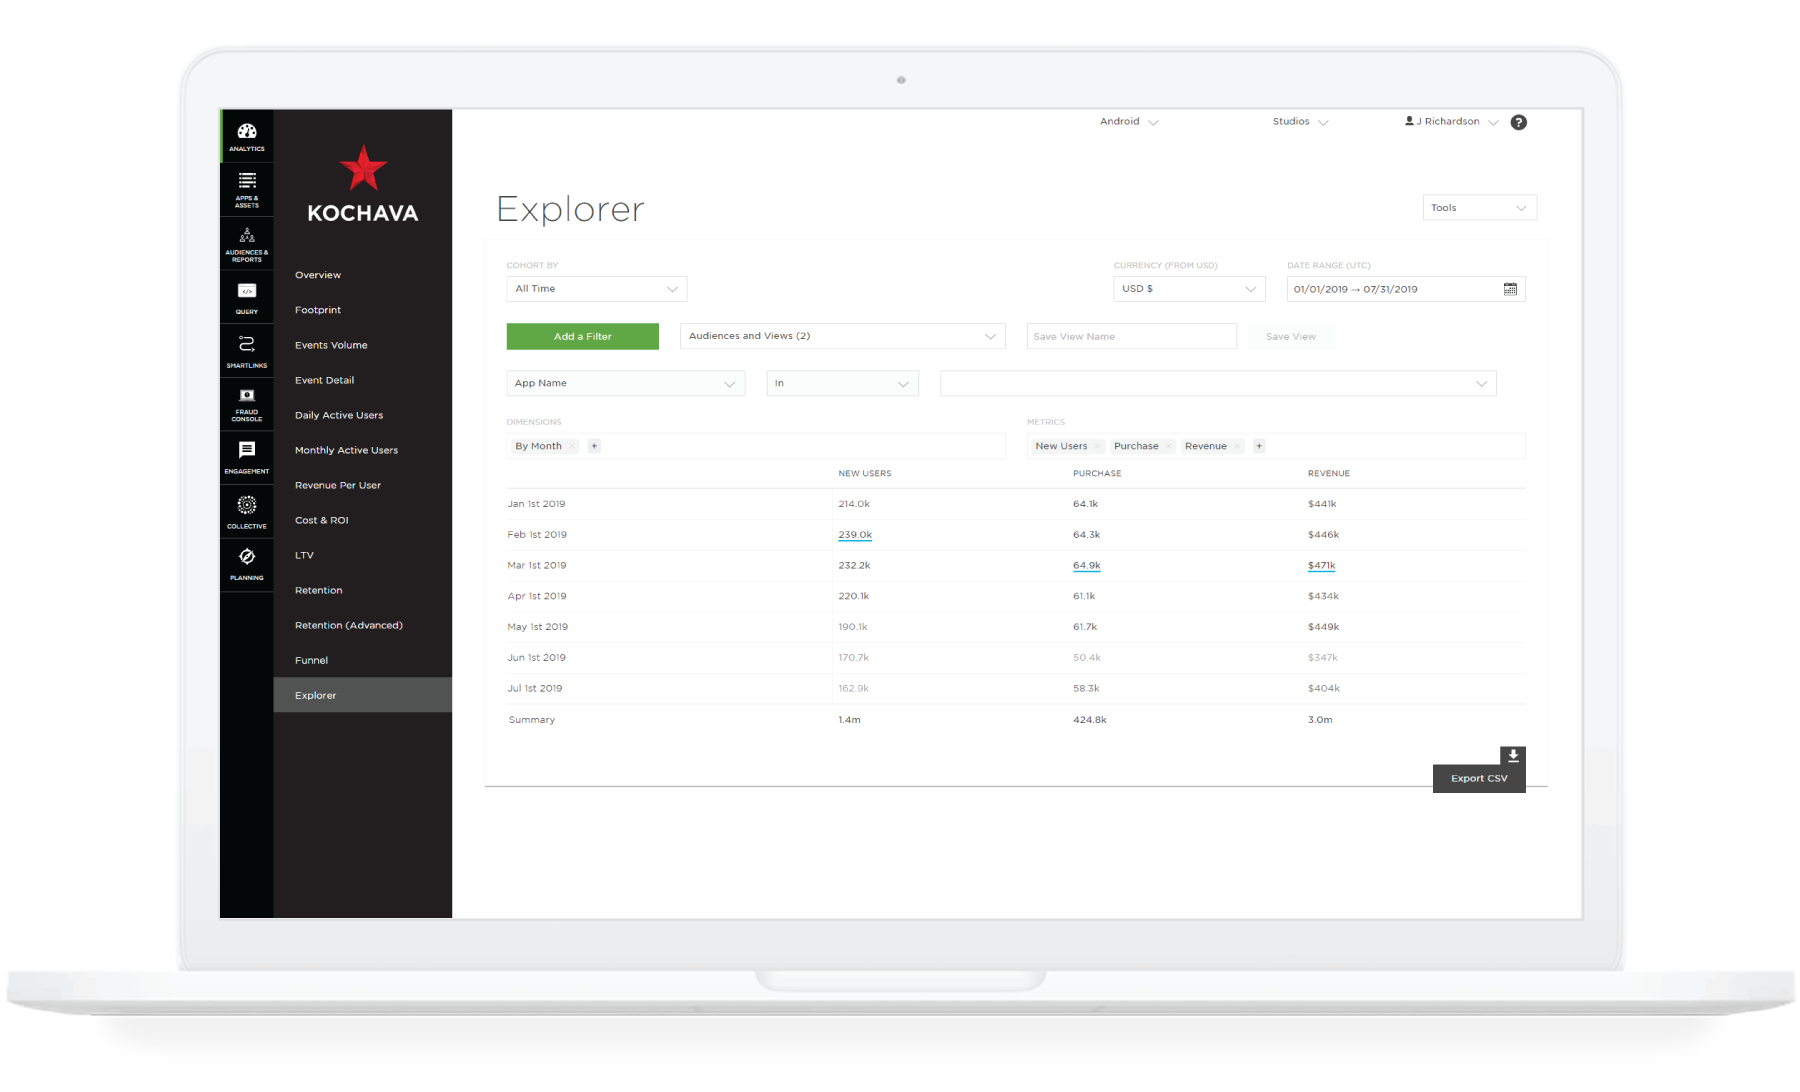
Build Your Own Reports
Explore your data in an interactive pivot table
Design custom reports
Easily export data
For a comprehensive review of Kochava Analytics, visit our support documentation.