| CARVIEW |
 Top 15 Python Libraries for Data Science in 2017
 Top 15 Python Libraries for Data Science in 2017
Since all of the libraries are open sourced, we have added commits, contributors count and other metrics from Github, which could be served as a proxy metrics for library popularity.
By Igor Bobriakov, ActiveWizards.
As Python has gained a lot of traction in the recent years in Data Science industry, I wanted to outline some of its most useful libraries for data scientists and engineers, based on recent experience.
And, since all of the libraries are open sourced, we have added commits, contributors count and other metrics from Github, which could be served as a proxy metrics for library popularity.
Core Libraries.
1. NumPy (Commits: 15980, Contributors: 522)
When starting to deal with the scientific task in Python, one inevitably comes for help to Python’s SciPy Stack, which is a collection of software specifically designed for scientific computing in Python (do not confuse with SciPy library, which is part of this stack, and the community around this stack). This way we want to start with a look at it. However, the stack is pretty vast, there is more than a dozen of libraries in it, and we want to put a focal point on the core packages (particularly the most essential ones).
The most fundamental package, around which the scientific computation stack is built, is NumPy (stands for Numerical Python). It provides an abundance of useful features for operations on n-arrays and matrices in Python. The library provides vectorization of mathematical operations on the NumPy array type, which ameliorates performance and accordingly speeds up the execution.
2. SciPy (Commits: 17213, Contributors: 489)
SciPy is a library of software for engineering and science. Again you need to understand the difference between SciPy Stack and SciPy Library. SciPy contains modules for linear algebra, optimization, integration, and statistics. The main functionality of SciPy library is built upon NumPy, and its arrays thus make substantial use of NumPy. It provides efficient numerical routines as numerical integration, optimization, and many others via its specific submodules. The functions in all submodules of SciPy are well documented — another coin in its pot.
3. Pandas (Commits: 15089, Contributors: 762)
Pandas is a Python package designed to do work with “labeled” and “relational” data simple and intuitive. Pandas is a perfect tool for data wrangling. It designed for quick and easy data manipulation, aggregation, and visualization.
There are two main data structures in the library:
“Series” — one-dimensional
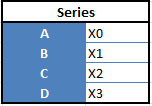
“Data Frames”, two-dimensional
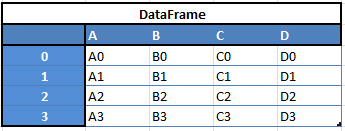
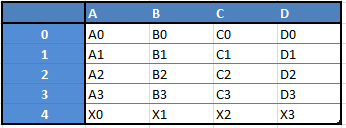
For example, when you want to receive a new Dataframe from these two types of structures, as a result you will receive such DF by appending a single row to a DataFrame by passing a Series:
Here is just a small list of things that you can do with Pandas:
- Easily delete and add columns from DataFrame
- Convert data structures to DataFrame objects
- Handle missing data, represents as NaNs
- Powerful grouping by functionality
Google Trends history
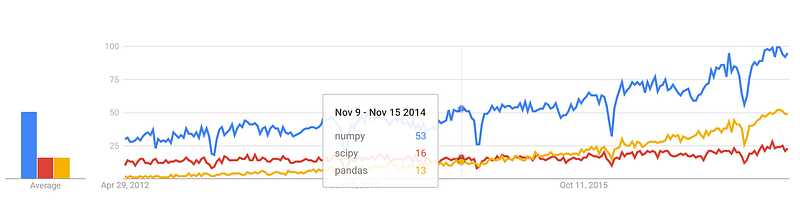
trends.google.com
GitHub pull requests history
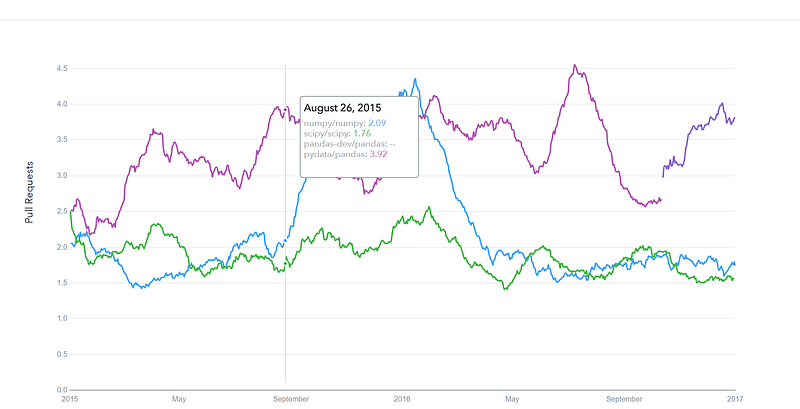
datascience.com/trends
Visualization.
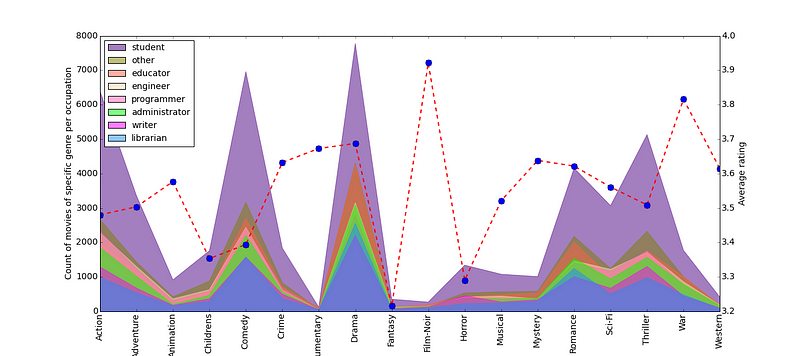
4.Matplotlib (Commits: 21754, Contributors: 588)
Another SciPy Stack core package and another Python Library that is tailored for the generation of simple and powerful visualizations with ease is Matplotlib. It is a top-notch piece of software which is making Python (with some help of NumPy, SciPy, and Pandas) a cognizant competitor to such scientific tools as MatLab or Mathematica.
However, the library is pretty low-level, meaning that you will need to write more code to reach the advanced levels of visualizations and you will generally put more effort, than if using more high-level tools, but the overall effort is worth a shot.
With a bit of effort you can make just about any visualizations:
- Line plots;
- Scatter plots;
- Bar charts and Histograms;
- Pie charts;
- Stem plots;
- Contour plots;
- Quiver plots;
- Spectrograms.
There are also facilities for creating labels, grids, legends, and many other formatting entities with Matplotlib. Basically, everything is customizable.
The library is supported by different platforms and makes use of different GUI kits for the depiction of resulting visualizations. Varying IDEs (like IPython) support functionality of Matplotlib.
There are also some additional libraries that can make visualization even easier.
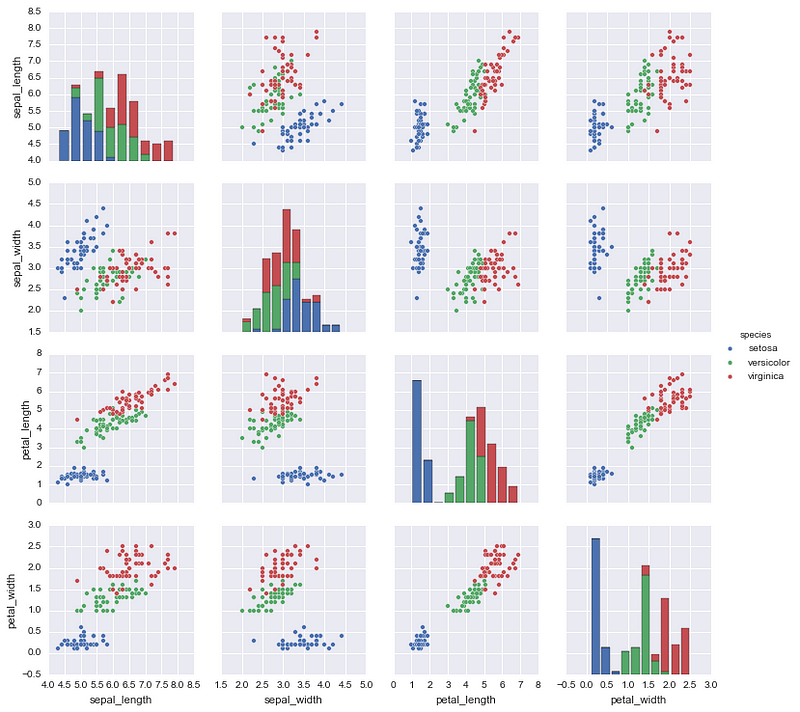
5. Seaborn (Commits: 1699, Contributors: 71)
Seaborn is mostly focused on the visualization of statistical models; such visualizations include heat maps, those that summarize the data but still depict the overall distributions. Seaborn is based on Matplotlib and highly dependent on that.
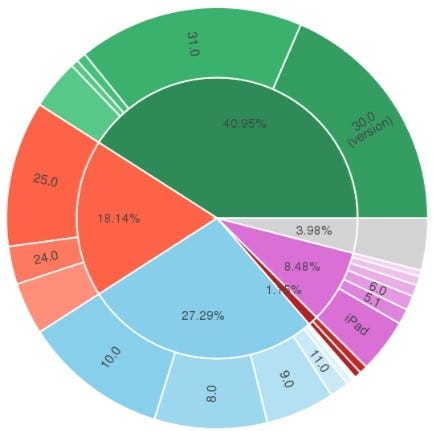
6. Bokeh (Commits: 15724, Contributors: 223)
Another great visualization library is Bokeh, which is aimed at interactive visualizations. In contrast to the previous library, this one is independent of Matplotlib. The main focus of Bokeh, as we already mentioned, is interactivity and it makes its presentation via modern browsers in the style of Data-Driven Documents (d3.js).
- Hyperparameter Optimization: 10 Top Python Libraries
- 5 Hidden Gem Python Libraries for Data Science
- 10 Essential Python Libraries for Data Science in 2024
- Python Tooling Beyond Pandas: Libraries to Broaden Your Data…
- A Guide to Top Natural Language Processing Libraries
- 10 Python Libraries Every Data Analyst Should Know
Pages: 1 2
Latest Posts
- We Benchmarked DuckDB, SQLite, and Pandas on 1M Rows: Here’s What Happened
- Prompt Engineering Templates That Work: 7 Copy-Paste Recipes for LLMs
- A Complete Guide to Seaborn
- 10 Command-Line Tools Every Data Scientist Should Know
- How I Actually Use Statistics as a Data Scientist
- The Lazy Data Scientist’s Guide to Exploratory Data Analysis
Top Posts |
|---|
- 5 Fun AI Agent Projects for Absolute Beginners
- How I Actually Use Statistics as a Data Scientist
- The Lazy Data Scientist’s Guide to Exploratory Data Analysis
- Prompt Engineering Templates That Work: 7 Copy-Paste Recipes for LLMs
- 10 Command-Line Tools Every Data Scientist Should Know
- A Gentle Introduction to TypeScript for Python Programmers
- We Benchmarked DuckDB, SQLite, and Pandas on 1M Rows: Here’s What Happened
- A Complete Guide to Seaborn
- From Excel to Python: 7 Steps Analysts Can Take Today
- A Gentle Introduction to MCP Servers and Clients