| CARVIEW |
The post AppLink Fundamentals III: Building with AppLink – Development Flow and Language Choices appeared first on Heroku.
]]>Tell me more about integrating with Agentforce?
Agentforce integration leverages AppLink’s full computational flexibility to extend agent capabilities far beyond native Salesforce functionality. Due to the compute power and framework availability at developers’ disposal, agents can return rich content – not just text data – including generated images, PDFs, complex calculations, and processed data from external APIs.
The Heroku Agentforce Tutorial provides comprehensive step-by-step guidance for creating custom Agent Actions, from initial setup through production deployment.
Real-world example: Automotive finance agent
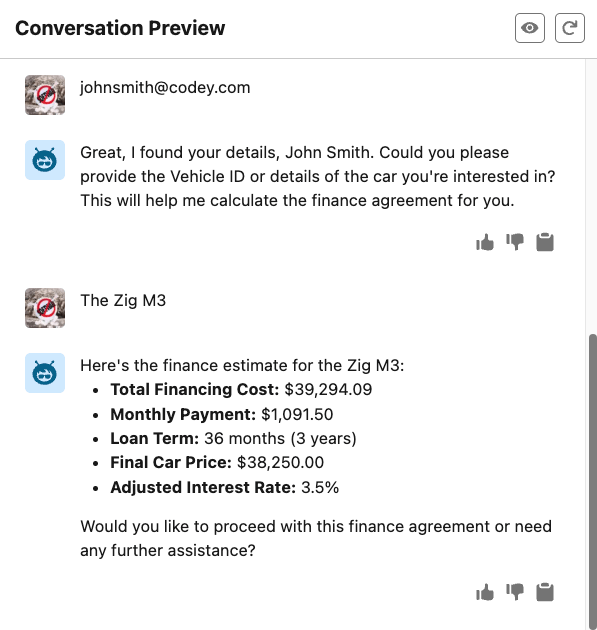
Car dealership agents need to provide instant, competitive finance estimates that consider complex pricing rules, customer credit profiles, and generate professional documentation. Here’s how a Koa Cars Finance Agent performs real-time credit assessments, applies complex pricing rules, and generates professional PDF agreements:
Customer: Finance estimate request
    ↓
Agent: "What's your contact email?"
    ↓
Customer: "johnsmith@codey.com"
    ↓
Agent: "Which car model interests you?"
    ↓
Customer: "I'm interested in the Zig M3 car"
    ↓
Agent: Calls Heroku Finance Service
The service also automatically generates a professional PDF finance agreement:
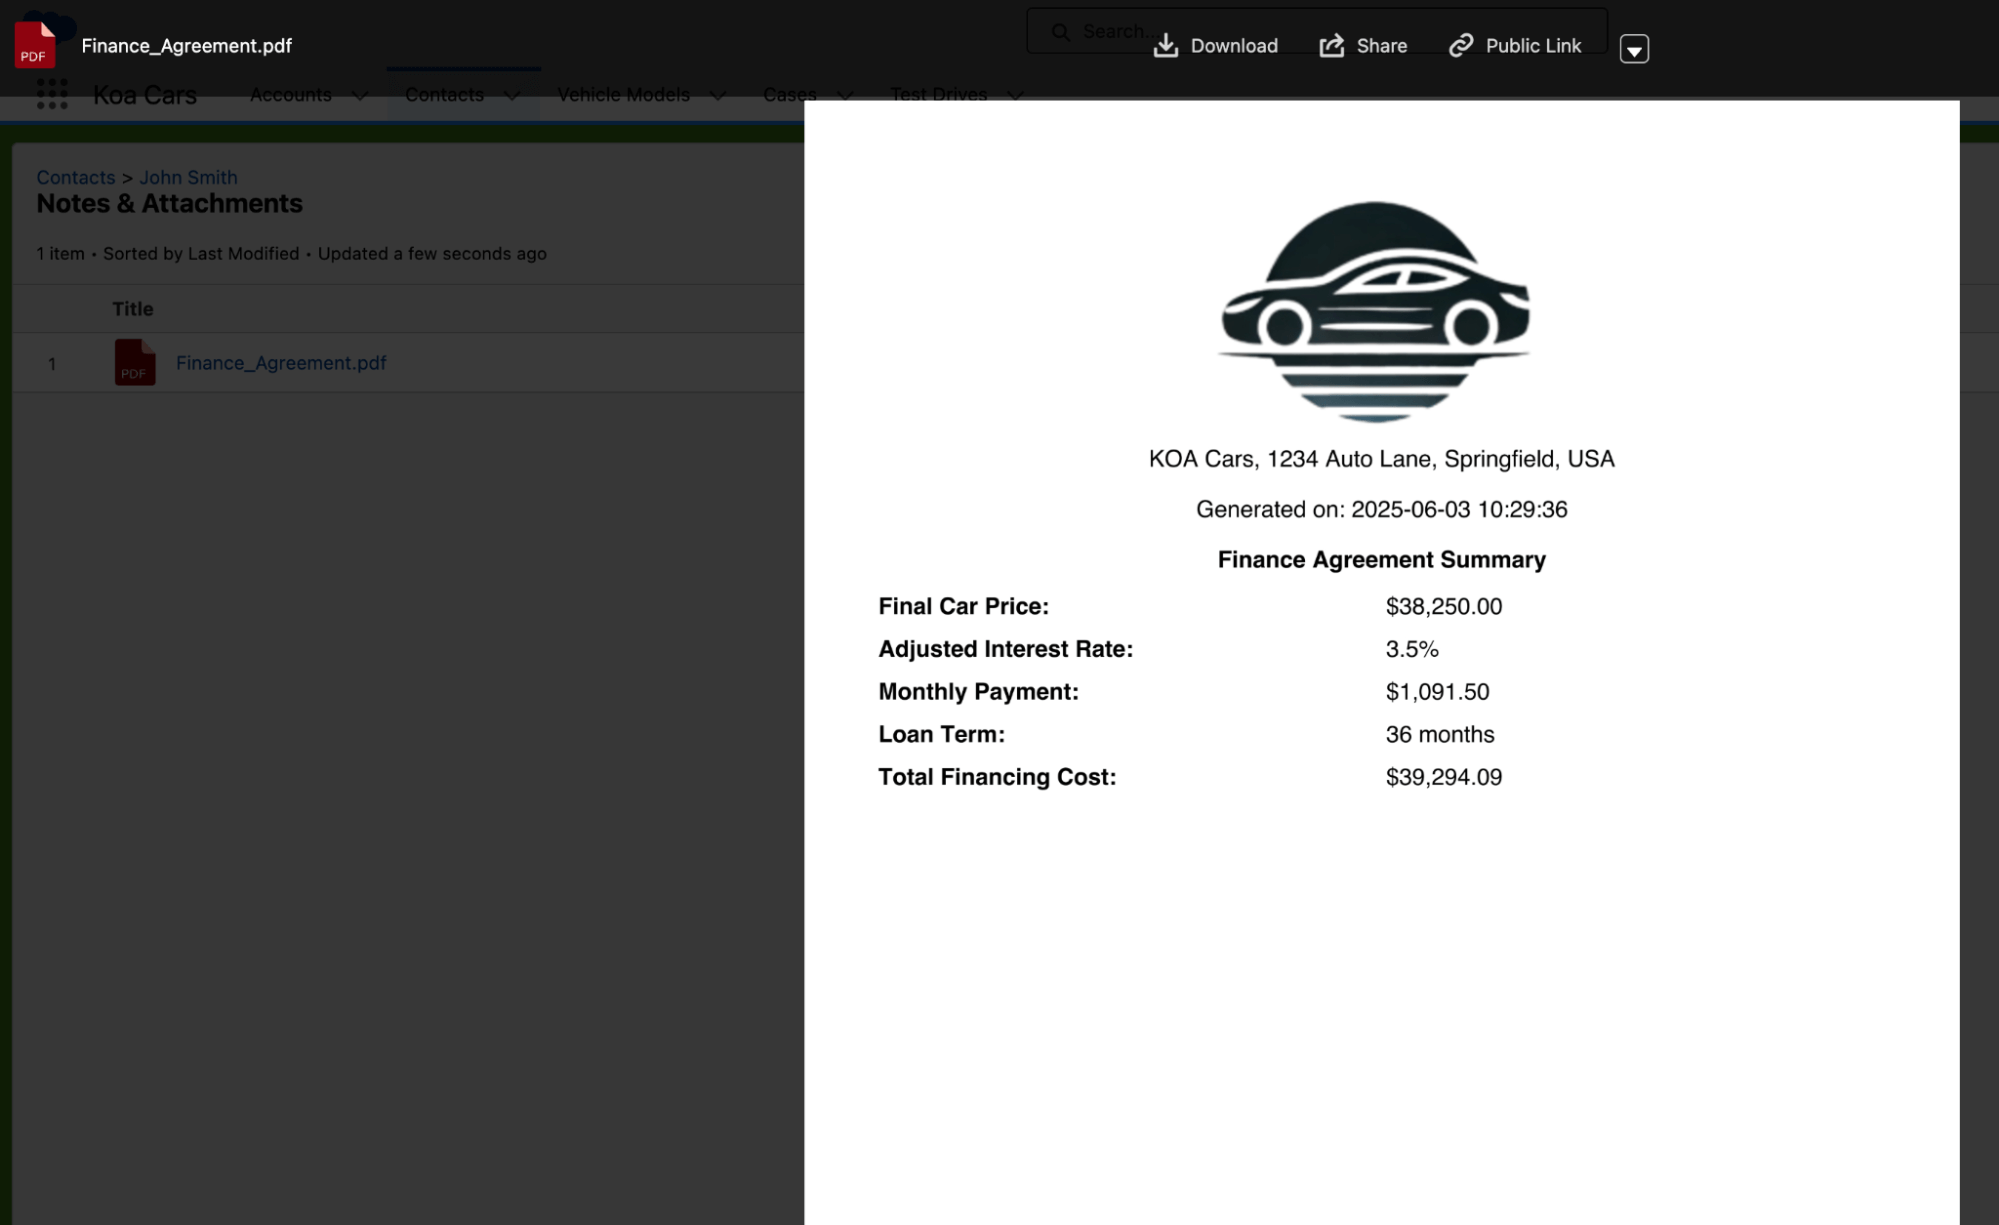
This demonstrates AppLink’s capability to handle complex business logic including multi-tier interest rate calculations, real-time credit assessments, dynamic pricing with dealer incentives, and automatic PDF generation – all while seamlessly integrating with Salesforce CRM data.
Enhanced OpenAPI configuration for agent actions
Agentforce requires additional OpenAPI YAML attributes beyond standard external service configuration. AppLink automatically handles these specialized requirements when you include the appropriate x-sfdc agent extensions:
x-sfdc:
  agent:
    topic:
      classificationDescription: "This API allows agents to calculate automotive finance estimates, assess credit profiles, and generate professional documentation."
      scope: "Your job is to assist customers with vehicle financing by providing instant competitive estimates, applying complex pricing rules, and generating finance agreements."
      instructions:
        - "If the customer asks for finance estimates, collect contact email and vehicle model information."
        - "Use real-time credit assessment and dealer-specific pricing rules for accurate calculations."
        - "Generate professional PDF agreements and attach them to Contact records automatically."
      name: "automotive_finance_topic"
    action:
      publishAsAgentAction: true
      isUserInput: true
      isDisplayable: true
  privacy:
    isPii: true
These extensions enable:
- Agent Topic Generation: Creates logical groupings of related actions for agent organization – agent topics help agents understand when and how to use your services
- Action Publishing: Automatically makes your endpoints available as Agent Actions within the defined topic
- User Input Configuration: Controls whether fields require additional user input
- Display Configuration: Determines which response fields are shown to users
- Privacy Controls: Enables PII handling for sensitive operations
For complete details on OpenAPI configuration for Agentforce, see Configuring OpenAPI Specification for Heroku AppLink.
Development flow
The AppLink development workflow supports rapid iteration across Salesforce environments, from scratch orgs to production deployments. Understanding the development tools and processes ensures smooth implementation and reliable deployments.
Local development
Local development with AppLink focuses on testing Pattern 2 applications (Extending Salesforce) that receive requests from Salesforce. Pattern 1 applications (API access) don’t require special local testing since they make outbound calls to Salesforce APIs directly.
The invoke.sh script (found in /bin folders of sample applications) simulates requests from Salesforce with the correct headers, enabling local development and testing before deployment. For example, see the Pattern 3 invoke.sh script for testing batch operations locally.
Usage: ./bin/invoke.sh [session-based-permission-set]
The script provides several key features for development workflow:
- User Authentication Simulation: The script uses the Salesforce CLI to extract org details including access tokens, API versions, and org identifiers. It constructs the required
x-client-contextheader with base64-encoded JSON containing authentication and context information that your application would receive from Salesforce in production. - Permission Set Testing: For applications requiring elevated permissions (user mode plus), the script supports session-based permission set activation through a third parameter. It automatically creates and removes
SessionPermSetActivationrecords, allowing developers to test permission-dependent functionality locally before deploying to environments where these permissions would be granted through Flows, Apex, or Agentforce configurations. - Request Payload Simulation: The script accepts JSON payloads as parameters, enabling testing of various request scenarios and edge cases. This capability is essential for validating business logic and error handling before moving to integration testing.
To use the invoke.sh script for local testing, authenticate with your target org using the Salesforce CLI, then execute the script with your org alias and request payload:
# Authenticate with your Salesforce org
sf org login web --alias my-org

# Install dependencies and start local development server
npm install
npm run dev  # or npm start depending on your package.json scripts

# In a separate terminal, test locally with simulated Salesforce headers
./bin/invoke.sh my-org 'https://localhost:8080/api/generatequote' '{"opportunityId": "006am000006pS6P"}'
This local development workflow integrates seamlessly with your existing Node.js development tools – use nodemon for auto-reloading, your preferred debugger, and standard logging libraries. The invoke.sh script is language and framework agnostic, working with any technology stack you choose for your Heroku application.
Managing changes to the OpenAPI specification
Managing changes in the interface between your Heroku application and Salesforce requires careful attention to the OpenAPI specification file that defines your service contract. This specification serves as the single source of truth for both your application’s API endpoints and the Salesforce components that consume them.
When developing new features or modifying existing endpoints, maintaining specification alignment prevents breaking changes that could disrupt dependent Salesforce components. The OpenAPI specification defines not only the request and response schemas but also the HTTP methods, status codes, and error formats that your consuming Flows, Apex classes, or Agentforce Actions expect.
Salesforce enforces this alignment through validation during the publish process. If you attempt to publish an updated application with breaking changes to an existing specification, and there are active Apex classes, Flows, or Agentforce Actions referencing those endpoints, the publish command will fail with validation errors. This protection mechanism prevents accidental service disruptions in production environments.
For development environments where you need to iterate rapidly on service interfaces, scratch orgs provide the flexibility to start fresh when needed. However, if you’re working with persistent sandboxes or production environments, you have two options when breaking changes are necessary: either remove all references to the modified endpoints from your Flows, Apex classes, and Agentforce Actions before publishing, or use a different client name parameter in the CLI publish command to create a parallel service definition, for example --client-name MyService_v2.
Using scratch orgs
Scratch orgs represent the optimal development environment for AppLink applications, particularly when your service interfaces change frequently during development. Unlike traditional sandboxes, scratch orgs provide a clean, disposable environment that can be recreated as needed when breaking changes occur or when you need to test deployment scenarios from ground zero.
The key advantage of scratch orgs for AppLink development lies in their ability to start fresh without the complexity of cleaning up existing references, published applications, or permission configurations. When your service evolves significantly, you can create a new scratch org, configure the necessary features, and test your complete deployment pipeline without worrying about conflicts from previous iterations.
To configure a scratch org for AppLink development, you must enable the required features in your scratch org definition file. For standard Salesforce integration, include the HerokuAppLink feature in your project’s config/project-scratch-def.json:
{
  "orgName": "AppLink Development",
  "edition": "Developer",
  "features": ["HerokuAppLink"],
  "settings": {
    "lightningExperienceSettings": {
      "enableS1DesktopEnabled": true
    }
  }
}
For Data Cloud integration scenarios, also include the CustomerDataPlatform feature alongside HerokuAppLink. Once configured, create and authenticate with your scratch org using standard Salesforce CLI commands, then proceed with your AppLink connection and deployment workflow.
Scratch orgs excel in scenarios where you’re developing new integration patterns, testing permission model changes, or validating deployment automation. They provide the confidence that your deployment process works correctly from a clean state, which is essential for production readiness. While traditional sandboxes remain valuable for longer-term testing scenarios and stakeholder demonstrations, scratch orgs offer the rapid iteration cycle that modern development practices require.
CI/CD integration
The JWT-based authentication flow (heroku salesforce:connect:jwt) integrates seamlessly with scratch org workflows, enabling automated connection setup as part of your CI/CD pipeline. This capability allows you to script complete environment provisioning, from scratch org creation through application deployment and testing, providing reproducible development environments for your entire team.
Coding language choices
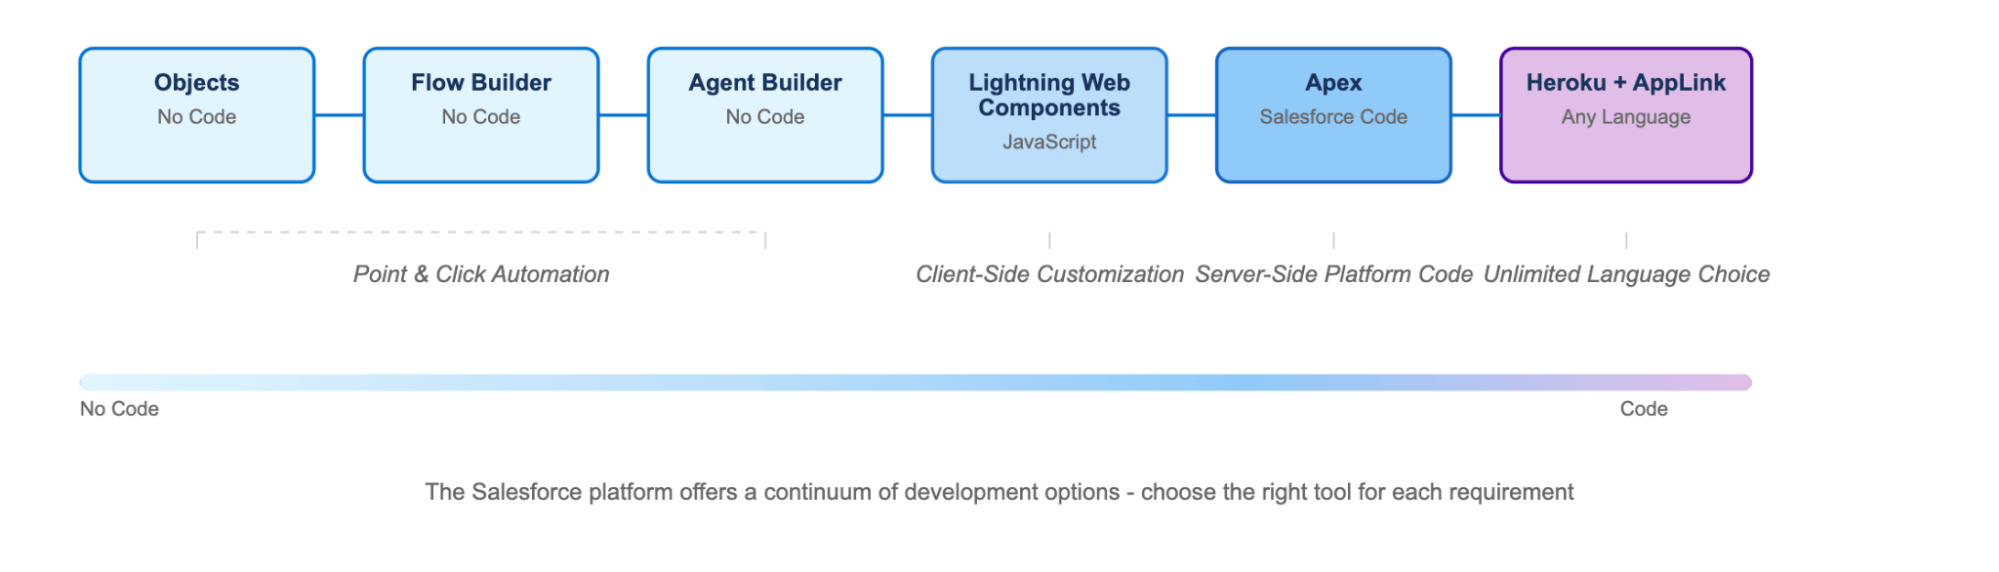
When extending Salesforce functionality, choosing the right programming language depends on your specific requirements, team expertise, and operational constraints. While Apex remains a powerful option for many scenarios, AppLink opens up the entire spectrum of modern programming languages, each bringing unique capabilities and development ecosystems to your Salesforce solutions.
The following comparison helps you understand the tradeoffs between Apex and other programming languages when building Salesforce extensions, highlighting where each approach excels and the specific capabilities that become available when hosting code on Heroku using the AppLink add-on. Consider using Apex for transaction-critical operations requiring database triggers and system-level access, while leveraging AppLink and modern programming languages for computationally intensive tasks, external integrations, and scenarios where existing code investments can be preserved and extended.
| Capability | Apex | Node.js, Python, Java…* |
|---|---|---|
| Fully Managed Trusted Infrastructure |  |
|
| Extend Apex, Flow and Agentforce | |
|
| Record Update Logic in Transaction | |
Triggers not supported |
| Secure by Default | With Annotations | |
| Run as User | With Annotations | |
| Run as System | Default | Principle of Least Privilege** |
| Limits Handling | Fixed CPU Timeout, Heap and Concurrency Limits | Elastic Horizontal and Vertical Scale*** |
| Extend Existing Code Investment | N/A | |
* Capabilities only available when hosting code on Heroku using the Heroku AppLink Add-on
** Heroku logic can leverage Session-based Permission Sets to elevate beyond user permissions
*** Salesforce API limits still apply; use Unit of Work patterns to make optimal use of updates
AppLink also enables developers with skills in your wider organization or hiring pool to contribute to Salesforce programs using languages they’re already proficient in, expanding your team’s ability to deliver sophisticated Salesforce extensions without requiring specialized Apex training.
Summary
AppLink represents a fundamental shift in how developers can extend Salesforce, breaking through traditional platform limitations to bring unlimited computational flexibility to the Salesforce ecosystem. With enterprise-grade security through User Mode authentication, seamless integration where Heroku applications appear natively within Salesforce through generated Apex classes, Flow actions, and Agentforce capabilities, and support for unlimited language choice in Node.js, Python, Java, and other languages, AppLink bridges the gap between Salesforce’s declarative power and unlimited programming flexibility.
Whether you’re extending core CRM functionality, building sophisticated agent actions, or integrating with external systems, AppLink provides the foundation for enterprise-grade Salesforce extensions using the languages and frameworks you know best.
Read More of the AppLink Fundamentals series
- AppLink Fundamentals I: AppLink Integration Patterns – Connecting Salesforce to Heroku Applications
- AppLink Fundamentals II: Advanced AppLink Integrations – Automation & AI
- AppLink Fundamentals III: Building with AppLink – Development Flow and Language Choices
The post AppLink Fundamentals III: Building with AppLink – Development Flow and Language Choices appeared first on Heroku.
]]>Extending Salesforce automation, code, and AI
Once your Heroku application is deployed and connected using AppLink, it becomes available for invocation from Apex, Flow, and Agentforce. The key to this integration is the OpenAPI specification that…
The post AppLink Fundamentals II: Advanced AppLink Integrations – Automation & AI appeared first on Heroku.
]]>
Extending Salesforce automation, code, and AI
Once your Heroku application is deployed and connected using AppLink, it becomes available for invocation from Apex, Flow, and Agentforce. The key to this integration is the OpenAPI specification that describes your endpoints, enabling automatic service discovery and registration in Salesforce.
OpenAPI specification integration
AppLink uses your OpenAPI (YAML or JSON) specification to understand your service capabilities and generate the appropriate Salesforce integration artifacts. Here’s an example from the Pattern 2 sample showing how the generateQuote operation is defined:
components:
  schemas:
    QuoteGenerationRequest:
      type: object
      required:
        - opportunityId
      description: Request to generate a quote, includes the opportunity ID to extract product information
      properties:
        opportunityId:
          type: string
          description: A record Id for the opportunity

paths:
  /api/generatequote:
    post:
      operationId: generateQuote
      summary: Generate a Quote for a given Opportunity
      description: Calculate pricing and generate an associated Quote.
      requestBody:
        content:
          application/json:
            schema:
              $ref: "#/components/schemas/QuoteGenerationRequest"
      x-sfdc:
        heroku:
          authorization:
            connectedApp: GenerateQuoteConnectedApp
            permissionSet: GenerateQuotePermissions
      responses:
        "200":
          description: OK
          content:
            application/json:
              schema:
                $ref: "#/components/schemas/QuoteGenerationResponse"
The x-sfdc section contains Salesforce-specific metadata that AppLink uses to configure authentication and permissions. When you run heroku salesforce:publish, this specification becomes:
- Generated Apex classes with strongly-typed request/response objects
- External Service definitions visible in Flow Builder’s Action palette
- Agent Actions available for Agentforce configuration
- Connected App and Permission Set configurations for secure access
Rather than writing OpenAPI specifications manually (which can be tedious and error-prone), most AppLink samples leverage the schema definition features already built into popular Node.js frameworks. The Pattern 2 sample uses Fastify’s schema system to automatically generate the specification, but similar approaches work with Express.js using libraries like swagger-jsdoc or express-openapi:
// From heroku-applink-pattern-org-action-nodejs/src/server/routes/api.js
const quoteGenerationSchema = {
  operationId: 'generateQuote',
  summary: 'Generate a Quote for a given Opportunity',
  'x-sfdc': {
    heroku: {
      authorization: {
        connectedApp: 'GenerateQuoteConnectedApp',
        permissionSet: 'GenerateQuotePermissions'
      }
    }
  },
  body: { $ref: 'QuoteGenerationRequest#' },
  response: {
    200: { schema: { $ref: 'QuoteGenerationResponse#' } }
  }
};
This approach ensures your API documentation stays synchronized with your implementation while providing the metadata Salesforce needs for seamless integration.
Invoking from Apex
AppLink enables both synchronous and asynchronous invocation from Apex:
Synchronous Invocation: Your Heroku service appears as a generated Apex class that you can invoke directly:
// From heroku-applink-pattern-org-action-nodejs sample
HerokuAppLink.GenerateQuote service = new HerokuAppLink.GenerateQuote();
HerokuAppLink.GenerateQuote.generateQuote_Request request = new HerokuAppLink.GenerateQuote.generateQuote_Request();
HerokuAppLink.GenerateQuote_QuoteGenerationRequest body = new HerokuAppLink.GenerateQuote_QuoteGenerationRequest();
body.opportunityId = '006SB00000DItEfYAL';
request.body = body;
System.debug('Quote Id: ' + service.generateQuote(request).Code200.quoteId);
The generated classes handle authentication, serialization, and HTTP communication automatically. Synchronous calls are subject to Apex callout limits and timeout constraints.
Asynchronous Invocation with Callbacks: For long-running operations beyond Apex governor limits, AppLink supports asynchronous processing with callback handling. This requires additional OpenAPI specification using the standard callbacks definition to define the callback endpoint that Salesforce will invoke when processing completes.
This pattern enables background processing workflows where your Heroku application can perform extensive calculations or external API integrations without blocking the Salesforce user interface. For detailed callback configuration examples, see Getting Started with AppLink and Pattern 3: Scaling Batch Jobs.
Invoking from Flow
Flow Builder provides no-code access to your Heroku applications through External Service Actions. After publishing your service, it appears automatically in the Action palette:
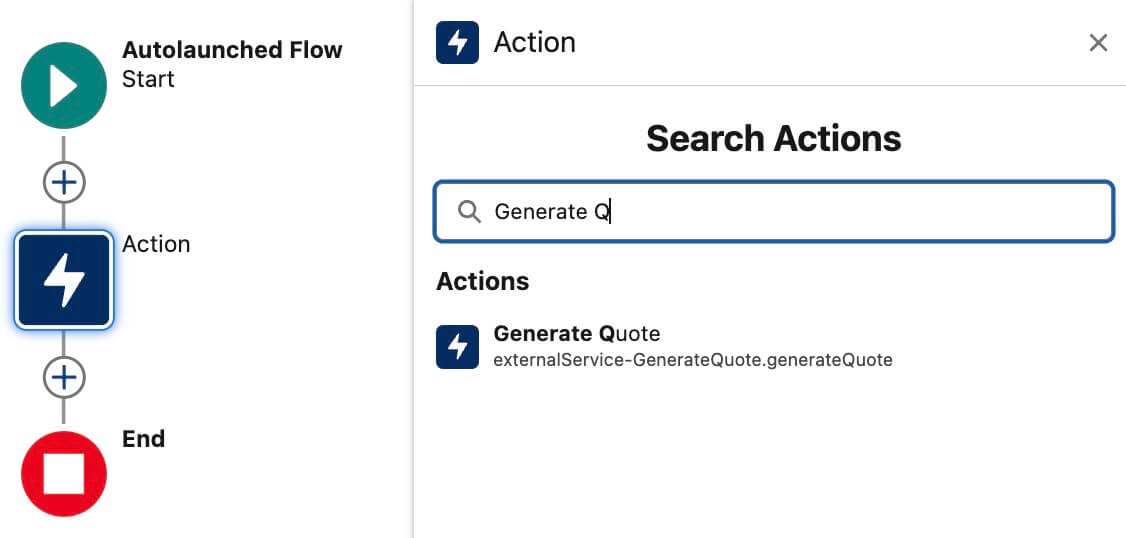
Flow Builder integration
Flow developers can drag your Heroku operation onto the canvas, configure input variables, and capture output data just like any other Flow action. This enables sophisticated business automation combining Salesforce’s declarative tools with your custom processing logic.
Invoking from Agentforce
Agentforce leverages your Heroku applications as Agent Actions organized within Agent Topics through the enhanced OpenAPI configuration detailed in the dedicated Agentforce section below. Once configured with the appropriate x-sfdc agent extensions, agents can automatically invoke your Heroku endpoints to fulfill user requests requiring specialized processing, external API calls, or complex calculations beyond native Salesforce capabilities.
Permission elevation and security
AppLink operates using User Mode authentication, meaning your code inherits the exact permissions of the Salesforce user who triggers the operation. This provides the most secure integration by following the principle of least privilege.
However, for scenarios where your application needs to access data or perform operations beyond the triggering user’s permissions, AppLink supports elevated permissions (known as “user mode plus” in the main documentation) through Permission Sets. This optional advanced feature allows administrators to grant specific additional permissions that are activated exclusively during code execution.
For example, your Heroku application might need to access sensitive discount override fields that regular users cannot see, or create records in objects where users have read-only access. The Permission Set approach ensures these elevated permissions are:
- Explicitly defined and administrator-controlled
- Only active during Heroku application execution
- Visible through standard Salesforce Permission Set management
- Applied temporarily without changing the user’s permanent permissions
For detailed implementation guidance including permission set configuration and testing approaches, see the Pattern 2 sample documentation.
What’s next?
This blog has explored how AppLink facilitates advanced integrations with Salesforce, extending capabilities across Data Cloud, automation with Flow and Apex, and intelligent interactions with Agentforce. We’ve seen how OpenAPI specifications streamline service discovery and how AppLink’s permission model offers granular control over elevated access.
In our final blog, we’ll shift focus to the practical aspects of the development workflow, including local testing, managing OpenAPI changes, and crucial considerations when choosing between Apex and other programming languages for your Salesforce extensions. Stay tuned for insights into building and deploying your AppLink solutions with confidence.
Read More of the AppLink Fundamentals series
- AppLink Fundamentals I: AppLink Integration Patterns – Connecting Salesforce to Heroku Applications
- AppLink Fundamentals II: Advanced AppLink Integrations – Automation & AI
- AppLink Fundamentals III: Building with AppLink – Development Flow and Language Choices
The post AppLink Fundamentals II: Advanced AppLink Integrations – Automation & AI appeared first on Heroku.
]]>Usage patterns
AppLink supports four proven integration patterns , but we'll focus on the two primary patterns that represent the main integration approaches - the other two patterns are variations of…
The post AppLink Fundamentals I: AppLink Integration Patterns – Connecting Salesforce to Heroku Applications appeared first on Heroku.
]]>
Usage patterns
AppLink supports four proven integration patterns, but we’ll focus on the two primary patterns that represent the main integration approaches – the other two patterns are variations of these same foundational concepts. Note that these patterns align with AppLink’s three official user modes: Pattern 1 corresponds to “run-as-user mode”, while Pattern 2 uses both “user mode” and “user mode plus” (for elevated permissions). Let’s explore both core patterns with their specific architectures and implementation approaches.
Pattern 1: Salesforce API access
This pattern uses run-as-user mode authentication, which enables system-level operations with consistent, predictable permissions by using a specific designated user’s context. This approach is ideal for automated processes and customer-facing applications that require stable permission sets and don’t depend on the triggering user’s access level. Run-as-user authorizations allow your Heroku applications to access Salesforce data across multiple orgs with the permissions of the designated user.
For a Heroku application that accesses Salesforce APIs, you need:
- AppLink Add-on:
heroku addons:create heroku-applink - AppLink CLI Plugin: Install the Heroku CLI plugin for deployment commands
- Org Login: An org login for a user with the ‘Manage Heroku Apps’ permission
- AppLink SDK (optional): For your chosen language to simplify integration
Here’s the complete command sequence for deploying and connecting a Node.js application with Salesforce API access, adapted from our Pattern 1 sample:
# Create and configure Heroku app
heroku create
heroku addons:create heroku-applink --wait
heroku buildpacks:add heroku/nodejs
heroku config:set HEROKU_APP_ID="$(heroku apps:info --json | jq -r '.app.id')"

# Connect to Salesforce org(s) using run-as-user mode
heroku salesforce:authorizations:add my-org
heroku config:set CONNECTION_NAMES=my-org

# Deploy application
git push heroku main
heroku open
Your application retrieves named authorizations and performs SOQL queries across multiple Salesforce orgs. The SDK simplifies multi-org connectivity through the AppLink add-on, which manages authentication and connection pooling automatically.
The first step in your Node.js application is initializing the AppLink SDK and retrieving a specific named authorization. This follows familiar Node.js patterns where connection details are managed through environment variables:
// From heroku-applink-pattern-api-access-nodejs/index.js
const sdk = init();

// Get connection names from environment variable
const connectionNames = process.env.CONNECTION_NAMES ?
  process.env.CONNECTION_NAMES.split(',') : []

// Initialize connection for specific org
const org = await sdk.addons.applink.getAuthorization(connectionName.trim())
console.log('Connected to Salesforce org:', {
  orgId: org.id,
  username: org.user.username
})
Once you have an org connection, executing SOQL queries becomes straightforward using the Data API. The SDK handles authentication, session management, and provides structured responses that are easy to work with:
// Execute SOQL query using the Data API
const queryResult = await org.dataApi.query('SELECT Name, Id FROM Account')
console.log('Query results:', {
  totalSize: queryResult.totalSize,
  done: queryResult.done,
  recordCount: queryResult.records.length
})

// Transform the records to expected format
const accounts = queryResult.records.map(record => ({
  Name: record.fields.Name,
  Id: record.fields.Id
}))
For Java developers, refer to the SalesforceClient.java class in the Java Pattern 1 sample for equivalent functionality. This implementation directly uses the AppLink API endpoint GET /authorizations/{connection_name} as described in the AppLink API documentation, demonstrating how to integrate without the SDK by making HTTP calls to ${HEROKU_APPLINK_API_URL}/authorizations/{developerName} with Bearer token authentication.
When you run the sample application locally or deploy it to Heroku, the code above produces a web interface that displays Account records from your connected Salesforce orgs. The application demonstrates both single-org and multi-org connectivity, with automatic authentication handling through the AppLink add-on:

The interface shows Account records from each connected org, along with connection details and bulk API capabilities. This demonstrates how AppLink simplifies multi-org data access patterns that would otherwise require complex OAuth flows and session management.
Pattern 2: Extending Salesforce
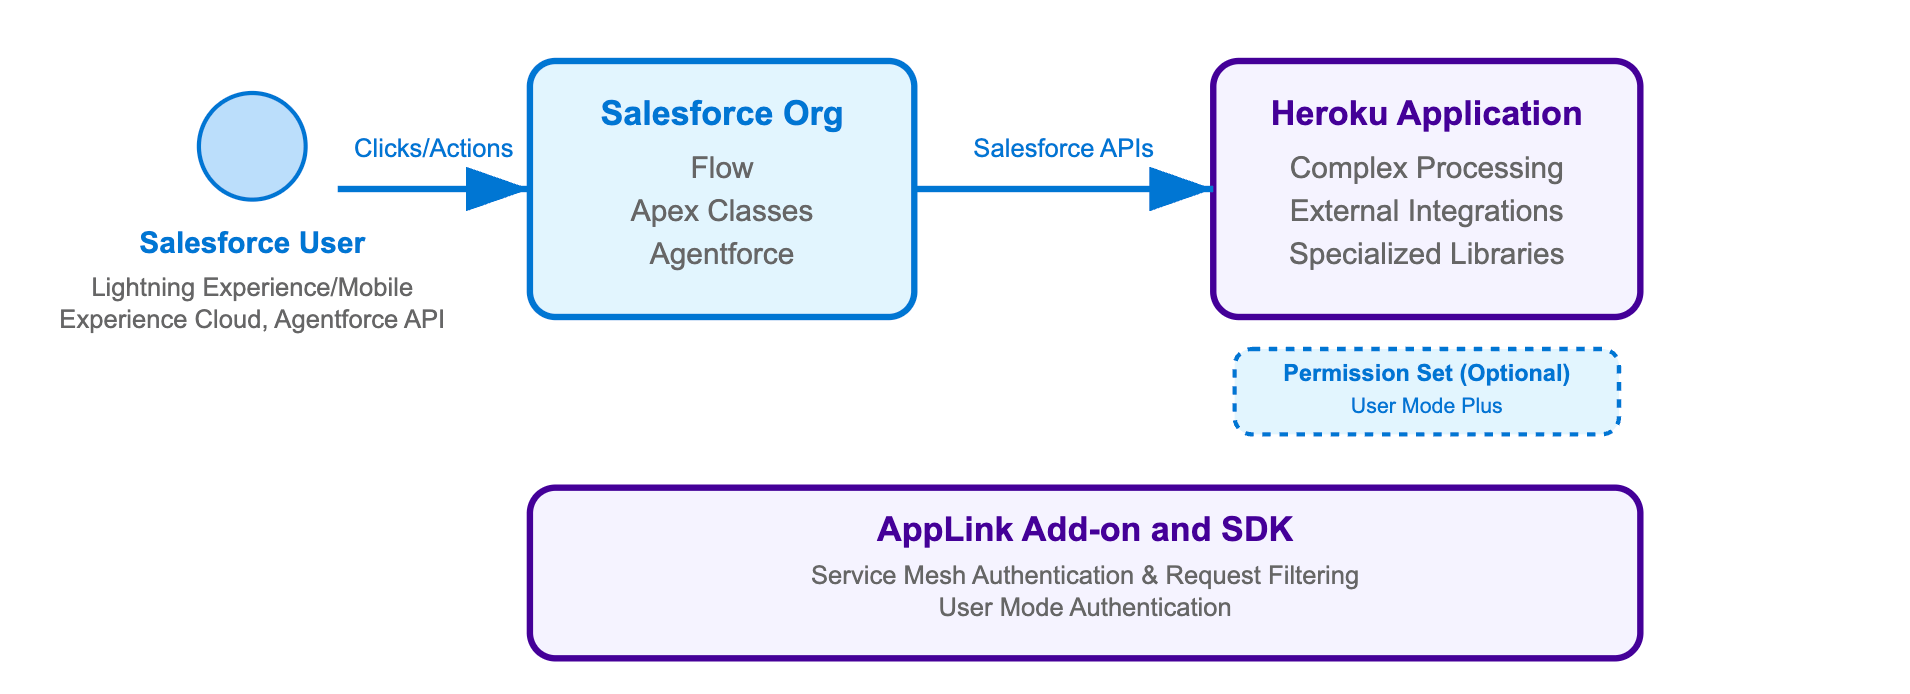
This pattern enables Salesforce users to invoke your Heroku applications directly from within Salesforce through Flow, Apex, or AgentForce. Your application becomes a published service that extends Salesforce capabilities across Lightning Experience, Sales Cloud, Service Cloud, and other Salesforce products. By publishing your application through AppLink, you’re extending the Salesforce platform with custom business logic that users can seamlessly access from their familiar Salesforce interface.
This pattern uses User Mode authentication, which provides the most secure integration by inheriting the exact permissions of the Salesforce user who triggers the operation. Additionally, User Mode supports elevated permissions (known as “user mode plus” in the main documentation) that are granted exclusively during code execution through Permission Sets. This allows your Heroku application to perform operations that the triggering user cannot normally perform, with admin-approved elevated permissions visible through Permission Sets in the org.
For a Heroku application designed to be invoked by Salesforce, you need:
- AppLink Add-on:
heroku addons:create heroku-applink - AppLink Buildpack:
heroku buildpacks:add --index=1 heroku/heroku-applink-service-mesh - AppLink CLI Plugin: Install the Heroku CLI plugin for deployment commands
- OpenAPI YAML file: Describing your HTTP endpoints for Salesforce discovery
- Org Login: An org login for a user with the ‘Manage Heroku Apps’ permission
- AppLink SDK (optional): For your chosen language to simplify integration
- Procfile Configuration: To inject the service mesh for authentication
The deployment process requires an api-docs.yaml file that describes your HTTP endpoints using the OpenAPI specification format. This file serves as the bridge between your Heroku application and Salesforce, enabling automatic generation of Apex classes, Flow actions, and Agentforce integrations. The YAML file contains both standard API documentation and Salesforce-specific metadata that controls authentication and permissions – we’ll explore its structure and contents in detail later in this blog.
The following command sequence installs the AppLink add-on, configures a buildpack that injects a request interceptor known as the service mesh (which handles authentication and blocks external access), and establishes the secure connection between your Heroku application and Salesforce org. Note that Pattern 2 uses salesforce:connect to create connections (for app publishing) rather than salesforce:authorizations:add used in Pattern 1 (for data access). This deployment and connection process is adapted from our Pattern 2 sample:
# Create and configure Heroku app
heroku create
heroku addons:create heroku-applink
heroku buildpacks:add --index=1 heroku/heroku-applink-service-mesh
heroku buildpacks:add heroku/nodejs
heroku config:set HEROKU_APP_ID="$(heroku apps:info --json | jq -r '.app.id')"

# Deploy and connect to Salesforce
git push heroku main
heroku salesforce:connect my-org
heroku salesforce:publish api-docs.yaml --client-name GenerateQuote --connection-name my-org --authorization-connected-app-name GenerateQuoteConnectedApp --authorization-permission-set-name GenerateQuotePermissions
Your Procfile needs to route requests through the service mesh for authentication, and your application should use APP_PORT instead of the standard PORT environment variable (which is now used by the service mesh). For example, in Node.js:
// From config/index.js
port: process.env.APP_PORT || 8080,
web: APP_PORT=3000 heroku-applink-service-mesh npm start
Important security note: The service mesh will by default block all incoming requests to the application unless they are from a Salesforce org. The HEROKU_APP_ID config variable is currently required as part of the implementation – in future releases we will look to remove this requirement.
Once your application is deployed and published, you need to grant the appropriate permissions to users who will be invoking your Heroku application through Apex, Flow, or Agentforce:
# Grant permissions to users
sf org assign permset --name GenerateQuote -o my-org
sf org assign permset --name GenerateQuotePermissions -o my-org
The permission sets serve different purposes: GenerateQuote grants users access to the Heroku app (through the Flow, Apex or Agentforce interaction they are using), while GenerateQuotePermissions provides additional permissions the code might require to access objects and fields in the org that the user cannot normally access – this elevated permission model is discussed in the next section in more detail.
Applications use familiar Express-style middleware to parse incoming Salesforce requests and enable transactional operations. The SDK’s parseRequest method handles the complex process of extracting user context and authentication details from Salesforce requests – no need to manually parse headers or manage authentication tokens.
When using the AppLink SDK with your preferred Node.js web framework, middleware configuration follows standard patterns. The Pattern 2 sample uses Fastify (though Express.js, Koa, or other frameworks work equally well), where the SDK automatically parses incoming request headers and body, extracting user context and setting up the authenticated Salesforce client for your route handlers.
The middleware is implemented as a Fastify plugin that applies to all routes:
// From heroku-applink-pattern-org-action-nodejs/src/server/middleware/salesforce.js
const preHandler = async (request, reply) => {
  const sdk = salesforceSdk.init();
  try {
    // Parse incoming Salesforce request headers and body
    const parsedRequest = sdk.salesforce.parseRequest(
      request.headers,
      request.body,
      request.log
    );

    // Attach Salesforce client to request context
    request.salesforce = Object.assign(sdk, parsedRequest);
  } catch (error) {
    console.error('Failed to parse request:', error.message);
    throw new Error('Failed to initialize Salesforce client');
  }
};
This middleware plugin is registered in the main application file where the Fastify server is configured:
// From heroku-applink-pattern-org-action-nodejs/src/server/app.js
import { salesforcePlugin } from './middleware/salesforce.js';

// Register Salesforce plugin
await fastify.register(salesforcePlugin);
For developers not using the AppLink SDK, the key integration point is parsing the x-client-context header that contains base64-encoded JSON with authentication and user context. Here’s how you can implement this manually in Java:
// From heroku-applink-pattern-org-action-java/.../SalesforceClientContextFilter.java
private static final String X_CLIENT_CONTEXT_HEADER = "x-client-context";

// Decode the base64 header value and parse the JSON
String encodedClientContext = request.getHeader(X_CLIENT_CONTEXT_HEADER);
String decodedClientContext = new String(
  Base64.getDecoder().decode(encodedClientContext),
  StandardCharsets.UTF_8
);

ObjectMapper objectMapper = new ObjectMapper();
JsonNode clientContextNode = objectMapper.readTree(decodedClientContext);

// Extract authentication and context fields
String accessToken = clientContextNode.get("accessToken").asText();
String apiVersion = clientContextNode.get("apiVersion").asText();
String orgId = clientContextNode.get("orgId").asText();
String orgDomainUrl = clientContextNode.get("orgDomainUrl").asText();

JsonNode userContextNode = clientContextNode.get("userContext");
String userId = userContextNode.get("userId").asText();
String username = userContextNode.get("username").asText();
This approach bypasses the SDK entirely and directly constructs the Salesforce SOAP API endpoint ({orgDomainUrl}/services/Soap/u/{apiVersion}) using the authentication details from the header. The JSON structure in the x-client-context header contains:
{
  "accessToken": "00D...",
  "apiVersion": "62.0",
  "requestId": "request-123",
  "orgId": "00Dam0000000000",
  "orgDomainUrl": "https://yourorg.my.salesforce.com",
  "userContext": {
    "userId": "005am000001234",
    "username": "user@example.com"
  }
}
One of the key advantages of Pattern 2 applications is the ability to perform multiple DML operations atomically – similar to database transactions in Node.js ORMs like Sequelize or Prisma. The SDK’s Unit of Work pattern ensures all operations succeed or fail together, providing transactional integrity for complex business processes that involve creating or updating multiple related records:
// From heroku-applink-pattern-org-action-nodejs/src/server/services/pricingEngine.js
const { context } = client;
const org = context.org;

// Create Unit of Work for transactional operations
const unitOfWork = org.dataApi.newUnitOfWork();

// Register Quote creation
const quoteRef = unitOfWork.registerCreate({
  type: 'Quote',
  fields: {
    Name: 'New Quote',
    OpportunityId: request.opportunityId
  }
});

// Register related QuoteLineItems
queryResult.records.forEach(record => {
  const discountedPrice = (quantity * unitPrice) * (1 - effectiveDiscountRate);

  unitOfWork.registerCreate({
    type: 'QuoteLineItem',
    fields: {
      QuoteId: quoteRef.toApiString(), // Reference to Quote being created
      PricebookEntryId: record.fields.PricebookEntryId,
      Quantity: quantity,
      UnitPrice: discountedPrice / quantity
    }
  });
});

// Commit all operations in one transaction
const results = await org.dataApi.commitUnitOfWork(unitOfWork);
const quoteResult = results.get(quoteRef);
return { quoteId: quoteResult.id };
For comprehensive examples including Bulk API operations, event handling, and advanced patterns, explore the complete integration patterns samples which demonstrate real-world scenarios across Node.js, Java, and Python implementations.
In the second part of this blog, we’ll dive deeper into how to invoke this Heroku logic from Apex, Flow, and Agentforce, including the specific Salesforce security models in effect and practical implementation guidance for each integration point.
Pattern Comparison
Now that you’ve seen both primary patterns, here’s a comparison of their key differences:
| Aspect | Pattern 1: Salesforce API Access | Pattern 2: Extending Salesforce |
|---|---|---|
| Authentication | Run-as-user via salesforce:authorizations:add |
Invoking User via salesforce:connect |
| Buildpack | Not required – app accessible to external users | Required – blocks external access, Salesforce-only |
| Port Configuration | Standard PORT usage | APP_PORT configuration needed |
| Org Support | Multiple org connections supported | Single org connection with permission-based access |
| Service Discovery | Not required | Service publishing required (salesforce:publish) |
| Permission Model | Run-as-user permissions across orgs | User and user mode plus via Permission Sets |
| Use Case | Web apps accessing Salesforce data | Salesforce invoking external processing |
For detailed guidance on all integration patterns and when to use each one, note that we have a Getting Started Guide that goes through this in more detail, as well as being covered in context in each of the README files for our accompanying samples.
Additional integration patterns and features
While Patterns 1 and 2 cover the foundational approaches, AppLink also supports two additional patterns that extend these core concepts:
Pattern 3: Scaling batch jobs
This pattern builds on Pattern 2’s extension approach by delegating large-scale data processing with significant compute requirements to Heroku Worker processes. This pattern is ideal when you need to process large datasets that exceed Salesforce batch job limitations, providing parallel processing capabilities and sophisticated error handling. See the complete Pattern 3 implementation for detailed guidance on batch processing architectures.
Pattern 4: Real-time eventing
This pattern extends Pattern 1’s API access approach by using Run-as-User authentication to establish event listening for Platform Events and Change Data Capture from Salesforce. The work is performed by the Run-as-User, enabling real-time responses to data changes and event-driven automation with custom notifications sent to desktop or mobile devices. Explore the Pattern 4 implementation for event-driven integration examples.
To summarize, Pattern 3 builds on Pattern 2’s extension approach (Invoking User), while Pattern 4 builds on Pattern 1’s API access approach (Run-as-User), focusing on different scenarios and authentication models. Complete sample implementations for all four patterns are available in the AppLink integration patterns repository.
Data Cloud integration
AppLink provides comprehensive Data Cloud integration capabilities that enable bi-recreational data flow between your Heroku applications and Salesforce Data Cloud. Your applications can execute SQL queries against Data Cloud using the dataCloudApi.query() method to access unified customer profiles, journey analytics, and real-time insights.
Additionally, you can create Data Cloud Actions that allow Data Cloud to invoke your Heroku applications through Data Action Targets. The SDK’s parseDataActionEvent() function handles incoming Data Cloud events, providing structured access to event metadata, current and previous values, and custom business logic integration points. This creates powerful scenarios like real-time personalization engines, automated customer journey optimization, and intelligent data enrichment workflows that combine Data Cloud’s analytics capabilities with Heroku’s computational flexibility.
What’s next?
In our next blog in the AppLink Fundamentals series, we’ll delve into advanced integrations with Flow, Apex, and Agentforce, demonstrating how AppLink amplifies Salesforce’s existing features. Following that, we’ll cover the practical aspects of the development flow, including local testing, managing OpenAPI changes, and the key considerations when choosing between Apex and other programming languages for your Salesforce extensions.
Read More of the AppLink Fundamentals series
- AppLink Fundamentals I: AppLink Integration Patterns – Connecting Salesforce to Heroku Applications
- AppLink Fundamentals II: Advanced AppLink Integrations – Automation & AI
- AppLink Fundamentals III: Building with AppLink – Development Flow and Language Choices
The post AppLink Fundamentals I: AppLink Integration Patterns – Connecting Salesforce to Heroku Applications appeared first on Heroku.
]]>New to Heroku? Watch this brief introduction video to get familiar with the platform before diving into AppLink.
With the general availability of Heroku AppLink directly on the Salesforce Setup…
The post Heroku AppLink: Extend Salesforce with Any Programming Language appeared first on Heroku.
]]>
New to Heroku? Watch this brief introduction video to get familiar with the platform before diving into AppLink.
With the general availability of Heroku AppLink directly on the Salesforce Setup menu, Heroku is significantly expanding the programming language options available to Salesforce developers. AppLink empowers you to securely deploy code written in virtually any language directly to the Salesforce platform, enabling enhanced growth and capabilities for existing workloads. Heroku applications can be seamlessly attached to multiple Salesforce orgs, allowing your customizations and automations to leverage Heroku’s renowned scaling capabilities. This groundbreaking integration makes it possible to build nearly anything on the Salesforce platform without the need to store or move data off-platform for complex processing. With AppLink, you get the same trust commitment as every other Salesforce product, as AppLink handles all the security and integration for you!
Use AppLink with the language of your choice
If you’re a Salesforce architect or developer familiar with Node.js (the same runtime used by Lightning Web Components) or Python, this blog is for you. This initial release of AppLink provides SDK support for Node.js and Python, with a primary focus on Node.js examples and patterns. We’ve also included Java samples that demonstrate how to use AppLink in languages that don’t currently have a dedicated SDK, by working directly with AppLink’s APIs. Importantly, AppLink’s APIs are designed to work with virtually any programming language, giving you the freedom to use the tools and frameworks you’re already productive with.
In this series, we’ll embark on a journey to explore the key components of AppLink, discover how to extend Salesforce Flows, Apex, and Agentforce with external logic, and understand how AppLink helps build solutions with customer data security as a top priority, with user mode enabled by default. We’ll also delve into various usage patterns, the development flow, and crucial considerations for when to leverage AppLink versus traditional Apex development.
Exploring Heroku AppLink features
AppLink functions as a standard Heroku add-on. However, unlike add-ons from ecosystem partners, AppLink is owned and managed directly by Heroku engineers as an extension to the Heroku platform itself. As an add-on, you can expect a familiar UI, normal provisioning processes, and the ability to share the add-on across multiple Heroku applications and services. AppLink is available to all Salesforce orgs and can be easily found under the Setup menu. The add-on itself is free; you only pay for the Heroku compute and any desired data resources through normal Heroku billing. Click here to learn more about Heroku Add-ons.
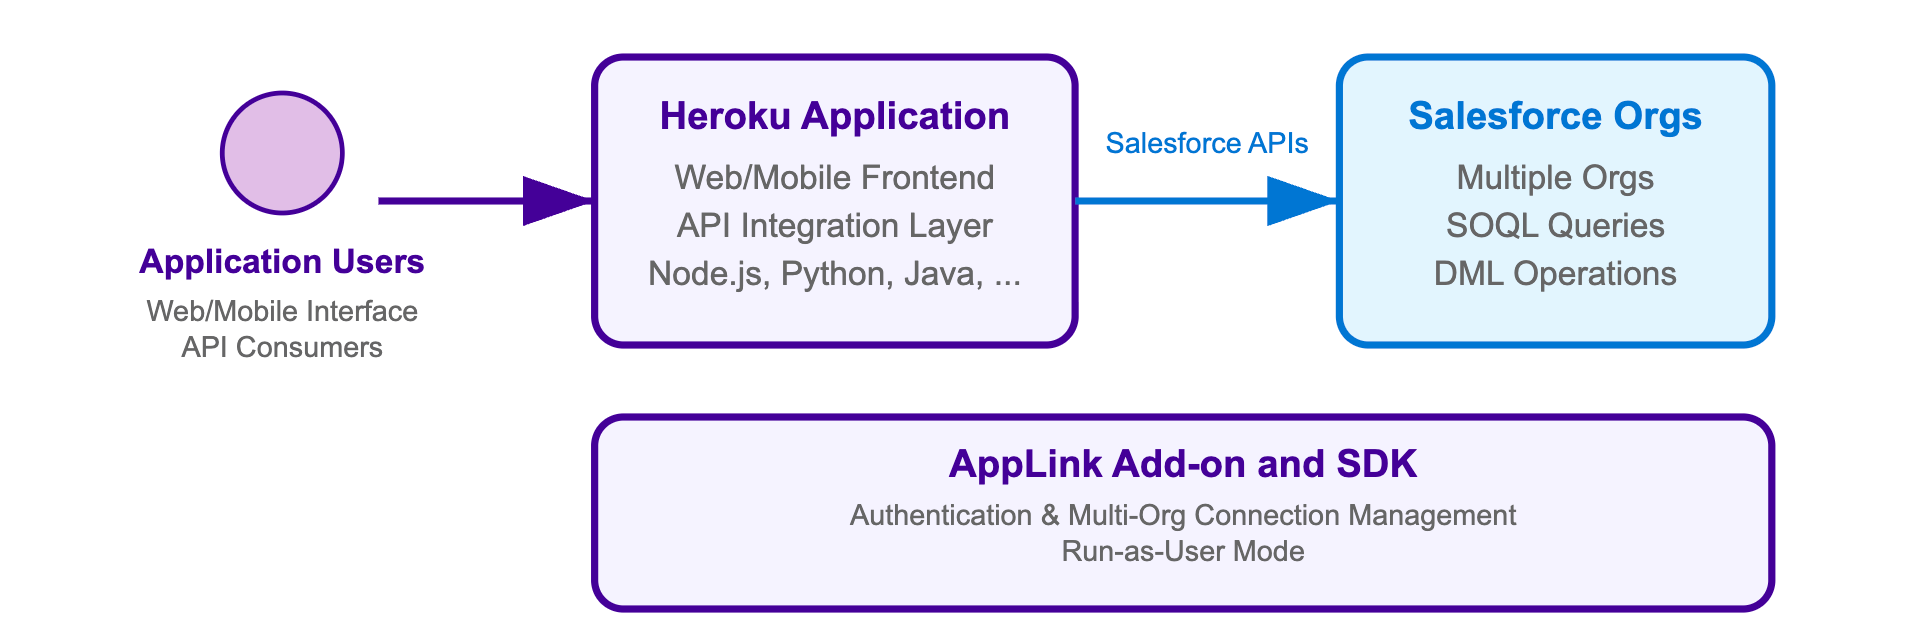
AppLink is comprised of several key components that work in concert to create a fully managed bridge between your Heroku application and other Salesforce products. Understanding this architecture is crucial for successful implementation, as each component plays a specific role in enabling secure, authenticated communication between your custom code and the Salesforce platform.
The diagram below illustrates the complete AppLink ecosystem, showcasing how requests flow between Salesforce orgs and your Heroku applications, the vital role of the AppLink add-on in managing connections and authentication, and how various AppLink components coordinate to provide seamless integration. Whether you’re building applications that call Salesforce APIs or services that extend Salesforce functionality, this architecture forms the foundation for all integration scenarios.
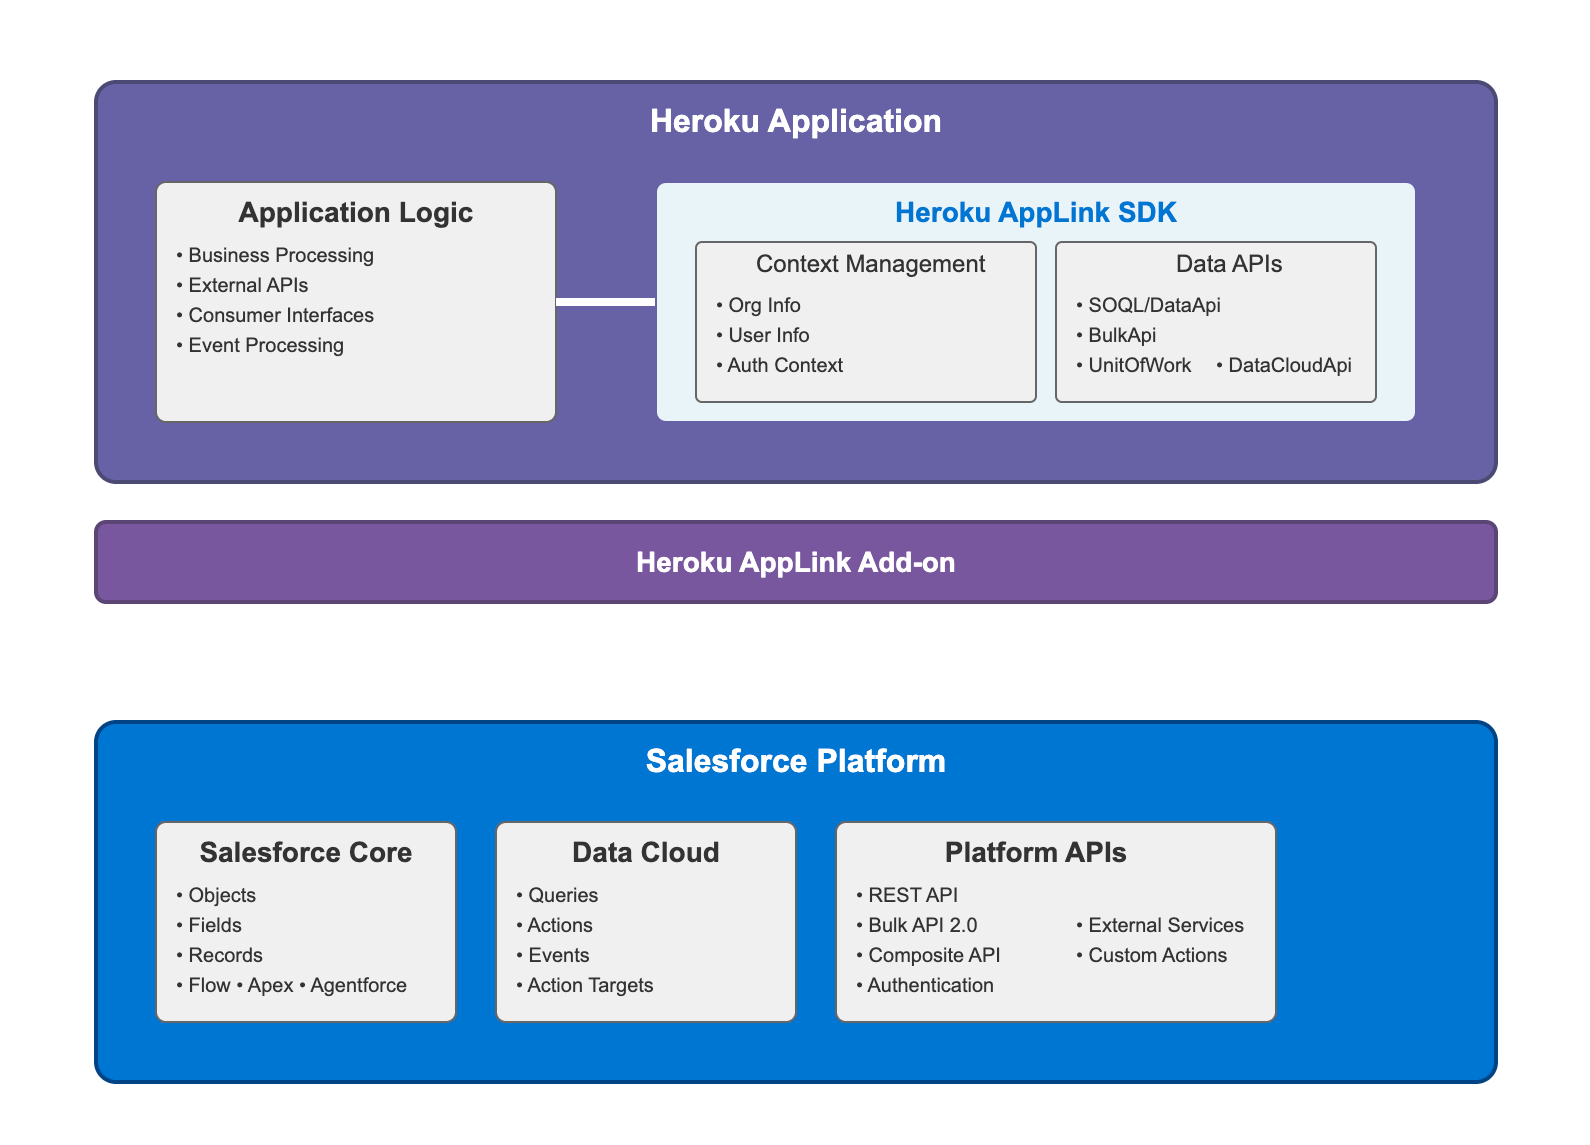
Each component within AppLink serves a distinct purpose in creating the integrated experience. The table below provides a detailed overview of the role and capabilities of each AppLink component, demonstrating how they work together to provide comprehensive Salesforce-Heroku connectivity.
| Component | Role |
|---|---|
| Add-on | Acts as the foundational connectivity layer (heroku addons:create heroku-applink), providing automatic provisioning between Heroku and Salesforce, security token management, and service discovery for making Heroku apps discoverable within Salesforce and the API Catalog. Works in conjunction with the Buildpack when building AppLink solutions that extend Salesforce as described later in this blog. Exposes environment variables: HEROKU_APPLINK_API_URL and HEROKU_APPLINK_TOKEN for authentication and API access. |
| Buildpack | Functions as the security and authentication layer (heroku buildpacks:add --index=1 heroku/heroku-applink-service-mesh) that injects the service mesh into Heroku applications designed to be invoked by Salesforce. The service mesh acts as a request interceptor that handles authentication, blocks external access to ensure only Salesforce can invoke the application, and routes authenticated requests to your application code. Required for applications that extend Salesforce functionality through Flow, Apex, or Agentforce integration patterns. |
| Dashboard | Functions as the centralized monitoring interface accessible via heroku addons:open heroku-applink with three main tabs: Connections (lists Salesforce and Data Cloud org connections with status), Authorizations (shows run-as-user authorizations with developer names and connected orgs), and Publications (displays published apps across orgs with connection status). Provides comprehensive visibility into your Heroku-Salesforce integrations. |
| CLI | Serves as the command-line interface for deployment commands, connecting and publishing apps to Salesforce orgs, local development tools, permission management, and multi-environment support. The salesforce:authorizations commands enable existing Heroku applications to access Salesforce data (run-as-user mode), while salesforce:connect commands are used for User Mode. Publishing commands allow Heroku code to be invoked via Flow, Apex, or Agentforce. |
| API | Serves as the programmatic gateway providing unified access to Salesforce and Data Cloud data with automatic authentication, authorization, and connection pooling. Used by the CLI and SDK, and can be used directly by developers’ own code for custom integrations. |
| SDK | Acts as the developer toolkit that simplifies AppLink integration by providing request processing capabilities, automatic authentication handling, and unified data access methods. The SDK parses incoming requests from Salesforce (Flows, Apex, Agentforce), including decoding the x-client-context HTTP header which contains base64 encoded JSON with user context and authentication details, routes them to appropriate business logic, and transforms responses back to Salesforce-compatible formats. Key features include connection management, transaction support, and structured error handling. Currently available for Node.js and Python, while other languages are fully supported but must use the AppLink API directly instead of the SDK. |
| OpenAPI Integration | Functions as the service discovery and registration mechanism using OpenAPI Specification files (YAML or JSON format) for endpoint discovery, automatic service registration in Salesforce Setup menu and API Catalog, and External Service generation for admins. Uses x-sfdc extensions to map Permission Set names for elevated permissions beyond the user’s access level, and to automatically create Agentforce Custom Actions. Currently supports OpenAPI 3.0 at time of writing – check Salesforce External Services documentation for the latest supported version. These features will be discussed further later. |
| Salesforce API Integration | Provides the data access layer where the AppLink SDK includes helpers for SOQL Query Engine, DML Operations, Data Cloud Integration, and Bulk API Support, but developers can still directly access these APIs or use existing Salesforce API libraries they prefer. |
Together, these components offer a comprehensive and cohesive ecosystem that simplifies the complex task of integrating Heroku applications with Salesforce. By providing dedicated tools for everything from secure connectivity and automatic authentication to streamlined deployment, monitoring, and service discovery, AppLink reduces development overhead and accelerates time to market. This holistic approach ensures that developers can focus on building powerful business logic, knowing that the underlying infrastructure for secure and scalable Salesforce extension is fully managed and integrated.
Stay tuned: from foundation to practical application
This blog post has provided a foundational understanding of AppLink – what it is, why it’s a critical new tool for Salesforce developers, and its core components.
In our three part series, AppLink Fundamentals, we’ll dive into the practical application of AppLink by exploring its key integration patterns, showing you how to connect your Heroku applications to Salesforce for various use cases. Subsequent posts in this series will delve into advanced integrations with Data Cloud, Flow, Apex, and Agentforce, followed by a look at the development workflow, language choices, and best practices for building robust solutions with AppLink. Stay tuned to unlock the full potential of extending Salesforce with the power of Heroku.
Additional AppLink resources
- Getting Started with Heroku AppLink and Salesforce
- Getting Started with Heroku AppLink and Data Cloud
- Getting Started with Heroku AppLink and Agentforce
Read the AppLink Fundamentals series
- AppLink Fundamentals I: AppLink Integration Patterns – Connecting Salesforce to Heroku Applications
- AppLink Fundamentals II: Advanced AppLink Integrations – Automation & AI
- AppLink Fundamentals III: Building with AppLink – Development Flow and Language Choices
The post Heroku AppLink: Extend Salesforce with Any Programming Language appeared first on Heroku.
]]>The post OpenTelemetry, Kubernetes, and Fir: Putting it All Together appeared first on Heroku.
]]>Fir is Heroku’s next generation cloud platform, designed to offer more modern cloud-native capabilities with flexibility and scalability. It’s built on proven, open-source technologies. Traditional Heroku relied on proprietary technologies, which was appropriate at the time because high-quality open-source alternatives didn’t exist. But now, technologies like Kubernetes and OpenTelemetry are considered best-in-class solutions that are widely deployed and supported by a vast ecosystem.
Kubernetes is at the core of Fir’s infrastructure, providing automated scaling, self-healing, and efficient resource management. And while Kubernetes powers Fir, end users are not exposed to it directly—which is a good thing, since Kubernetes is very complex. Under the hood, Fir takes advantage of the powerful capabilities of Kubernetes, but it only exposes the user-friendly Heroku interface for user interaction.
OpenTelemetry offers standard-based visibility into how applications and services interact within Fir as well as integrate with external systems. By leveraging OpenTelemetry with Fir, developers can gain deep insights into application performance. They can track distributed requests and even route telemetry data to external monitoring platforms if they wish.
Let’s look more deeply into OpenTelemetry and what it brings to the table.
Understanding OpenTelemetry
As an observability framework, OpenTelemetry is designed to standardize the collecting, processing, and exporting of telemetry data from applications. It aims to provide a unified approach to capturing this data across distributed systems so that developers can monitor performance and diagnose issues effectively.
One of the primary goals of OpenTelemetry is to eliminate vendor lock-in. You can send telemetry data to various backends, such as Prometheus, Jaeger, Grafana, Datadog, and—of course—Heroku, without modifying application code.
OpenTelemetry consists of language-specific APIs and SDKs coupled with the OpenTelemetry Collector, all working together to provide a unified observability framework. The APIs define a standard way to generate telemetry data, while the SDKs offer language-specific implementations for instrumenting applications. The OpenTelemetry Collector acts as a processing pipeline. It supports the ingestion, filtering, and export of telemetry data using the OpenTelemetry Protocol (OTLP), which standardizes the transmission of data to various observability backends.
OpenTelemetry supports three primary telemetry data types, each serving a critical role in observability:
- Logs capture discrete events, such as errors or system messages, providing a detailed record of application behavior.
- Metrics track numerical data over time, offering quantifiable insights into system performance.
- Traces track the flow of requests across distributed services, enabling developers to diagnose latency issues and optimize performance.
Fir: Heroku’s next generation platform
By integrating Kubernetes into its core, Fir empowers developers to deploy and manage applications with greater control and resilience. Leveraging Kubernetes ensures that applications can handle varying workloads seamlessly, adapting to changing demands without manual intervention. Because it runs specifically on top of AWS EKS, Fir can take advantage of more diverse and powerful instance types, such as the AWS Graviton processor.
Fir utilizes Open Container Initiative (OCI) images and Cloud Native Buildpacks to package and deploy services and applications. This is a major improvement, because it means developers in the Heroku world can tap into their standards-based knowledge and tooling. In addition, Fir integrates seamlessly with OpenTelemetry, providing a built-in collector and easy ways to configure drains for transmitting telemetry data to additional destinations if needed.
Basing Fir on open-source standards and technologies is a major advantage for several reasons:
- If a company already uses these technologies and has a centralized observability platform, then they can gradually migrate some systems to Fir, while retaining a single pane of glass for all systems.
- It avoids lock-in because companies can easily migrate to other Kubernetes providers and still use their existing OpenTelmetry instrumentation and CNB pipelines.
- Companies have the option of maintaining a hybrid environment, in which some systems run on Heroku Fir while others run on other Kubernetes providers if they need more control.
The benefits of OpenTelemetry in Fir
Native integration with OpenTelemetry means Fir enables automatic telemetry collection without requiring extensive manual setup.
By tracing requests across distributed services (including on non-Heroku systems interacting with Fir), developers can easily pinpoint failures and optimize system performance. These capabilities enable teams to proactively address issues before they impact end users, improving application reliability.
OpenTelemetry’s vendor-agnostic approach gives organizations the flexibility to choose their preferred monitoring and analytics tools. Since OpenTelemetry is an open-source project, it benefits from continuous improvements and broad community support.
Because of its lightweight and distributed architecture, OpenTelemetry is well-suited for large-scale, cloud-native environments like Fir’s Kubernetes-based infrastructure. It efficiently handles high-volume telemetry data, ensuring that performance monitoring scales alongside the application.
How does OpenTelemetry work with Fir?
Fir provides out-of-the-gate OpenTelemetry logs and metrics for your dynos and the applications running on them. These are displayed in your app’s dashboard.
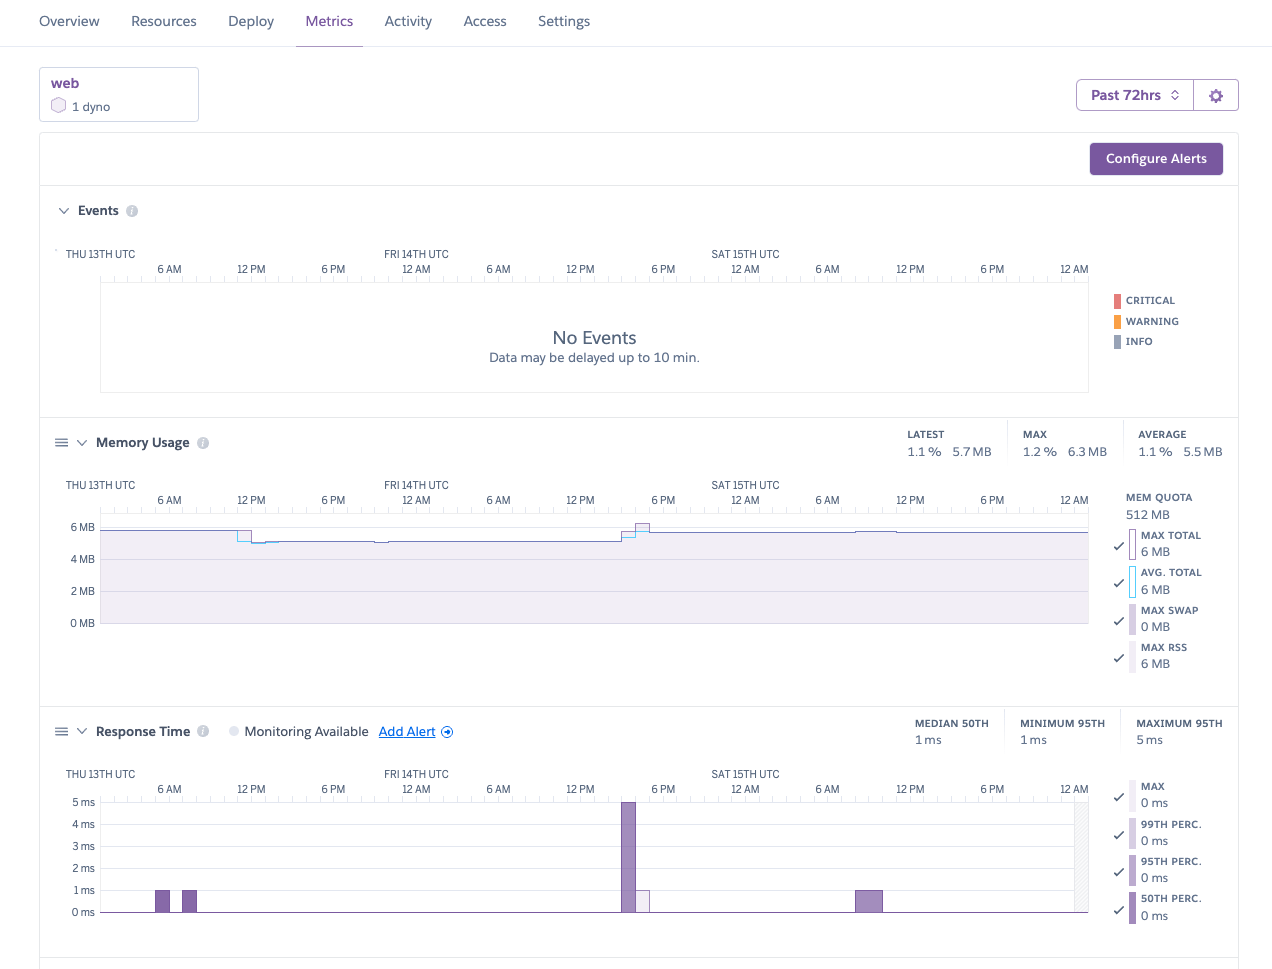
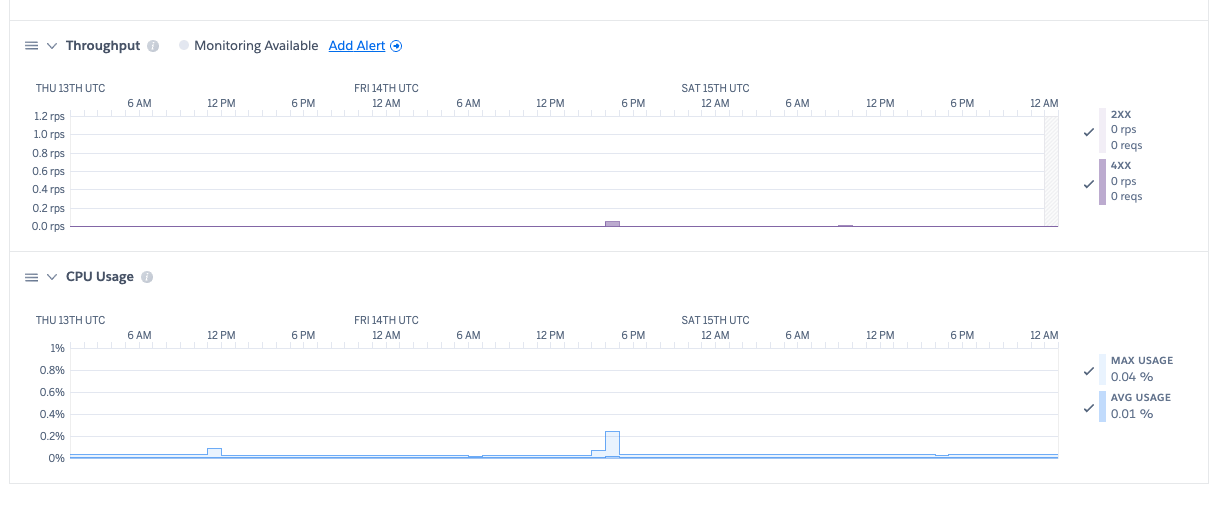
You can take this even further. If you configure an OpenTelemetry SDK and instrument your application, then you can generate custom metrics and distributed traces. You can also configure drains to send your telemetry data to third-party observability platforms.
How do all the pieces fit together? Consider the following diagram:
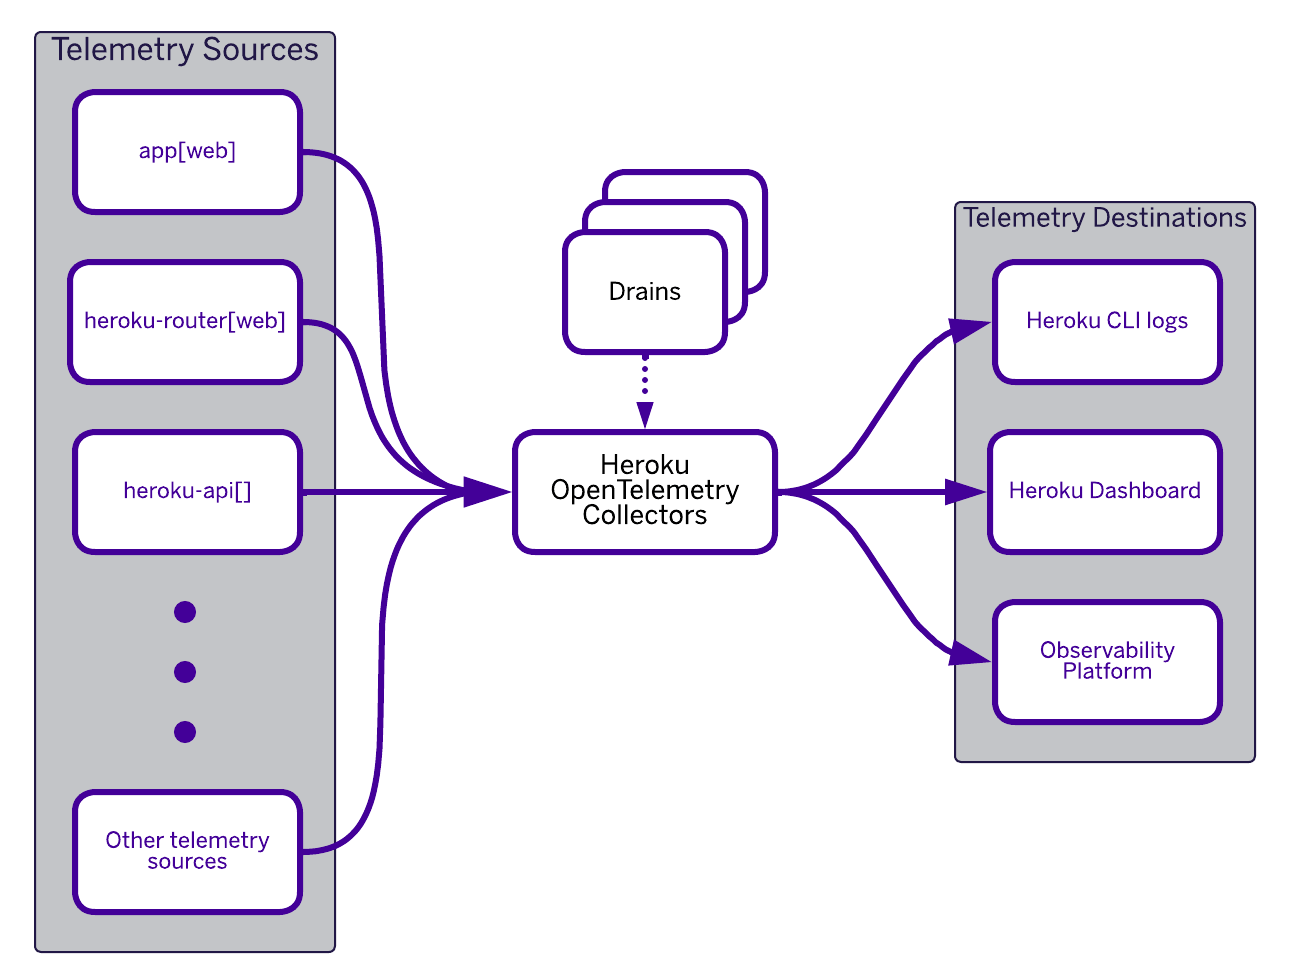
The built-in Heroku OpenTelemetry Collector does all the heavy lifting for you.
- Fir uses the Heroku OpenTelemetry Collector to collect data from various telemetry sources such as your web application, the Heroku router, and the Heroku API.
- The collector is configured with various telemetry destinations (drains).
- The collector sends the relevant telemetry data to destinations like Heroku CLI logs, the Heroku dashboard, or other observability platforms.
OpenTelemetry drains can be defined at the space level—meaning they apply to all applications in the space—or at an individual application level. This is done using the Heroku CLI:
$ heroku telemetry -h
list telemetry drains

USAGE
  $ heroku telemetry [-s ] [--app ]

FLAGS
  -s, --space=  filter by space name
  --app=        filter by app name

DESCRIPTION
  list telemetry drains

EXAMPLES
  $ heroku telemetry

COMMANDS
  telemetry:add     Add and configure a new telemetry drain. Defaults to collecting all telemetry unless otherwise specified.
  telemetry:info    show a telemetry drain's info
  telemetry:remove  remove a telemetry drain
  telemetry:update  updates a telemetry drain with provided attributes (attributes not provided remain unchanged)
The key to the interoperability of Heroku’s telemetry data is the Open Telemetry Protocol (OTLP). This protocol has two transports: gRPC and HTTP. Heroku supports both. While the gRPC transport is more efficient and has more features (HTTP/2 streaming, bi-directional streaming, Protocol Buffers payload), it might not be able to traverse some firewalls or be routed properly. In these cases, the HTTP transport, based on simple HTTP 1.1, may be the best option. It may depend also on the support in the SDK of your programming language.
Conclusion
As cloud-native applications become more complex and distributed, observability is no longer optional. It is a fundamental requirement for ensuring reliability, performance, and rapid debugging. OpenTelemetry is quickly becoming the industry standard for telemetry collection, and its seamless integration into Fir ensures that applications running on the platform can be monitored with minimal effort.
Fir’s underlying Kubernetes foundation allows organizations to benefit from industry-leading infrastructure without needing to manage the complexity of Kubernetes directly. This combination provides a powerful and future-proof platform that simplifies operations while ensuring full visibility into application behavior.
Fir’s reliance on open standards and technologies is a win-win because it reduces the risk of vendor lock-in for users and also benefits from the development effort of the open-source community to enhance and improve those technologies.
Additional resources
- Planting New Platform Roots in Cloud Native with Fir
- Heroku Documentation
- Cloud Native Buildpacks: Go tutorial from Heroku
- OTLP Specification 1.5.0 | OpenTelemetry
The post OpenTelemetry, Kubernetes, and Fir: Putting it All Together appeared first on Heroku.
]]>For years, Heroku customers have relied on our managed in-memory data store services for caching, session management, real-time leaderboards, queueing, and so much more. Valkey is a drop-in, open-source fork of Redis OSS at v7.2, maintained by the Linux Foundation, and is backwards compatible with Redis OSS protocols…
The post Heroku Key-Value Store Now Supports Valkey 8.1 with JSON and Bloom Modules appeared first on Heroku.
]]>For years, Heroku customers have relied on our managed in-memory data store services for caching, session management, real-time leaderboards, queueing, and so much more. Valkey is a drop-in, open-source fork of Redis OSS at v7.2, maintained by the Linux Foundation, and is backwards compatible with Redis OSS protocols and clients. With Valkey v8.1, we’re continuing our commitment to providing you with a robust, scalable, and developer-friendly in-memory datastore. We are delivering this enhancement to empower you to build faster, smarter, and more efficient applications on Heroku.
What’s New in Valkey v8.1
Valkey v8.1 itself comes packed with core improvements designed to make your applications perform:
- Enhanced Performance: Experience lower latencies and higher throughput. Valkey v8.1 features a new, more memory-efficient hash table implementation and optimizations in I/O threading. This means your apps can handle more requests, faster. Active memory defragmentation also sees a significant reduction in request latency.
- Better Memory Efficiency: Squeeze more out of your instances. The new hash table design reduces memory usage per key, allowing you to store more data cost-effectively.
These improvements mean your existing Heroku Key-Value Store use cases will run faster and more efficiently, mostly without needing any changes on your end.
How to upgrade to Valkey v8.1
You can upgrade your Heroku Key-Value Store instance to the latest version with:
heroku redis:upgrade –version 8.1 –app app-nameIf you’re on mini, above command will upgrade your instance immediately. If you’re on premium or larger plans, the above command will prepare the maintenance and you can upgrade by running maintenance.
Valkey 8 Benchmark Highlights (vs Valkey 7.2)
To give you a clearer picture of the performance uplift, our internal benchmarks (combination of SETS and GETS operations) comparing Valkey 8.0 (a precursor to 8.1, sharing many core enhancements) with Valkey 7.2 on various Heroku Key-Value Store premium plans show significant improvements. Here’s a snapshot of the average gains observed:
| Heroku Plan (Cores) | Valkey 8.0 vs 7.2: Ops/sec Increase | Valkey 8.0 vs 7.2: Avg. Latency Reduction |
|---|---|---|
| premium-7 (2 cores) | ~6.5% | ~6.1% |
| premium-9 (4 cores) | ~37.4% | ~27.3% |
| premium-10 (8 cores) | ~44.7% | ~25.3% |
| premium-12 (16 cores) | ~164.6% | ~63.0% |
| premium-14 (32 cores) | ~201.8% | ~62.5% |
These benchmarks demonstrate that as you scale to plans with more CPU cores, the performance advantages of Valkey 8.x become even more pronounced, allowing your applications to handle substantially more operations per second with lower latency. While specific gains can vary by workload, the trend is clear: Valkey 8.1 is engineered for speed and efficiency. We offer a variety of Heroku Key-Value Store options to tailor to your needs.
Valkey Bloom & ValkeyJSON: Powerful New Modules for Heroku Key-Value Store
The real headline-grabbers with this release are the new, highly anticipated modules now available: Valkey Bloom and ValkeyJSON. These modules (similar to extensions on Heroku Postgres) unlock entirely new ways to leverage the power and simplicity of Heroku Key-Value Store within your Heroku applications. Let’s go over each one in more detail!
Valkey Bloom: Probabilistic Data Structures for Efficiency
Valkey Bloom introduces Bloom filters, a probabilistic data structure that excels at quickly and memory-efficiently determining if an element is probably in a set, or definitely not in a set.
- Benefit: Bloom filters can dramatically reduce the load on your primary databases and improve application efficiency by avoiding unnecessary, expensive lookups for items that don’t exist. They achieve this with remarkable memory savings – potentially over 90% compared to traditional methods for some applications.
- Use Cases:
- Cache “Probably Not Found” Queries: Before hitting your main database for an item, quickly check a Bloom filter. If it says the item is definitely not there, you save a costly database query. This is fantastic for recommendation engines (filtering out already-seen items), unique username checks, or fraud detection systems (checking against known fraudulent IPs or transaction patterns).
- Content Filtering: Efficiently check against large lists of malicious URLs or profanity.
- Ad Deduplication: Ensure users aren’t shown the same advertisement repeatedly.
While Bloom filters have a chance of a “false positive” (saying an item might be in the set when it isn’t), they guarantee no “false negatives” (if it says an item isn’t there, it’s truly not there). For many use cases, this trade-off is incredibly valuable for the performance and memory gains.
ValkeyJSON: Native JSON Handling for Rich Data Structures
Many modern applications rely heavily on JSON. With ValkeyJSON, you can now work with JSON data more naturally and efficiently within a Heroku Key-Value Store instance.
- Benefit: ValkeyJSON provides native support for storing, retrieving, and manipulating JSON documents. This allows for atomic operations on specific parts of a JSON object without needing to fetch and parse the entire thing in your application, leading to better performance and simpler application code.
- Use Cases:
- Store Complex Objects: Easily store user profiles, product catalogs with nested attributes, configuration data, or any other complex objects as JSON documents.
- Atomic Updates: Modify specific fields within a JSON document directly in Valkey. For example, update a user’s last login time or add an item to an array within a product’s attributes without rewriting the whole object.
- Simplified Development: Reduce boilerplate code for serializing and deserializing JSON in your application.
If your application deals with structured but flexible data, ValkeyJSON can significantly streamline your data management and improve performance.
Getting Started with Valkey Modules on Heroku Key-Value Store
Once you upgrade to Valkey v8.1, these powerful modules are already enabled and commands can be used. For example, to add an item to bloom filter through the CLI:
BF.ADD name-of-filter item-to-insertWe encourage you to explore the official Valkey documentation for Valkey Bloom and Valkey JSON to dive deeper into their commands and capabilities.
Valkey v8.1 & Module Power: Your Faster, More Flexible Heroku Data Store
The addition of Valkey v8.1, along with the Valkey Bloom and ValkeyJSON modules to Heroku Key-Value Store offerings, represents a significant step forward in the capabilities available to you on the Heroku platform. We’re excited to see how you’ll leverage these new tools to build the next generation of innovative applications.
As always, we’re here to support you if you get stuck. Stay tuned for more detailed guides and examples on using these new features. For now, get ready to explore the enhanced power and flexibility of Heroku Key-Value Store! Happy coding!
The post Heroku Key-Value Store Now Supports Valkey 8.1 with JSON and Bloom Modules appeared first on Heroku.
]]>In a recent Salesforce study , 84% of developers with AI say it helps their teams complete their projects faster. AI-powered, natural language development tools make it possible for anyone to create software by typing instructions in English. This increase in new apps is only…
The post Introducing the Heroku AI Platform as a Service (AI PaaS) appeared first on Heroku.
]]>In a recent Salesforce study, 84% of developers with AI say it helps their teams complete their projects faster. AI-powered, natural language development tools make it possible for anyone to create software by typing instructions in English. This increase in new apps is only matched by the increasing complexity of new technology to choose from, integrate, and maintain as a stable and secure platform – stressing the existing delivery gaps and friction in software delivery.
Heroku was founded to make deploying and scaling Ruby on Rails apps in the cloud easy for developers. Over the last decade, we remained steadfast in this mission by expanding to support more languages, databases, and now to AI. The Heroku AI PaaS brings powerful AI primitives into our opinionated platform with a simplified developer experience and automated operations to accelerate delivery of AI-powered apps and agents.
The Heroku AI PaaS adds these new capabilities to our robust cloud-native platform foundation:
- Heroku AppLink: Enable Agentforce to more use cases with custom actions, channels, tools in any programming language and securely integrated with a single click through Salesforce Flows, Apex, and Data Cloud. Agentforce is the agentic layer of the Salesforce Platform for deploying autonomous AI agents across any business function. This capability brings the ecosystem of programming languages and custom code to augment and enhance Salesforce implementations. AppLink will GA in July.
- AI-Native Tools Integration: Leverage tools like Cursor, Windsurf, and Claude Code to vibe code new apps, modernize existing apps, and add capabilities to agents. Deploy and manage code running on Heroku directly from these new developer tools. This capability is available today.
- MCP Server Toolkit: Enable your agents with more capabilities by exposing relevant tools and data with MCP Servers, a critical element of agentic workflows. Build and run custom MCP Servers, the official Heroku MCP Server, or the Heroku Remote MCP Server on Heroku and Heroku MCP Toolkits provide a unified gateway to deploy and manage multiple MCP servers on the platform. With Agentforce 3.0‘s native MCP support, bringing your Heroku Remote MCP Server to Agentforce is now a reality. MCP Server support is available today.
- Heroku Managed Inference and Agents: Brings together a set of powerful primitives into the platform that make it simple for developers to build, scale, and operate AI-powered features and applications, without the heavy lifting of managing their own AI infrastructure. Access to leading models from Claude, Cohere, Stability, and more; plus primitives for building agents that can reason, act, and call tools, developers can focus on delivering differentiated experiences for their users, rather than wrangling inference infrastructure or orchestration logic. Heroku Managed Inference and Agents is available today.
Plus these new AI apps and agents will benefit from Heroku’s built-in automation, autoscaling, observability, and dashboards for all workloads running on the platform, giving you peace of mind at any scale and the metrics to monitor ongoing performance.
Complementing the platform innovations are new additions to our partner program to increase the technical expertise available to our customers around the world that help deliver their new app projects faster and more successfully. New certifications deepen expertise in solution design and implementation while a new Heroku Expert Area in Partner Navigator makes it easy for customers to find the right partner for their needs. Learn more about the partner updates here.
Our focus has always been on the apps, the code that drives your business. The software being built today is agentic and these new apps and agents require access to data, tools, and other agents to get the job done. The Heroku AI PaaS brings powerful AI technology to your fingertips with ease of use in mind to help you deliver value to your business faster and with less complexity. Start exploring the new Heroku today.
The post Introducing the Heroku AI Platform as a Service (AI PaaS) appeared first on Heroku.
]]>Salesforce is the world’s #1 AI CRM and provider of the Agentforce digital labor platform bringing together the C360 apps and data with Heroku. Every customer’s business is unique and that…
The post Elevate Your Salesforce Consulting Practice with Heroku appeared first on Heroku.
]]>Salesforce is the world’s #1 AI CRM and provider of the Agentforce digital labor platform bringing together the C360 apps and data with Heroku. Every customer’s business is unique and that often means designing solutions that bring together multiple Salesforce Clouds with 3rd party systems, and building customized experiences around them. Heroku’s robust AI PaaS provides the flexibility developers need and the reliability businesses need to enable these solutions with custom apps, services, and native integration to the Salesforce platform.
What’s new for partners:
- Heroku Expert Area: Available in July as part of the Salesforce Partner Navigator, the new Heroku Expert Area is designed to recognize and reward partners with proven Heroku expertise.
- Trailblazer Community Group: A private community group for Salesforce Consulting Partners on their Heroku journey to get the latest updates, network with peers, and connect with the Heroku team.
- Product Benefits: Partners are provided access to Heroku products to get hands on with the technology, enable their teams, and build demos.
“At Showoff we deeply value our partnership with Heroku—not just for the powerful technology platform it provides, but for the trust and collaboration that underpin our relationship. Our customers understand the value Heroku brings, and we see that every day in the agility and scalability it enables. What sets this partnership apart is the personal connection—the ability to pick up the phone, solve problems together, and collaborate on innovative solutions that truly drive business value”
– Barry Sheehan, CCO, Showoff
Certifications to build deep expertise
Expertise is built through knowledge and experience. We have two certifications to help partners continue their enablement journey on the path to becoming a Heroku Expert. Partners can achieve Heroku Specialist and Heroku Cloud Expert distinctions, with Heroku Implementation Expert distinction launching in 2026. Information on how to achieve Heroku distinctions is available in the Heroku Partner Readiness Guide and Heroku Technical Learning Journey.
- Heroku Developer Specialist [new]: This speciality area demonstrates an individual’s ability to build and manage Heroku applications effectively with an emphasis on practical skills related to deploying, maintaining, and scaling apps on the Heroku platform. A core component of this distinction is the Heroku Developer Accredited Professional certification.
- Heroku Architect Specialist [new]: This speciality area demonstrates an individual’s ability to design and implement applications on Heroku with a focus on architectural best practices. It involves understanding complex architectural considerations and leveraging Heroku features to build robust, scalable applications. A core component of this distinction is the Heroku Architect certification.
- Heroku Cloud Expert [new]: This distinction demonstrates an organization’s proven expertise in successfully delivering Heroku implementations that achieve high customer satisfaction scores.
Access to Heroku products
Starting next month, eligible Salesforce Consultants and Cloud Resellers will get access to Heroku products within a Heroku Demo Org with access to a Heroku Dev Starter Package which includes Dynos, Heroku Connect, and General Credits. This direct access to products provides a hands-on environment to build demos, design and prototype solutions, and complements enablement for certification.
“At Cognizant, we deeply value our partnership with Heroku. Its platform has empowered our teams to accelerate application development, streamline deployment, and deliver scalable, resilient solutions for our clients. We’ve seen measurable improvements in time-to-market and customer satisfaction. As we continue to innovate, we’re excited to build on this collaboration to drive even greater impact for the businesses we serve.”
– Sivakumar Meenakshi Sundaram, Global Delivery Head, Cognizant
Heroku Lighthouse Partners
These announcements mark an exciting new chapter for our partner community with new opportunities to grow their practice and expand their customer relationships. We are especially thankful for the lighthouse partners featured throughout this blog. These partners have worked diligently to become Heroku Experts; providing early participation and feedback in building a robust partner network. This group of standout consulting firms have demonstrated deep platform knowledge and delivered innovative solutions to clients using Heroku.
“Heroku lets our team focus on building great products, not managing infrastructure—empowering us to deliver faster, smarter solutions for our clients.”
– Scott Weisman, Co-Founder & CEO, LaunchPad Lab
By removing the friction of infrastructure management, Heroku has enabled partners like LaunchPad Lab to spend more time on what matters: creating high-impact digital experiences for their customers. This is the foundation of the Heroku Expert model, it’s a model designed to free teams to deliver client value at speed.
“Heroku by Salesforce gives our clients the flexibility to scale agentic AI across their end-to-end processes. From microservices to BYOM, Heroku enables us to deliver enterprise-grade solutions with speed and precision.”
– Sadagopan Singam, EVP (Global), Digital Business – Commercial Applications, HCLTech
For global consulting firms like HCLTech, Heroku provides the agility and control needed to meet the evolving demands of enterprise clients—especially as AI, data, and integration use cases grow more complex. Heroku’s ability to support both modern architectures and emerging AI use cases makes it a powerful enabler of digital transformation.
“Heroku gives Vanshiv’s engineering team the flexibility to build scalable microservices and extend Salesforce with modern architectures—helping us deliver robust, enterprise-grade solutions.”
– Gaurav Kheterpal, Founder & CEO, Vanshiv
As clients look to bring more custom logic and scalable services into their Salesforce environment, partners like Vanshiv are building microservices on Heroku to handle complexity and ensure reliability. This approach, that leans into custom solutions is essential for industries with high security and performance requirements.
“We’ve always embraced the pro-code ethos of Heroku as it allows us, a Salesforce Consulting Partner, to greatly extend the capabilities of Salesforce.”
– Jaime Solari, CEO & Founder, Oktana
The developer experience is a key differentiator for Heroku and a core reason why engineering-driven consultancies choose to invest in the platform. Oktana’s work demonstrates how Heroku enables partners to bridge the gap between low-code solutions and the full power of custom development.
Together, these Lighthouse Partners exemplify how Heroku is the best AI PaaS for innovation and growth. Their success stories are just the beginning, and we’re thrilled to continue building a thriving ecosystem of expert partners delivering next-generation solutions to Salesforce customers.
Get started today
Join the Heroku Partner Trailblazer Community to stay informed on the latest news, enablement, events, and network with other partners and Heroku.
“We are values aligned and value driven. Selling, delivering and growing with Heroku and Salesforce for the past 15 years has proven that success is a 3-way celebration with our joint customers.”
– Chris Peacock, CEO, Kilterset
The post Elevate Your Salesforce Consulting Practice with Heroku appeared first on Heroku.
]]>This new remote server is an expansion of our earlier stdio-based MCP server and comes with secure OAuth authentication. It's designed to provide a secure, scalable, and incredibly simple way for agents to interact with the Heroku platform and use tools to perform actions such as creating a Heroku app from your favorite agents such as Claude , Agentforce , or Cursor . With Agentforce 3.0 announcing native support for MCP, you can bring Heroku…
The post Heroku AI: Heroku Remote MCP Server appeared first on Heroku.
]]>https://mcp.heroku.com/mcp.
This new remote server is an expansion of our earlier stdio-based MCP server and comes with secure OAuth authentication. It’s designed to provide a secure, scalable, and incredibly simple way for agents to interact with the Heroku platform and use tools to perform actions such as creating a Heroku app from your favorite agents such as Claude, Agentforce, or Cursor. With Agentforce 3.0 announcing native support for MCP, you can bring Heroku Remote MCP Server to Agentforce.
Secure access and authentication with remote MCP servers
If you’re new to MCP, read this introduction to MCP to familiarize yourself. While our initial stdio MCP server supports local development capabilities by allowing agents to interact with the Heroku platform as a subprocess, it was limited to tethering your agent’s capabilities to a single machine. The new Heroku Remote MCP Server overcomes this with enhanced security for your AI workflows by centralizing access to the Heroku platform. The Heroku Remote MCP Server is easily accessible through clients that support remote servers and uses the industry-standard OAuth 2.0 protocol. When you connect a new client, you’ll be prompted to authenticate with your Heroku account, giving you clear and user-consented control over which tools can be accessed by your client.
How to connect your MCP client
As long as your agent supports remote MCP servers with OAuth, you can connect to Heroku in a few easy steps.
- Configure the server: Following your client’s documentation, add a new MCP server and use the URL:
https://mcp.heroku.com/mcp - Authenticate: Your client will redirect you to login with the Heroku account via OAuth.
- Connect: Once you authenticate, your client is securely connected and ready to go!
Claude Desktop (Free)
For the Claude desktop application, you can connect using a proxy command.
- Open the configuration file located at
~/Library/Application Support/Claude/claude_desktop_config.json. - Add the following entry to the
mcpServersobject and restart the Claude app:
{
    "mcpServers": {
      "Heroku": {
        "command": "npx",
        "args": ["-y", "mcp-remote", "https://mcp.heroku.com/mcp"]
      }
    }
}
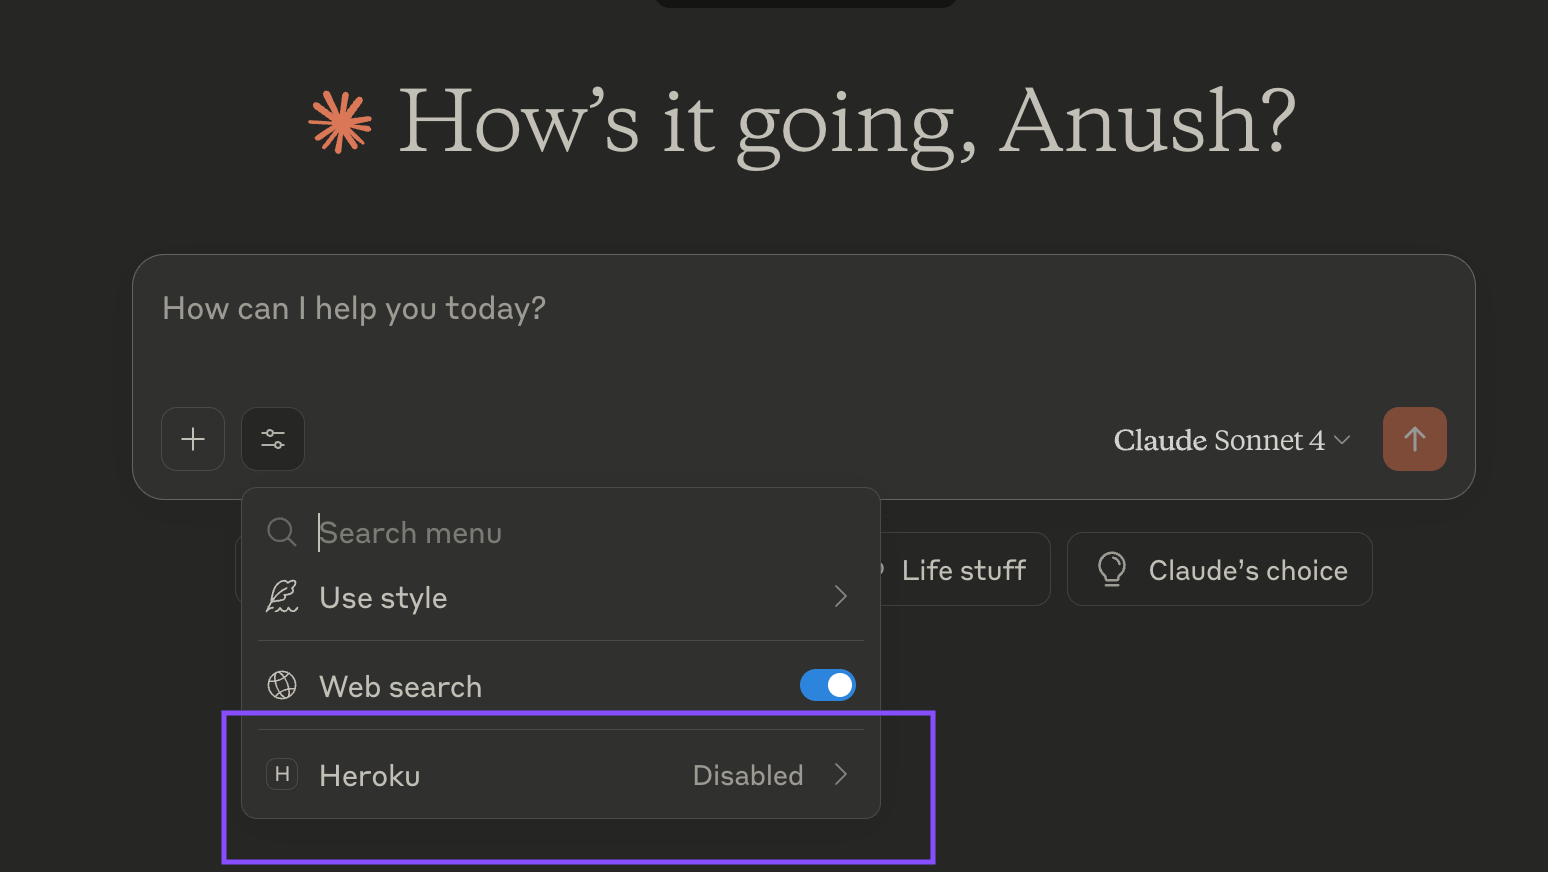
Cursor
For Cursor, you can connect on the Tools & Integrations section in the Cursor settings page.
- Click on
Add a Custom MCP. - Add the following entry to the
mcpServersobject. - Go back to Tools & Integrations, click on “Needs login” to the right of the Heroku MCP entry and authenticate via OAuth.
{
    "mcpServers": {
      "heroku": {
        "url": "https://mcp.heroku.com/mcp"
      }
    }
}
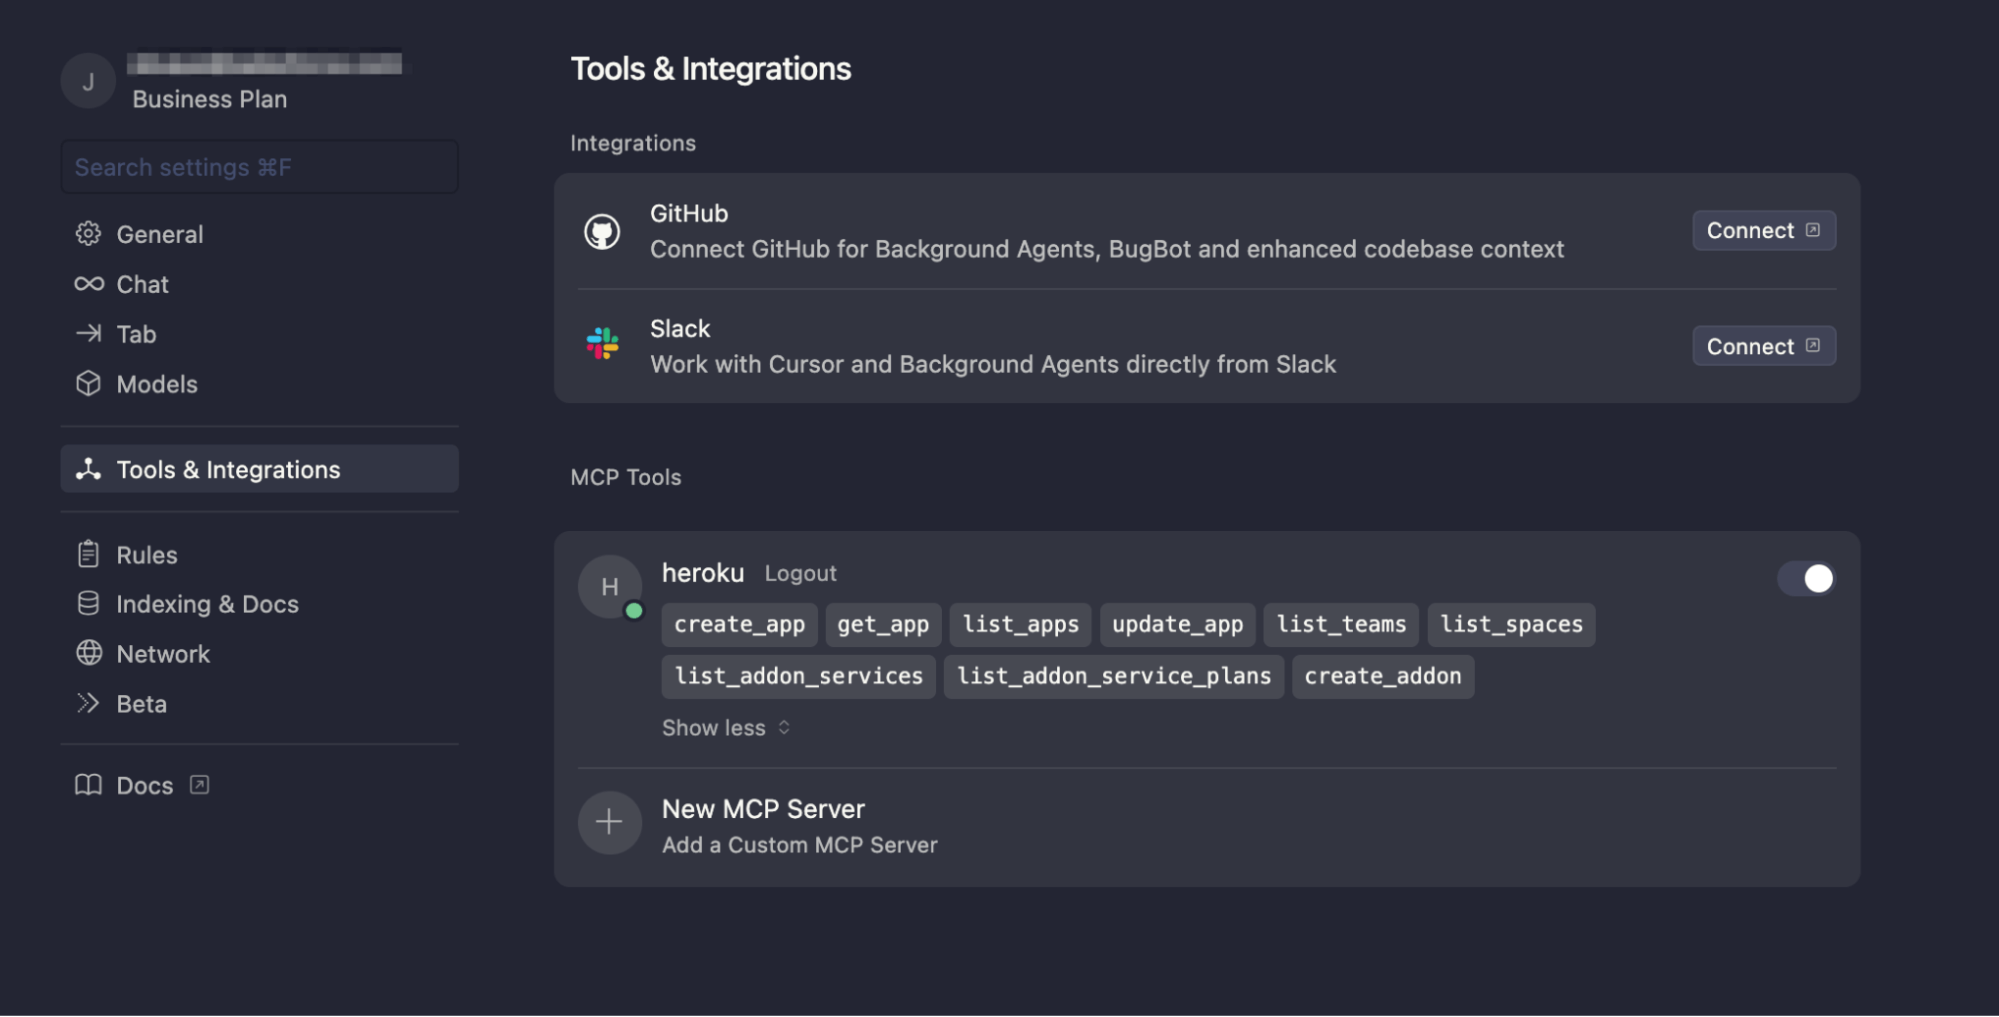
VSCode
For Visual Studio Code, open the command palette and select the following:

- Select
MCP: Add Server.... - HTTP (HTTP or Server Sent Events)
- Insert the url
https://mcp.heroku.com/mcp. - Insert
herokuas server id.
This will add the MCP configuration to the settings.json file, from here it will ask to start the OAuth authentication.

Extend your agents with the Heroku Remote MCP Server
The Heroku Remote MCP Server empowers your agent with a rich set of tools to understand and interact with the Heroku platform. Your agent can now perform a wide array of tasks on your behalf:
- Manage application lifecycle: list your apps, get info on a specific app, and even create and update applications directly via natural language.
- Info: Get a list of the teams you belong to, and view your Private Spaces.
- Add-on marketplace: List available Heroku Add-ons and check their various plans.
This is just the initial set of tools that we have enabled. We are continuously working to enable additional tools to help you with an increasing variety of workflows.
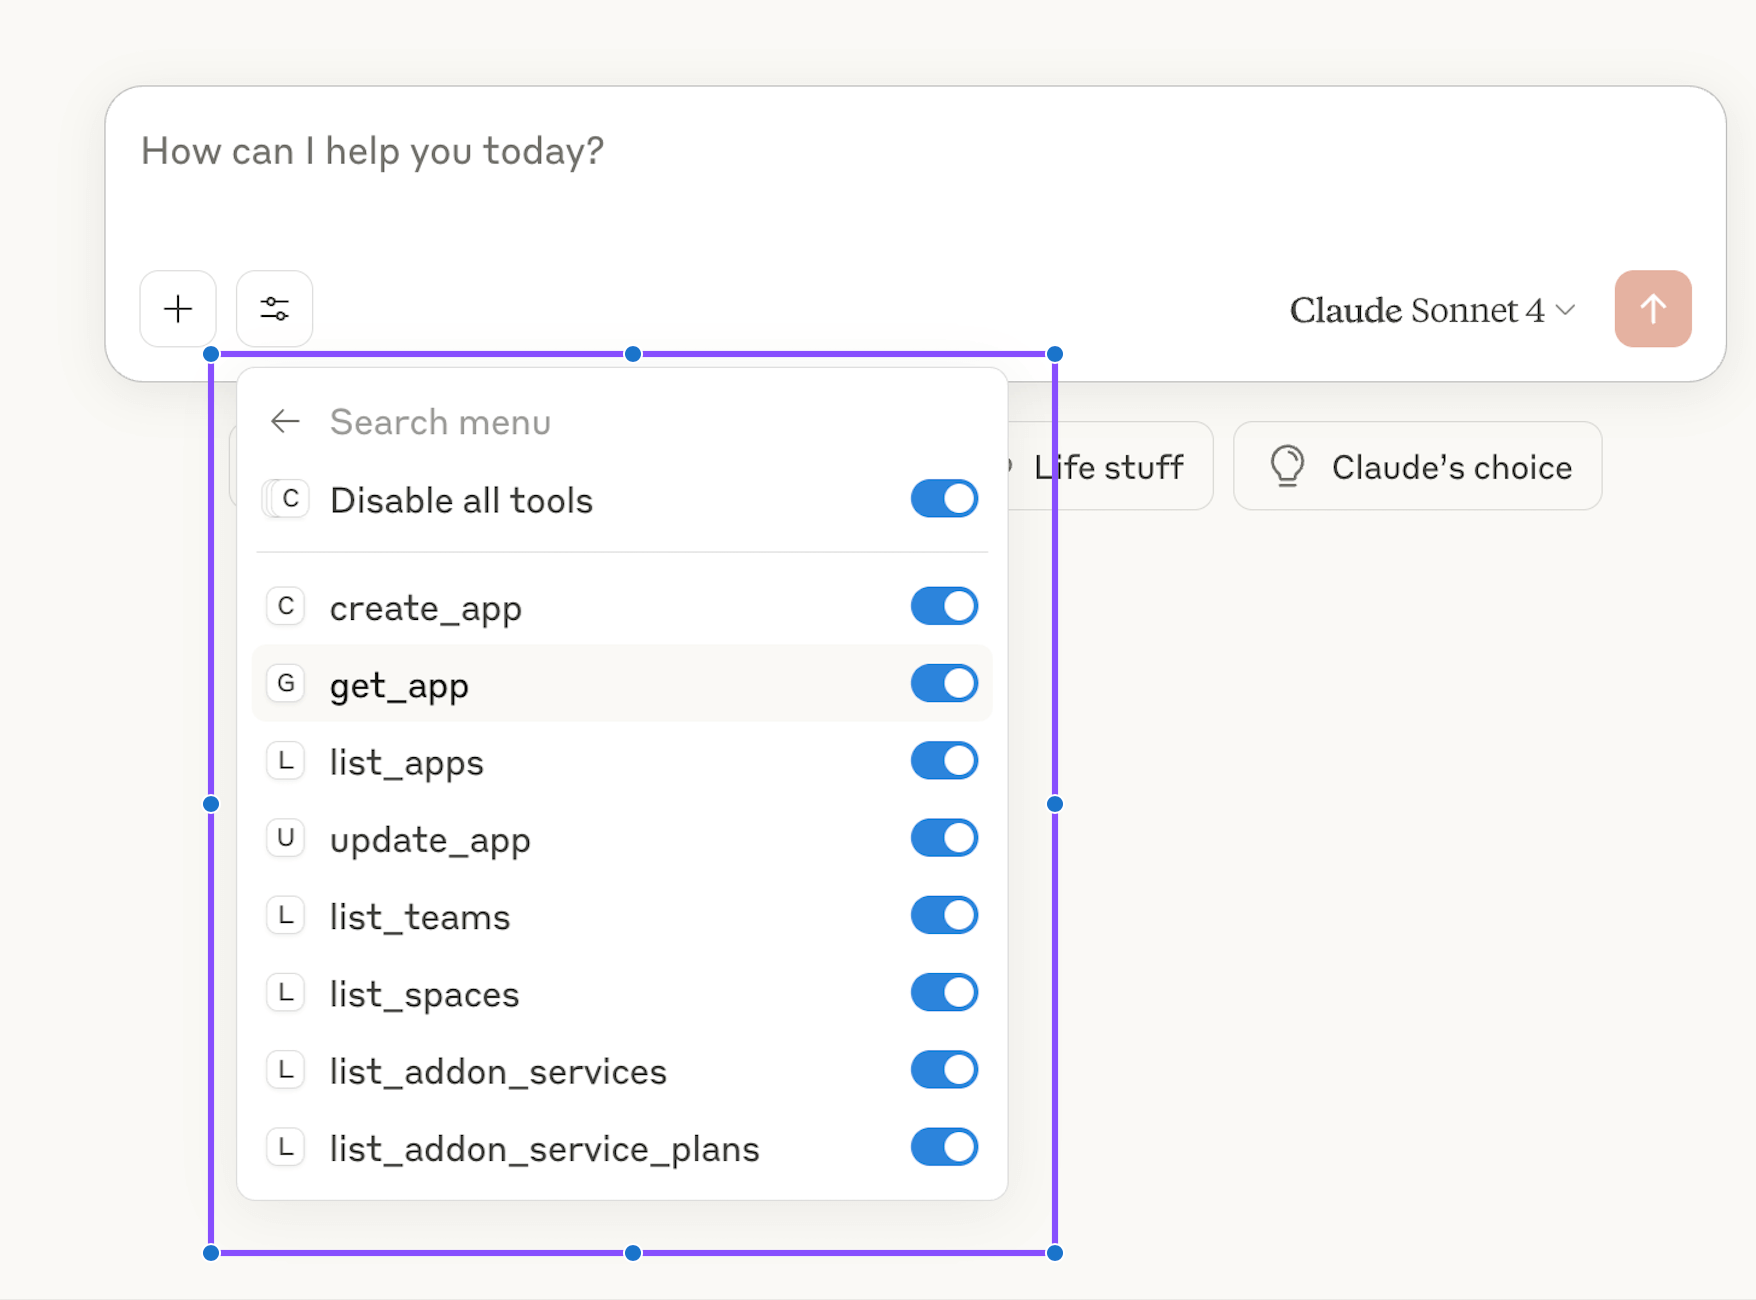
What’s next
We’re excited about the rapid innovation in the MCP and AI ecosystem and are keeping close to the community. We expect to make updates to our MCP tools as the protocol evolves and from customer feedback. We at Heroku are obsessed with providing the best developer and operator experience for your AI workflows and agents. We started this journey with the launch of Heroku Managed Inference and Agents and support to build stdio MCP servers on Heroku and the Heroku Remote MCP Server (mcp.heroku.com/mcp) is the next exciting milestone on this journey.
Join the official Heroku AI Trailblazer Community to keep up with the latest news, ask questions, or meet the team.
To learn more about Heroku AI, check out our Dev Center docs and try it out for yourself.
The post Heroku AI: Heroku Remote MCP Server appeared first on Heroku.
]]>The entire Heroku team offers our deepest apology for this service disruption. We understand that many of you rely on our platform as a foundation for your business. Communication during the incident did…
The post Summary of Heroku June 10 Outage appeared first on Heroku.
]]>The entire Heroku team offers our deepest apology for this service disruption. We understand that many of you rely on our platform as a foundation for your business. Communication during the incident did not meet our standards, leaving many of you unable to access accurate status updates and uncertain about your applications. Incidents like this can affect trust, our number one value, and nothing is more important to us than the security, availability, and performance of our services.
What happened
A detailed RCA is available here. Let’s go over some of the more important points. Our investigation revealed three critical issues in our systems that combined to create this outage:
- A Control Issue: An automated operating system update ran on our production infrastructure when it should have been disabled. This process restarted the host’s networking services.
- A Resilience Issue: The networking service had a critical flaw—it relied on a legacy script that only applied correct routing rules on initial boot. When the service restarted, the routes were not reapplied, severing outbound network connectivity for all dynos on the host.
- A Design Issue: Our internal tools and the Heroku Status Page were running on this same affected infrastructure. This meant that as your applications failed, our ability to respond and communicate with you was also severely impaired.
These issues caused a chain reaction that led to widespread impact, including intermittent logins, application failures, and delayed communications from the Heroku team.
Timeline of Events
(All times are in Coordinated Universal Time, UTC)
Phase 1: Initial Impact and Investigation (06:00 – 08:26)
At 06:00, Heroku services began to experience significant performance degradation. Customers reported issues including intermittent logins, and our monitoring detected widespread errors with dyno networking. Critically, our own tools and the Heroku Status Page were also impacted, which severely delayed our ability to communicate with you. By 08:26, the investigation confirmed the core issue: the majority of dynos in Private Spaces were unable to make outbound HTTP requests.
Phase 2: Root Cause Discovery (08:27 – 13:42)
With the impact isolated to dyno networking, the team began analyzing affected hosts. They determined it was not an upstream provider issue, but a failure within our own infrastructure. Comparing healthy and unhealthy hosts, engineers identified missing network routes at 11:54. The key discovery came at 13:11, when the team learned of an unexpected network service restart. This led them to pinpoint the trigger at 13:42: an automated upgrade of a system package.
Phase 3: Mitigation and Service Restoration (12:56 – 22:01)
While the root cause investigation was ongoing, this became an all-hands-on-deck situation with teams working through the night to restore service.
- Communication & Relief: At 12:56, the team began rotating restarts on internal instances, which provided some relief. A workaround was found to post updates to the @herokustatus account on X at 13:58.
- Stopping the Trigger: The team engaged an upstream vendor to invalidate the token used for the automated updates. This was confirmed at 17:30 and completed at 19:18, preventing any further hosts from being impacted.
- Restoring Services: The Heroku Dashboard was fully restored by 20:59. With the situation contained, the team initiated a fleetwide dyno recycle at 22:01 to stabilize all remaining services.
Phase 4: Long-Tail Cleanup (June 11, 22:01 – 05:50)
This started a long phase of space recovery as well as downstream fixes. Many systems had to catch up after service was restored. For example status emails from earlier in the incident started being delivered. Heroku connect syncing had to catch back up. Heroku release phase had a long backlog that took a few hours to catch up. After extensive monitoring to ensure platform stability, all impacted services were fully restored, and the incident was declared resolved at 05:50 on June 11.
Identified Issues
Our post-mortem identified three core areas for improvement.
First, the incident was triggered by unexpected weaknesses in our infrastructure. A lack of sufficient immutability controls allowed an automated process to make unplanned changes to our production environment.
Second, our communication cadence missed the mark during a critical outage, customers needed more timely updates – an issue made worse by the status page being impacted by the incident itself.
Finally, our recovery process took longer than it should have. Tooling and process gaps hampered our engineers’ ability to quickly diagnose and resolve the issue.
Resolution and Concrete Actions
Understanding what went wrong is only half the battle. We are taking concrete steps to prevent a recurrence and be better prepared to handle any future incidents.
- Ensuring Immutable Infrastructure: The root cause of this outage was an unexpected change to our running environment. We disabled the automated upgrade service during the incident (June 10), with permanent controls coming early next week. No system changes will occur outside our controlled deployment process going forward. Additionally, we’re auditing all base images for similar risks and improving our network routing to handle graceful service restarts.
- Guaranteeing Communication Channels: Our status page failed you when you needed it most because our primary communication tools were affected by the outage. We are building backup communication channels that are fully independent to ensure we can always provide timely and transparent updates, even in a worst-case scenario.
- Accelerating Investigation and Recovery: The time it took to diagnose and resolve this incident was unacceptable. To address this, we are overhauling our incident response tooling and processes. This includes building new tools and improving existing ones to help engineers diagnose issues faster and run queries across our entire fleet at scale. We are also streamlining our “break-glass” procedures to ensure teams have rapid access to critical systems during an emergency and enhancing our monitoring to detect complex issues much earlier.
Thank you for depending on us to build and run your apps and services. We take this outage very seriously and are determined to continuously improve the resiliency of our service and our team’s ability to respond, diagnose, and remediate issues. The work continues and we will provide updates in an upcoming blog post.
The post Summary of Heroku June 10 Outage appeared first on Heroku.
]]>As a Python developer constantly striving for smoother workflows and faster iterations, the buzz around uv has definitely caught my attention. So, let's roll up our sleeves and explore the benefits…
The post Local Speed, Smooth Deploys: Heroku Adds Support for uv appeared first on Heroku.
]]>As a Python developer constantly striving for smoother workflows and faster iterations, the buzz around uv has definitely caught my attention. So, let’s roll up our sleeves and explore the benefits of using uv as your Python package manager, taking a look at where we’ve come from and how uv stacks up. We’ll even walk through setting up a project for Heroku deployment using this exciting new tool.
A trip down memory lane: The evolution of Python package management
To truly appreciate what uv brings to the table, it’s worth taking a quick stroll down memory lane and acknowledging the journey of Python package management.
In the early days, installing Python packages often involved manual downloads, unpacking, and running setup scripts. It was a far cry from the streamlined experience we have today. Then came Distutils, which provided a more standardized way to package and distribute Python software. While a significant step forward, it still lacked robust dependency resolution.
Enter setuptools, which built upon Distutils and introduced features like dependency management and package indexing (the foundation for PyPI). For a long time, setuptools was the de facto standard, and its influence is still felt today.
However, as the Python ecosystem grew exponentially, the limitations of the existing tools became more apparent. Dependency conflicts, slow installation times, and the complexities of managing virtual environments started to become significant pain points.
This paved the way for pip (Pip Installs Packages). Introduced in 2008, pip revolutionized Python package management. It provided a simple and powerful command-line interface for installing, upgrading, and uninstalling packages from PyPI and other indices. For over a decade, pip has been the go-to tool for most Python developers, and it has served us well.
But the increasing complexity of modern Python projects, with their often intricate web of dependencies, has exposed some of pip’s performance bottlenecks. Resolving complex dependency trees can be time-consuming, and the installation process, while generally reliable, can sometimes feel sluggish.
Another challenge with the complexity of modern applications is package versioning. Lockfiles that pin project dependencies have become table stakes for package management. Many package management tools use them. Throughout the course of the evolution of package management in Python, we’ve seen managers such as Poetry and Pipenv, just to name a few. However, many of these projects don’t have dedicated teams. Sometimes this results in them not being able to keep up with the latest standards or the complex dependency trees of modern apps.
This is where the new generation of package management tools, like uv, comes into play, promising to address these very challenges, with a dedicated team behind them.
Enter the speed demon: The benefits of using uv
uv isn’t just another package manager; it’s built with a focus on speed and efficiency, leveraging modern programming languages and data structures to deliver a significantly faster experience. Here are some key benefits that have me, and many other Python developers, excited:
- Blazing Fast Installation: This is arguably uv’s headline feature. Written in Rust from scratch using a thoughtful design approach uv significantly outperforms pip in resolving and installing dependencies, especially for large and complex projects. The difference can be dramatic, cutting down installation times from minutes to seconds in some cases. This speed boost translates directly into increased developer productivity and faster CI/CD pipelines.
- Efficient Dependency Resolution: uv employs sophisticated algorithms for dependency resolution, aiming to find compatible package versions quickly and efficiently. While pip has made improvements in this area, uv’s underlying architecture allows it to handle complex dependency graphs with remarkable speed. This reduces the likelihood of dependency conflicts and streamlines the environment setup process.
- Drop-in Replacement for pip and
venv: One of the most appealing aspects of uv is its ambition to be a seamless replacement for both pip andvenv(Python’s built-in virtual environment tool). It aims to handle package installation and virtual environment creation with a unified command-line interface. This simplifies project setup and management, reducing the cognitive load of juggling multiple tools. - Compatibility with Existing Standards: uv adheres to existing Python packaging standards like
pyproject.toml(PEP 621). This means that projects already using these standards can easily adopt uv without significant modifications. It reads and respects your existingpyproject.tomlfiles, making the transition relatively smooth. uv is built with a strong emphasis on modern packaging practices, encouraging the adoption ofpyproject.tomlfor declaring project dependencies and build system requirements. This aligns with the direction the Python packaging ecosystem is heading. - Improved Error Messaging: While pip’s error messages have improved over time, uv, being a newer tool, has the opportunity to provide more informative and user-friendly error messages, making debugging dependency issues easier.
- Potential for Future Enhancements: As a relatively new project with a dedicated development team, uv has the potential to introduce further optimizations and features that could significantly enhance the Python development experience. The active development and growing community support are promising signs.
How to use uv with Heroku
Now, let’s put some of this into practice. Imagine we’re building a simple Python web application (using Flask, for instance) that we want to deploy to Heroku, and we want to leverage the speed and efficiency of uv in our development and deployment process.
Here’s how we can set up our project:
1. Install uv
There are a variety of options to install uv, depending on your operating system. For a full list, take a look at the official Installation Guide site. I’m going to install it using Homebrew:
~/user$ brew install uv
2. Create the project directory and initialize uv
~/user$ uv init my-app
~/user$ cd my-app
~/user/my-app$ ls -a
In doing that, uv generates several project files
my-app/
├── main.py
├── pyproject.toml
├── README.md
└── .python-version
Our main.py looks like this:
def main():
    print("Hello from my-app!")

if __name__ == "__main__":
    main()
We can run this with the uv run main.py command which does a few things for us. In addition to actually running main.py and generating the “Hello from my-app!” output, uv also generates a virtual environment for the project and generates a uv.lock file which describes the project. More on that in a bit.
3. Expanding the project… slightly.
Let’s take this project a bit further and turn it into a Flask app that we can deploy to Heroku. We’ll need to specify our dependencies, Flask and Gunicorn for this example. We can do this using pyproject.toml.
Using pyproject.toml:
The uv generated pyproject.toml file looks like this:
[project]
name = "my-app"
version = "0.1.0"
description = "Add your description here"
readme = "README.md"
requires_python =">=3.13"
dependencies = []
To add dependencies we use the uv add command.
~/user/my-app$ uv add Flask
~/user/my-app$ uv add gunicorn
This accomplishes a couple of things:
First, it adds those packages to the pyproject.toml file:
[project]
name = "my-app"
version = "0.1.0"
description = "Add your description here"
readme = "README.md"
requires_python =">=3.13"
dependencies = [
    "Flask>=3.1.1",
    "gunicorn>=23.0.0",
]
Second, it updates the uv.lock file for dependency management.
4. Updating main.py
Let’s update the code in main.py to be a basic Flask web application
from flask import Flask

app = Flask(__name__)

@app.route('/')
def hello_world():
    return "Hello from uv on Heroku!"

if __name__ == '__main__':
    app.run(debug=True)
5. Preparing for Heroku deployment:
Heroku needs to know how to run your application. For a Flask application, we typically use Gunicorn as a production WSGI server. We’ve already included it in our dependencies.
We’ll need a Procfile in the root of our project to tell Heroku how to start our application:
web: gunicorn main:app
Here, app refers to the name of our Flask application instance in main.py.
6. Deploying to Heroku:
Now, assuming you are in the project working directory, have the Heroku CLI installed, and have logged in, you can create a local git repository and Heroku application:
~/user/my-app$ git init
~/user/my-app$ heroku create python-uv  # Replace python-uv with your desired app name
~/user/my-app$ git add .
~/user/my-app$ git commit -m "Initial commit with uv setup"
The Heroku CLI will create a remote in your git repository, but you check to make sure it’s there before you and push your code
~/user/my-app$ git remote -v
heroku https://git.heroku.com/python-uv.git (fetch)
heroku https://git.heroku.com/python-uv.git (push)
~/user/my-app$ git push heroku main
Heroku will detect your Python application, install the dependencies (based on .python-version, uv.lock and pyproject.toml), and run your application using the command specified in the Procfile.
The future is bright (and fast!)
We’re excited to announce that Heroku now natively supports uv for your Python development. By combining uv’s performance with Heroku’s fully managed runtime, teams can ship faster with greater confidence in their environment consistency. This reduces onboarding time, eliminates flaky builds, and improves pipeline performance.
While uv is still relatively new, its potential to significantly improve the Python development workflow is undeniable. The focus on speed, efficiency, and modern packaging standards addresses some of the long-standing frustrations with existing tools.
As the project matures and gains wider adoption, we can expect even more features and tighter integration with other parts of the Python ecosystem. For now, even the significant speed improvements in local development are a compelling reason for Python developers to start exploring uv.
The journey of Python package management has been one of continuous improvement, and uv represents an exciting step forward. If you’re a Python developer looking to boost your productivity and streamline your environment management, I highly recommend giving uv a try. You might just find your new favorite package manager!
Try uv out on Heroku
Whether you’re modernizing legacy apps or spinning up new services, uv gives you the speed and flexibility you need—now with first-class support on Heroku. Get started with uv on Heroku today.
The post Local Speed, Smooth Deploys: Heroku Adds Support for uv appeared first on Heroku.
]]>Postgres 17: Powering your applications with enhanced performance and security
Before we dive into the simplicity of the new upgrade process, let's talk about what makes PostgreSQL 17 a must-have. This release brings significant improvements that directly translate to better…
The post Heroku Postgres 17 with the New Upgrade Process: Faster Performance, Easier Upgrade appeared first on Heroku.
]]>Postgres 17: Powering your applications with enhanced performance and security
Before we dive into the simplicity of the new upgrade process, let’s talk about what makes PostgreSQL 17 a must-have. This release brings significant improvements that directly translate to better performance and stronger security for your applications.
- Fast Query Performance: Postgres 17 delivers notable enhancements to query optimization. Expect to see faster execution times, especially for complex queries.
INclauses with B-tree indexes should see a big improvement, so shouldIS NOT NULLclauses from improved query planning. Also, the new streaming I/O interface helps optimize sequential scans when reading massive amounts of data from a table. - Improved Write Performance: For applications that heavily rely on write operations, Postgres 17 brings good news. Expect better throughput and reduced latency, ensuring your data is written quickly and efficiently, thanks to improvements with WAL processing.
- JSON Enhancements: Postgres 17 introduces enhanced JSON support, including the JSON_TABLE function to convert JSON data into standard PostgreSQL tables. Additionally, SQL/JSON constructors and query functions simplify working with JSON data.
- Vacuum Memory Optimization: Postgres 17 utilizes a new internal memory structure, leading to faster vacuum speeds and a significant reduction in memory consumption of up to 20 times. This optimization allows your workload to have more memory available since the essential PostgreSQL vacuum process now requires less memory to maintain healthy operations.
- Better Observability: Understanding how your database performs is critical. Postgres 17 brings improvements that allow for better monitoring and observation of your database instances with additional EXPLAIN output, capturing time spent for I/O block reads/writes and SERIALIZE and MEMORY options.
These enhancements, and more, mean your Heroku applications will run smoother, safer, and more efficiently with Postgres 17.
Simplify Postgres upgrades
Upgrading your Postgres database has traditionally been a multi-step process involving creating a follower database, upgrading the follower, stopping your application, waiting for data synchronization, and finally promoting the upgraded database. This process can be time-consuming, error-prone, and disruptive to your application’s availability.
We want to change all that. With the new, now default, upgrade method, we’re simplifying this process significantly. This new feature allows you to upgrade your leader Postgres database directly with a 1-step process, removing many manual steps, by default. Rest assured, we have been using this method internally, and successfully performed upgrades on nearly 20,000 databases so far.
Benefits of the new upgrade method
The new Upgrade leverages the capabilities of Postgres’ pg_upgrade utility to perform the upgrade directly on your existing database, in-place. This eliminates the need for data copying and synchronization, resulting in a faster and more efficient upgrade process.
- Reduced Manual Tasks: The new method skips many manual steps required today to perform an upgrade. The improvements in automation can help reduce human-errors and provide peace of mind during upgrades.
- Reduced Downtime: By eliminating the need for a follower database preparation and data synchronization, this in-place upgrade method significantly reduces the time required to upgrade your database.
- Simplified Process: The streamlined upgrade process eliminates the complexity of multi-step procedures that are prone to human errors, leading to safer maintenance overall.
For example, below diagram compares the typical non-Essential database upgrade process vs the new, in-place upgrade process:
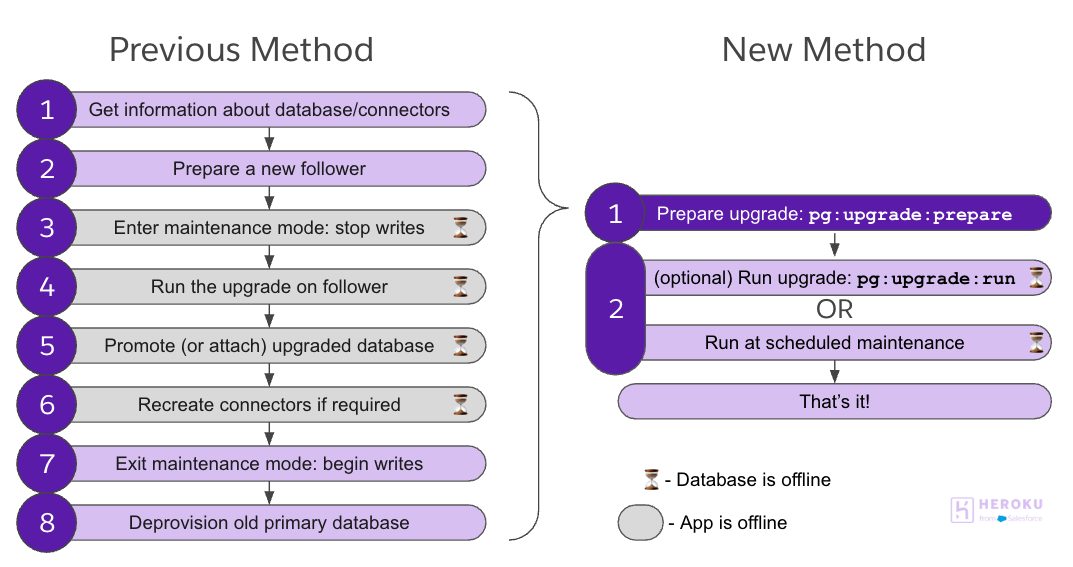
Getting started with the new upgrade
The new Upgrade is available for all Heroku Postgres plans. To use the new process, simply initiate it from your CLI.
First, prepare the upgrade (skip this step if you’re on Essential plan):
heroku pg:upgrade:prepare HEROKU_POSTGRESQL_RED --app example-appThen run the upgrade when it is ready by running below command, or wait for the next maintenance window.
heroku pg:upgrade:run HEROKU_POSTGRESQL_RED --app example-appThat’s it!
Please refer to our Dev Center article or take a look at Heroku Postgres Upgrade Guide: Simplify Your Move to Version 17 to learn more about the change.
While the new Upgrade offers significant benefits by automating many steps, it’s important to note that if the database is very large, the upgrade duration or follower recreation can take about the same time as the previous, manual approaches.
Although we are changing the default method to use the new method for upgrading going forward, you can always use pg:upgrade or pg:copy as documented here.
Conclusion
Heroku Postgres 17 launching with the new upgrade method represents a major step forward in developer experience to manage a database on Heroku. We’re committed to providing you with the tools and features you need to build and run powerful, scalable applications. Our support team is available to assist you should you have any questions or need help. Upgrade to Heroku Postgres 17 today and experience the benefits of the new upgrade method for yourself!
The post Heroku Postgres 17 with the New Upgrade Process: Faster Performance, Easier Upgrade appeared first on Heroku.
]]>But Postgres, like all software, continues to evolve. With new versions released each year, you gain access to performance enhancements, critical security updates, and powerful new features. Keeping your database up to date isn’t just good practice — it’s essential for long-term stability and success.
That’s why we’re thrilled to share that Postgres 17 is now available on Heroku . And…
The post Heroku Postgres Upgrade Guide: Simplify Your Move to Version 17 appeared first on Heroku.
]]>But Postgres, like all software, continues to evolve. With new versions released each year, you gain access to performance enhancements, critical security updates, and powerful new features. Keeping your database up to date isn’t just good practice — it’s essential for long-term stability and success.
That’s why we’re thrilled to share that Postgres 17 is now available on Heroku. And with our newly simplified upgrade process, keeping your database current has never been easier. There’s no better time to plan your next upgrade and take full advantage of everything Postgres 17 has to offer.
What is Heroku Postgres?
Heroku Postgres is a managed Postgres service built into the Heroku platform. It handles provisioning, maintenance, backups, high availability, and monitoring so that customers can focus on building engaging data-driven applications, instead of managing infrastructure.
Why upgrading your Postgres version matters
There are several important reasons for why upgrading your Postgres database is necessary,
- Security: Postgres regularly releases security updates to patch vulnerabilities. Running an outdated version could expose your database to known security risks. Once a version is unsupported, the Postgres Community won’t have any more security releases for that version.
- Bug Fixes: Each new version includes fixes for bugs and issues found in previous versions.
- Performance Improvements: Newer versions often include performance optimizations, better query planning, and improved resource utilization.
- New Features: Postgres releases bring new features and capabilities that can enhance your database’s functionality. For example:
- Better parallel query execution
- Improved indexing options
- Enhanced monitoring capabilities
- New data types and functions
- Compatibility: Staying current helps maintain compatibility with other tools, libraries, and applications that interact with your database.
The backstory: Our Postgres version support & deprecation policy
At Heroku, we follow a well-defined lifecycle for Postgres versions:
- Each major version is supported for a set period — currently three years.
- When a version approaches end-of-support, we begin our deprecation process — announcing an upcoming removal from the platform and stopping new provisioning.
- When deprecation is announced, we give customers advance notice and time to upgrade manually.
- If no action is taken, we then automatically upgrade databases still on unsupported versions, ensuring security and platform stability.
What we learned
Our internal upgrade automation has quietly and successfully upgraded tens of thousands of databases each year leading many customers to ask:
That demand inspired the improved pg:upgrade CLI experience — a safer, more transparent, and self-service version of our proven internal tools. Now, all Heroku Postgres users can benefit from the same automation and built-in checks that power our large-scale upgrade process.
Visit our devcenter for more details on how Heroku manages Postgres version support and deprecation timelines.
Introducing new pg:upgrade commands
We’re rolling out five new heroku pg:upgrade:* commands that give you more control, visibility, and confidence during Postgres version upgrades:
pg:upgrade:prepare – Schedule a Postgres upgrade for Standard-tier and higher leader databases during your next maintenance window.
pg:upgrade:run – Trigger an upgrade manually. Perfect to start an upgrade immediately on Essential-tier databases and follower databases, or run a prepared upgrade before the next scheduled maintenance window on a Standard-tier or higher database.
pg:upgrade:cancel – Cancel a scheduled upgrade (before it starts running).
pg:upgrade:dryrun – Simulate an upgrade on a Standard-tier or higher database using a follower to preview the upgrade experience and detect any potential issues — no impact on your production database.
pg:upgrade:wait – Track the progress of your upgrade in real time.
You’ll receive email notifications at every key stage:
- When the upgrade is scheduled, running, cancelled and completed (successfully or not).
- After a dry run completes, with a summary of the results and any potential issues detected.
Upgrading is now a simple 1-step process
You might notice there are more commands available now, but upgrading your database has actually become much simpler — it’s now just a 1-step process!
Heroku handles what used to be multiple manual steps — provisioning a follower, entering maintenance mode, promoting, reattaching, exiting maintenance mode — all with a single workflow.
See the section below for the most efficient path based on your database tier.
Step-by-step: How to upgrade Heroku Postgres
Essential-tier database upgrades
To upgrade, just run:
heroku pg:upgrade:run HEROKU_POSTGRESQL_RED --app example appThat’s it — no preparation step required.
Note: If you don’t specify a version with --version, the upgrade will use the latest supported Postgres version on Heroku.
Standard-tier & higher database upgrades
We recommend this process for Standard-tier and higher, regardless of whether or not you have follower databases.
Step 0 – Optional (but recommended)
Run a test upgrade to detect any potential issues before upgrading your production database.
heroku pg:upgrade:dryrun HEROKU_POSTGRESQL_RED --app example-appThen proceed with the actual upgrade in one simple step:
Step 1 – Prepare the upgrade
heroku pg:upgrade:prepare HEROKU_POSTGRESQL_RED --app example-app --version 17This schedules the upgrade for your next maintenance window.
Note: If --version is not specified, we’ll automatically use the latest supported Postgres version on Heroku.
Use the following to track when the upgrade is scheduled and ready to run:
heroku pg:upgrade:wait HEROKU_POSTGRESQL_RED --app example-appStep 2 (Optional) – Manually run the upgrade
heroku pg:upgrade:run HEROKU_POSTGRESQL_RED --app example-appThis will upgrade your leader database and its follower(s) automatically.
Track the progress until completion with:
heroku pg:upgrade:wait HEROKU_POSTGRESQL_RED --app example-appTip: If you don’t manually run this command, the upgrade will be run automatically during the scheduled maintenance window. You can view your app’s maintenance window and scheduled maintenances by running:
heroku pg:info HEROKU_POSTGRESQL_RED --app example-appFor more information on maintenance windows, check out the Heroku Postgres Maintenance documentation.
Benefits of the new upgrade mechanism
- The new upgrade operates in-place using an internal replica, simplifying the process, removing the need to manage a separate follower add-on, and minimizing the risk of data loss or inconsistencies by managing database access internally throughout the upgrade.
- Using this automation will reduce downtime to about 5-10 minutes for a typical upgrade.
- When you upgrade your leader database, any followers are automatically upgraded – no need to recreate or manually reattach followers.
- Your app’s
DATABASE_URLand other config_vars remain unchanged after the upgrade, ensuring your application continues to operate without any reconfiguration. - The same simple steps apply to upgrading databases with Streaming Data Connectors, replacing what used to require at least 8 manual steps as outlined here.
- If we detect a known issue with your data/schema during the upgrade, you’ll receive an email with remediation steps to help you complete the upgrade.
- If the issue is unexpected or cannot be resolved automatically, we’ll prompt you to open a support ticket so our team can help troubleshoot.
- In all cases, your database remains available, and user access is restored once the upgrade process completes — whether it finishes successfully or is automatically aborted for safety.
- Want added peace of mind? Run a test upgrade in advance using
heroku pg:upgrade:dryrun. This simulates the upgrade on a copy of your database and highlights potential issues before touching production.
The “old” follower upgrade approach
While we now recommend upgrading the leader database directly using the approach explained
above, customers who prefer the traditional flow can still use the follower upgrade approach.
To do this, you can continue to follow the steps as described here.
In order to run the upgrade, use:
heroku pg:upgrade:run HEROKU_POSTGRESQL_RED --app example-appThis approach has one notable benefit, your original leader database remains untouched during the upgrade, which allows for easier rollback, testing, or verification before promoting the upgraded follower.
Deprecation notice
The legacy heroku pg:upgrade command will be deprecated soon. To ensure a smoother, safer upgrade experience, we strongly recommend switching to the new heroku pg:upgrade:* subcommands.
If you continue to use the old command, you’ll receive tailored warnings and redirection to help guide you toward the updated flow. Make the switch today to take full advantage of the simplified, automated upgrade process.
Upgrading shouldn’t be a chore – it should be a habit
Upgrading your Postgres database shouldn’t be a last-minute scramble — it should be a routine habit. Regular upgrades help keep your applications secure and performant, while also giving you access to the latest features and improvements that drive innovation. By making upgrades a part of your development rhythm, you set your systems up for long-term stability, scalability, and success.
At Heroku, we’re focused on making the overall Postgres experience safer and more intuitive for developers. A key part of that is improving the upgrade process: with streamlined tooling, automation, and built-in safeguards, upgrading your Postgres version is now significantly faster and more reliable. All of this is designed to help you stay focused on what matters most – building and shipping great apps – while staying confident that your data layer is future-ready.
The post Heroku Postgres Upgrade Guide: Simplify Your Move to Version 17 appeared first on Heroku.
]]>The post Heroku AI: Claude 4 Sonnet is now available appeared first on Heroku.
]]>Claude 4 Sonnet offers a significant leap in performance, balancing cutting-edge intelligence with impressive speed and cost-efficiency. It’s designed to excel at a wide range of tasks, making it a versatile tool for developers looking to integrate advanced AI capabilities into their Heroku applications.
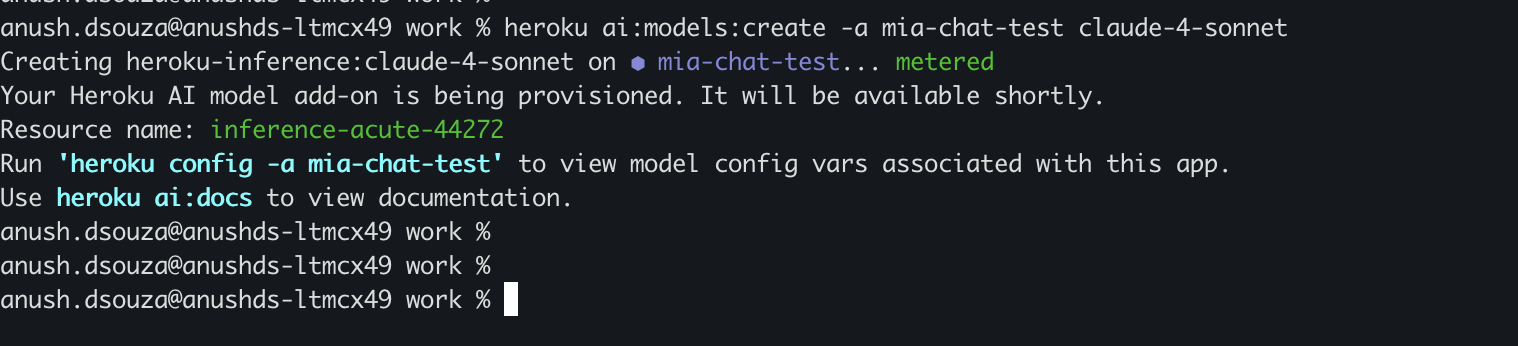
Building with Claude 4 Sonnet made simple
Integrating Claude 4 Sonnet into your Heroku applications is streamlined through Heroku Managed Inference and Agents:
- Seamless Integration: Easily attach Claude 4 Sonnet as a resource to your Heroku app. Environment variables are automatically configured, enabling straightforward API calls from your application code.
- Build Powerful AI Agents: Combine Claude 4 Sonnet’s intelligence with Heroku’s agentic capabilities. Utilize the Model Context Protocol (MCP) to connect your LLM-powered agents to your existing tools, databases (like pgvector for Heroku Postgres for RAG), and other services within Heroku’s trusted environment.
- Unified API Access: Heroku Managed Inference and Agents provides a consistent API experience, making it easier to experiment with and switch between different models as your requirements evolve.
Getting started with Claude 4 Sonnet on Heroku
You can start leveraging Claude 4 Sonnet in your Heroku applications today.
- Provision the Model: Attach the Claude 4 Sonnet model to your application using the Heroku CLI.
heroku ai:models:create -a YOUR_APP_NAME claude-4-sonnet - Utilize API Endpoints: Once provisioned, your application will have the necessary configuration variables to make API calls to the /v1/chat/completions endpoint (or the relevant agent endpoint like /v1/agents/heroku) to interact with Claude 4 Sonnet.You can invoke the model using various methods, including curl, or libraries available for Python, Ruby, and JavaScript, as detailed in the Heroku Dev Center documentation for Managed Inference and AgentsExample curl request:
export INFERENCE_MODEL_ID=$(heroku config:get -a $APP_NAME INFERENCE_MODEL_ID)
# Ensure this is the Claude 4 Sonnet ID
export INFERENCE_KEY=$(heroku config:get -a $APP_NAME INFERENCE_KEY)
export INFERENCE_URL=$(heroku config:get -a $APP_NAME INFERENCE_URL)

curl $INFERENCE_URL/v1/chat/completions \
  -H "Authorization: Bearer $INFERENCE_KEY" \
  -H "Content-Type: application/json" \
  -d '{
        "model": "'"$INFERENCE_MODEL_ID"'",
        "messages": [
          {"role": "user", "content": "Explain the benefits of using PaaS for AI applications."}
        ]
      }'
The future of AI Development on Heroku
The addition of Claude 4 Sonnet to Heroku Managed Inference and Agents represents our ongoing commitment to providing developers with powerful, accessible AI tools. We are excited to see the innovative applications and intelligent solutions you will build.
For detailed documentation, model IDs, and further examples, please visit the Heroku Dev Center.
Start building with Claude 4 Sonnet on Heroku today and redefine what’s possible with AI!
The post Heroku AI: Claude 4 Sonnet is now available appeared first on Heroku.
]]>One of the goals we set out to achieve with Fir is to modernize our platform's observability architecture. Applications being written today are becoming increasingly more distributed and complex in nature. With this increase in complexity, the need for good observability becomes critical. With solid observability practices in place, it becomes possible to gain deep insights into the internal…
The post OpenTelemetry Basics on Heroku Fir appeared first on Heroku.
]]>One of the goals we set out to achieve with Fir is to modernize our platform’s observability architecture. Applications being written today are becoming increasingly more distributed and complex in nature. With this increase in complexity, the need for good observability becomes critical. With solid observability practices in place, it becomes possible to gain deep insights into the internal state of these complex systems.
The Cloud Native Computing Foundation (CNCF)’s second most popular project, OpenTelemetry, standardizes and simplifies the collection of observability data (logs, metrics, and traces) for distributed systems. Integrating OpenTelemetry into Fir makes it easier to monitor, troubleshoot, and improve complex applications and services. OpenTelemetry is more than just a set of tools – it is a standard you as an end-user can benefit from a growing community of vendors that support the OpenTelemetry protocol.
It is for these reasons that we have chosen to build OpenTelemetry directly into the Fir platform. In this blog post we will explain what OpenTelemetry is and how you can quickly get started using OpenTelemetry on Heroku.
What is OpenTelemetry
OpenTelemetry is an open-standard framework that provides a standardized way to collect and export telemetry data from applications. It supports three primary signals:
- Logs: Capture discrete events that happen over time. This signal type provides detailed context for events, aiding in debugging and auditing.
- Metrics: Provide quantitative measurements of system behavior captured at runtime. Metrics offer insights into system performance and resource utilization.
- Traces: Record the execution path of requests through a system. These help in understanding the flow of requests and diagnosing latency issues.
In addition to these three signals, two more are under development.
- Events: A specific type of log, an Event is a named occurrence at an instant in time. It signals that “this thing has happened at this time”. Examples of Events might include things like uncaught exceptions, network events, user login/logout, etc.
- Profiles: A mechanism to collect performant and consistent profiling data
OpenTelemetry SDKs and Collectors
The OpenTelemetry SDK and Collector serve distinct purposes in an observability pipeline. The SDK is a library that allows developers to instrument their applications to generate telemetry like traces, metrics and logs. The collector sits downstream of the application and receives, processes and exports that telemetry data to various other backends. The collector acts as a central hub for observability data.
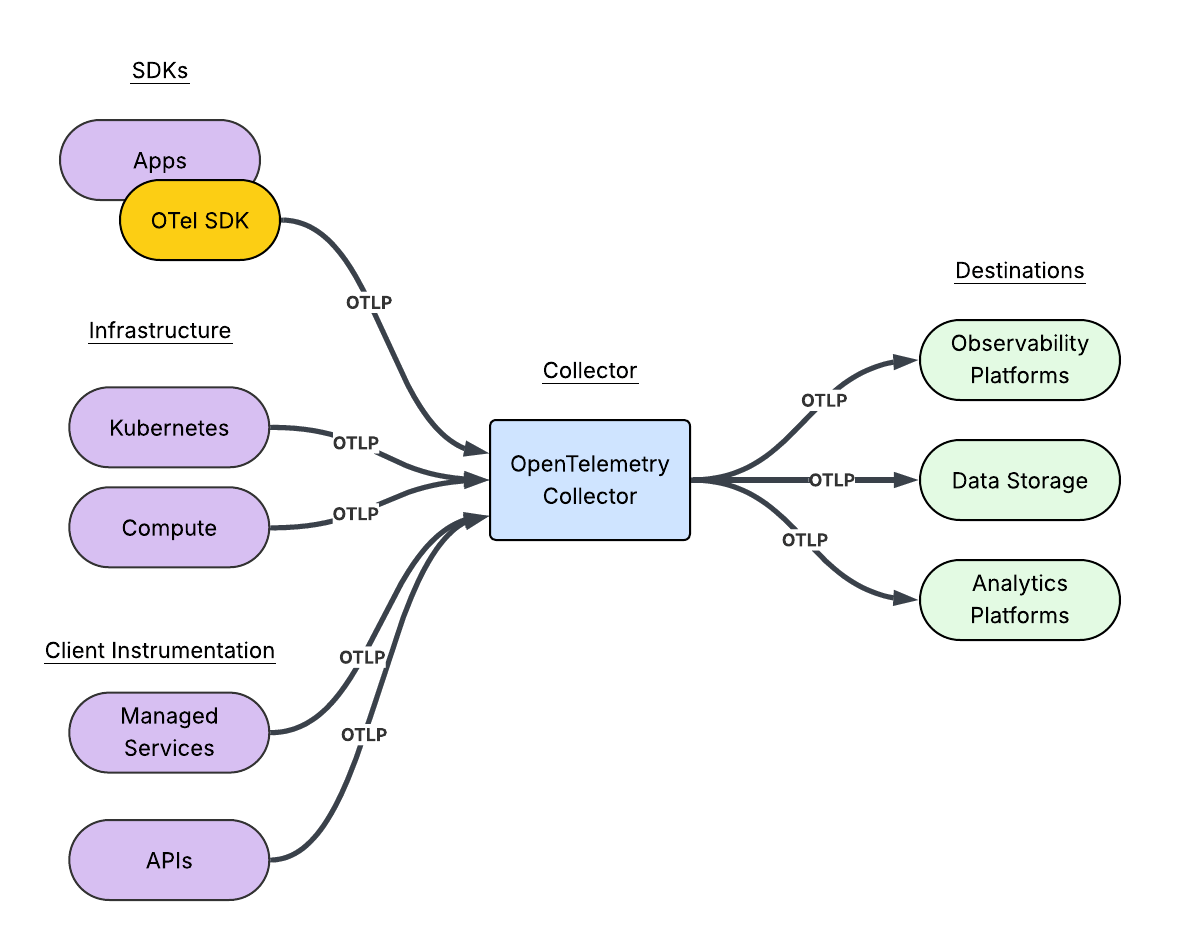
To recap,
An OpenTelemetry SDK:
- Provides language-specific implementations of the OpenTelemetry API.
- Empowers the developers to instrument applications, generating telemetry data.
- Manages the data collection and processing within the application.
- Sends the telemetry data to a Collector or directly to an observability backend.
An OpenTelemetry Collector:
- Is a standalone, vendor-agnostic process.
- Receives telemetry data from multiple sources, including SDKs.
- Processes the telemetry data through pipelines.
- Exports processed telemetry data to observability backends like Prometheus, Jaeger and other vendors.
- Acts as a central hub for managing telemetry pipelines.
At Heroku, our mission is to provide a platform that allows you, the developer, to focus on what matters most; building that app itself. Our platform automatically acts as the central hub for managing your telemetry pipelines.
Getting started
For the purposes of this blog post we are going to use the Getting Started on Heroku Fir with Go tutorial. Zipping through most of the instructions we can bootstrap our application using only a few commands from a terminal.
The first thing we need to do is ensure that we have the latest version of the Heroku CLI installed. If you do not have the Heroku CLI installed or need to perform an update, simply follow the instructions found in the Heroku Dev Center.
$ heroku version
heroku/10.7.0 darwin-arm64 node-v20.19.1
Now we need a Fir space, so let’s create one:
$ heroku spaces:create heroku-otel-demo --generation fir --team demo-team
 ›   Warning: Spend Alert. Each Heroku Standard Private Space costs ~$1.39/hour (max $1000/month), pro-rated to the second.
 ›   Warning: Use heroku spaces:wait to track allocation.
=== heroku-otel-demo

ID:         bdacda5f-a9b5-41a7-a613-58a546ccd645
Team:       heroku-runtime-playground
Region:     virginia
CIDR:       2600:1f18:7a42:c600::/56
Data CIDR:
State:      allocated
Shield:     off
Generation: fir
Created at: 2025-04-23T20:51:39Z
Next we need to clone down the repository and change in our working directory:
$ git clone https://github.com/heroku/go-getting-started.git
Cloning into 'go-getting-started'...
remote: Enumerating objects: 4352, done.
remote: Counting objects: 100% (897/897), done.
remote: Compressing objects: 100% (711/711), done.
remote: Total 4352 (delta 470), reused 162 (delta 162), pack-reused 3455 (from 2)
Receiving objects: 100% (4352/4352), 10.62 MiB | 3.26 MiB/s, done.
Resolving deltas: 100% (1734/1734), done.

$ cd go-getting-started/
Now, we can simply create the application and push the code to Heroku:
$ heroku create --space heroku-otel-demo
Creating app in space heroku-otel-demo... done, ⬢ fathomless-island-10342
https://fathomless-island-10342-6bd6dfa13d9e.aster-virginia.herokuapp.com/ | https://git.heroku.com/fathomless-island-10342.git

$ git push heroku main
Enumerating objects: 3679, done.
Counting objects: 100% (3679/3679), done.
Delta compression using up to 16 threads
Compressing objects: 100% (2033/2033), done.
Writing objects: 100% (3679/3679), 8.35 MiB | 448.00 KiB/s, done.
Total 3679 (delta 1444), reused 3676 (delta 1444), pack-reused 0 (from 0)
remote: Resolving deltas: 100% (1444/1444), done.
remote: Updated 1310 paths from 49f32a9
remote: Compressing source files... done.
remote: Building source:
...
Finally, we can verify that the application is running using one last command:
$ heroku open
This will open your default browser window. You should see something like this:
Great! We’ve got a functioning application running inside a Fir Space. Our next step is to send any platform telemetry to an observability vendor. For this demo, we’re going to use Grafana Cloud. Head over to grafana.com and create a Cloud Free account. Once you have signed up you will be presented with a Welcome to Grafana Cloud page.
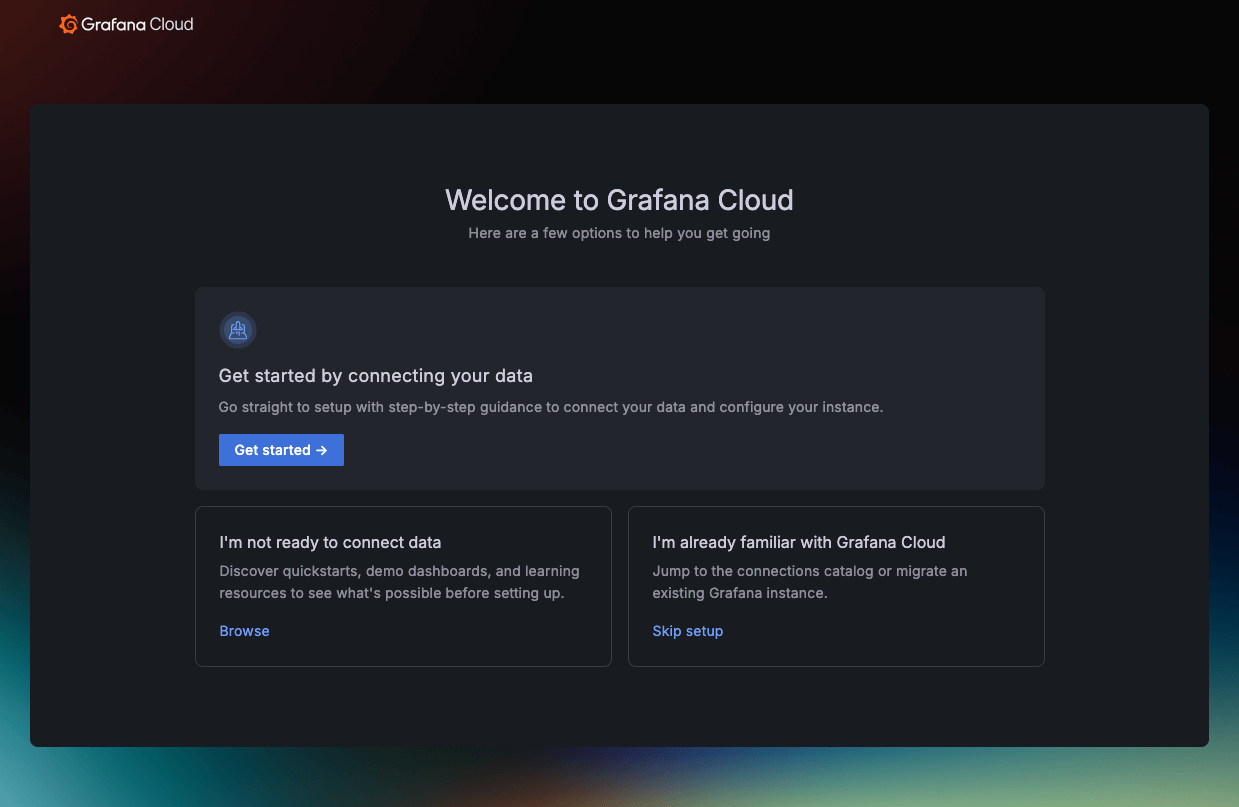
At this point, we are going to skip the rest of the “Getting started” steps. The directions provided by the setup guide do not apply to how we are going to send telemetry data. For now, we can simply click “Skip setup”.
The easiest way to establish a Heroku Telemetry Drain to Grafana Cloud is to use a slightly different path. In a new browser tab, we will simply use the Grafana Cloud Portal. From Grafana.com click “My Account”.
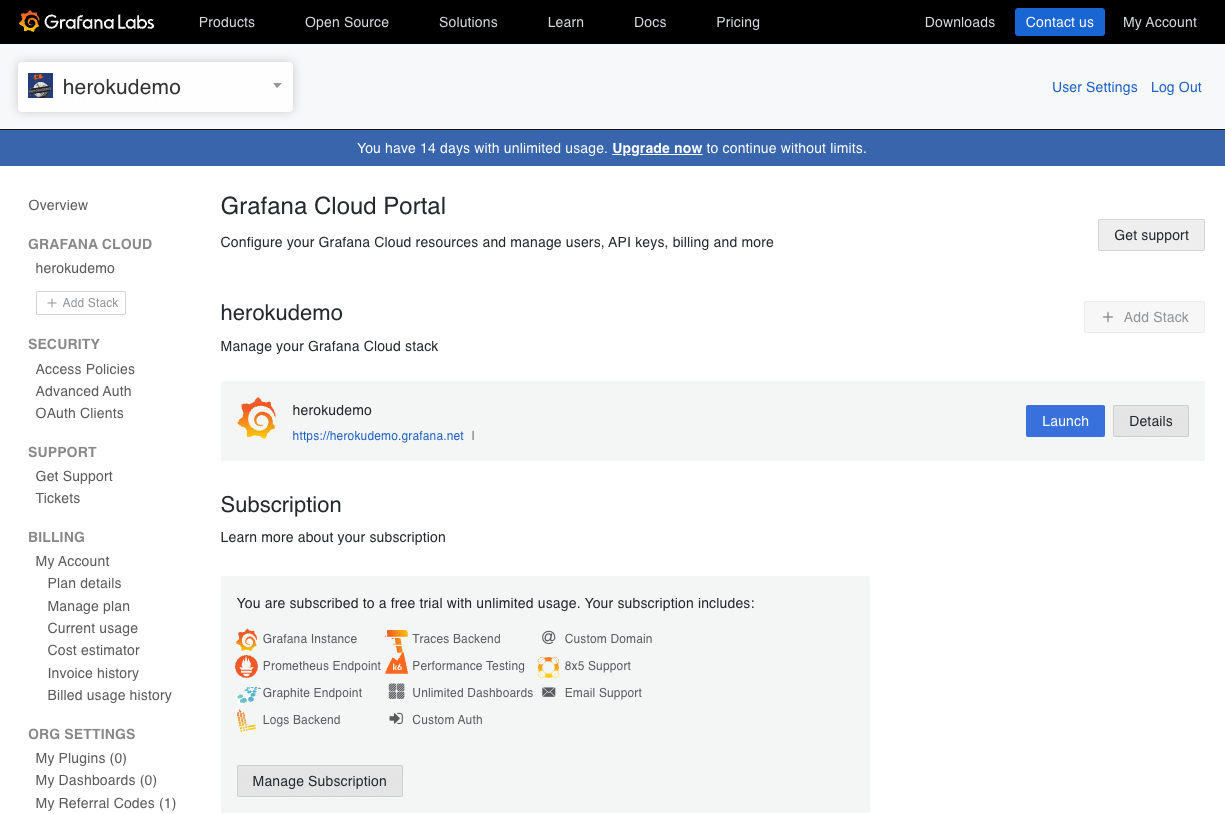
From there, click the “Details” button next to your Grafana Cloud stack. Mine is called herokudemo. Next click on the OpenTelemetry “Configure” button.

For now, don’t worry about copying any of the details to your Clipboard. Instead, scroll down to the “Password / API Token” section and click on the “Generate now” link. Give your token a name. Once you are done, make sure you keep a copy of the generated token for future reference. Now that we have a token, scroll down a bit more and copy the contents of the “Environment Variables” section to your clipboard.
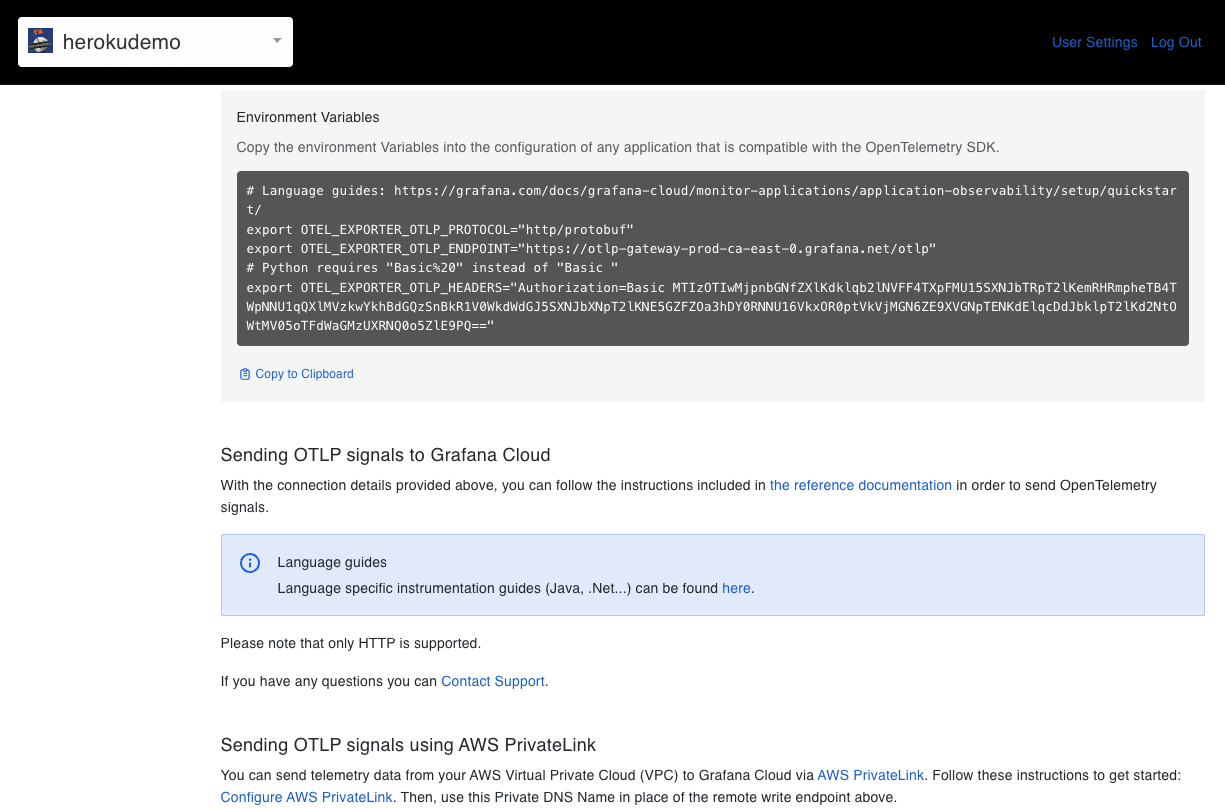
Now we can head back to our terminal window and paste environment variables. We can confirm that pasting the environment variables work by using echo quickly:
$ echo $OTEL_EXPORTER_OTLP_ENDPOINT
https://otlp-gateway-prod-ca-east-0.grafana.net/otlp

$ echo $OTEL_EXPORTER_OTLP_HEADERS
Authorization=Basic MTIzOTIwMjpnbGNfZXlKdklqb2lNVFF4TXpFMU15SXNJbTRpT2lKemRHRmpheTB4TWpNNU1qQXlMVzkwYkhBdGQzSnBkR1V0WkdWdGJ5SXNJbXNpT2lKNE5GZFZOa3hDY0RNNU16VkxOR0ptVkVjMGN6ZE9XVGNpTENKdElqcDdJbklpT2lKd2NtOWtMV05oTFdWaGMzUXRNQ0o5ZlE9PQ==
Next, we will convert the headers into a json format that the Heroku CLI command expects.
$ export HEROKU_OTLP_HEADERS="$(echo "$OTEL_EXPORTER_OTLP_HEADERS" | sed 's/^\([^=]*\)=\(.*\)$/{"\1":"\2"}/')"

$ echo $HEROKU_OTLP_HEADERS
{"Authorization":"Basic MTIzOTIwMjpnbGNfZXlKdklqb2lNVFF4TXpFMU15SXNJbTRpT2lKemRHRmpheTB4TWpNNU1qQXlMVzkwYkhBdGQzSnBkR1V0WkdWdGJ5SXNJbXNpT2lKNE5GZFZOa3hDY0RNNU16VkxOR0ptVkVjMGN6ZE9XVGNpTENKdElqcDdJbklpT2lKd2NtOWtMV05oTFdWaGMzUXRNQ0o5ZlE9PQ=="}
Finally, we can add the Heroku Telemetry Drain:
$ heroku telemetry:add --app fathomless-island-10342 $OTEL_EXPORTER_OTLP_ENDPOINT --transport http --headers "$HEROKU_OTLP_HEADERS"
successfully added drain https://otlp-gateway-prod-ca-east-0.grafana.net/otlp
Back from the Grafana Cloud dashboard, after a few minutes you will start to see some application specific metrics flowing into Grafana Cloud.

Now if you navigate back to your application in the browser (Pro Tip, use heroku open), and hit refresh a few times you should also start to see traces and logs flowing into Grafana Cloud as well.
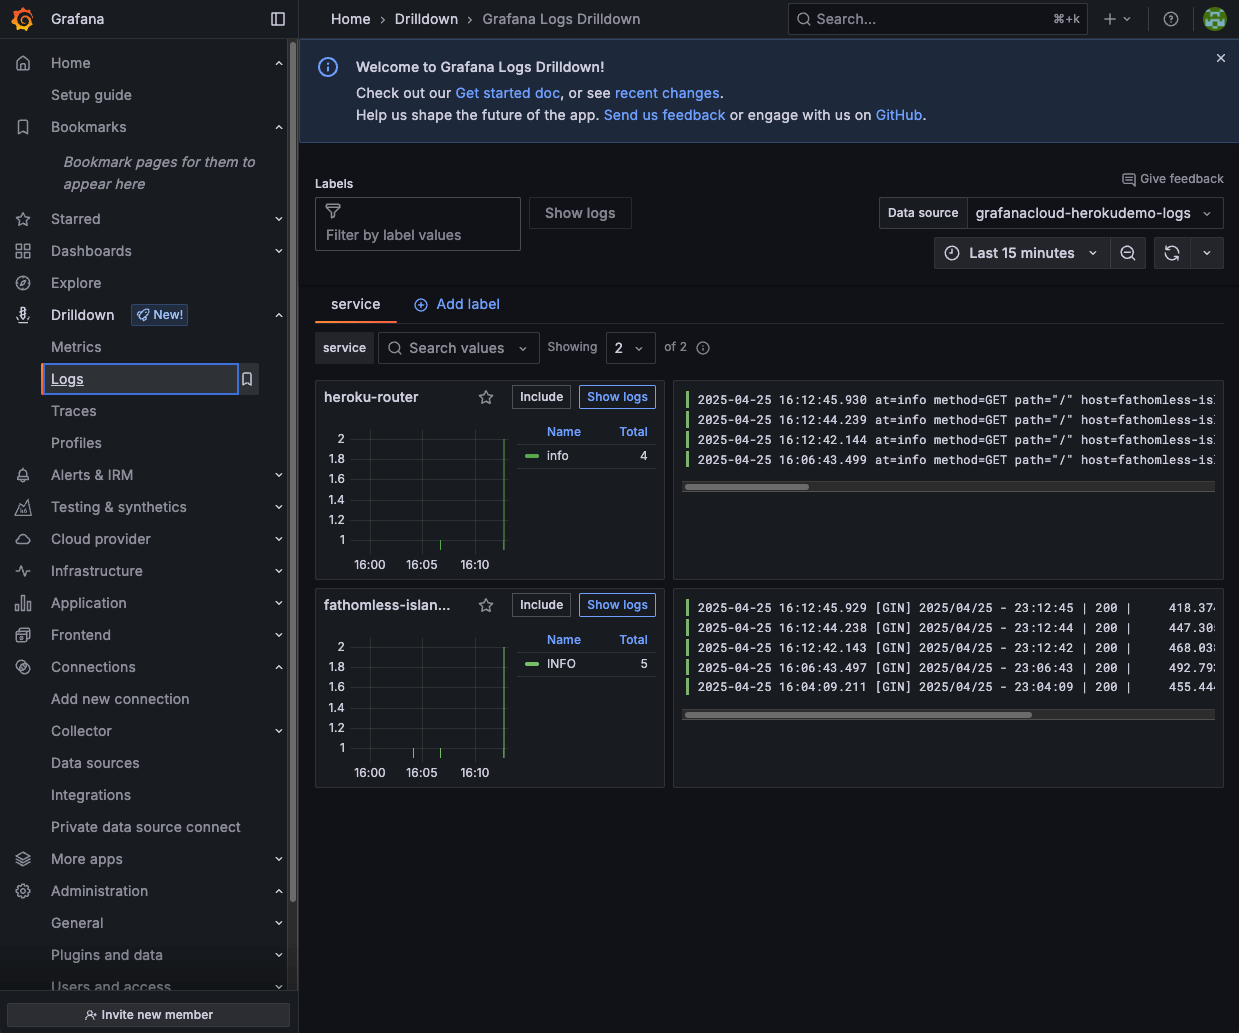
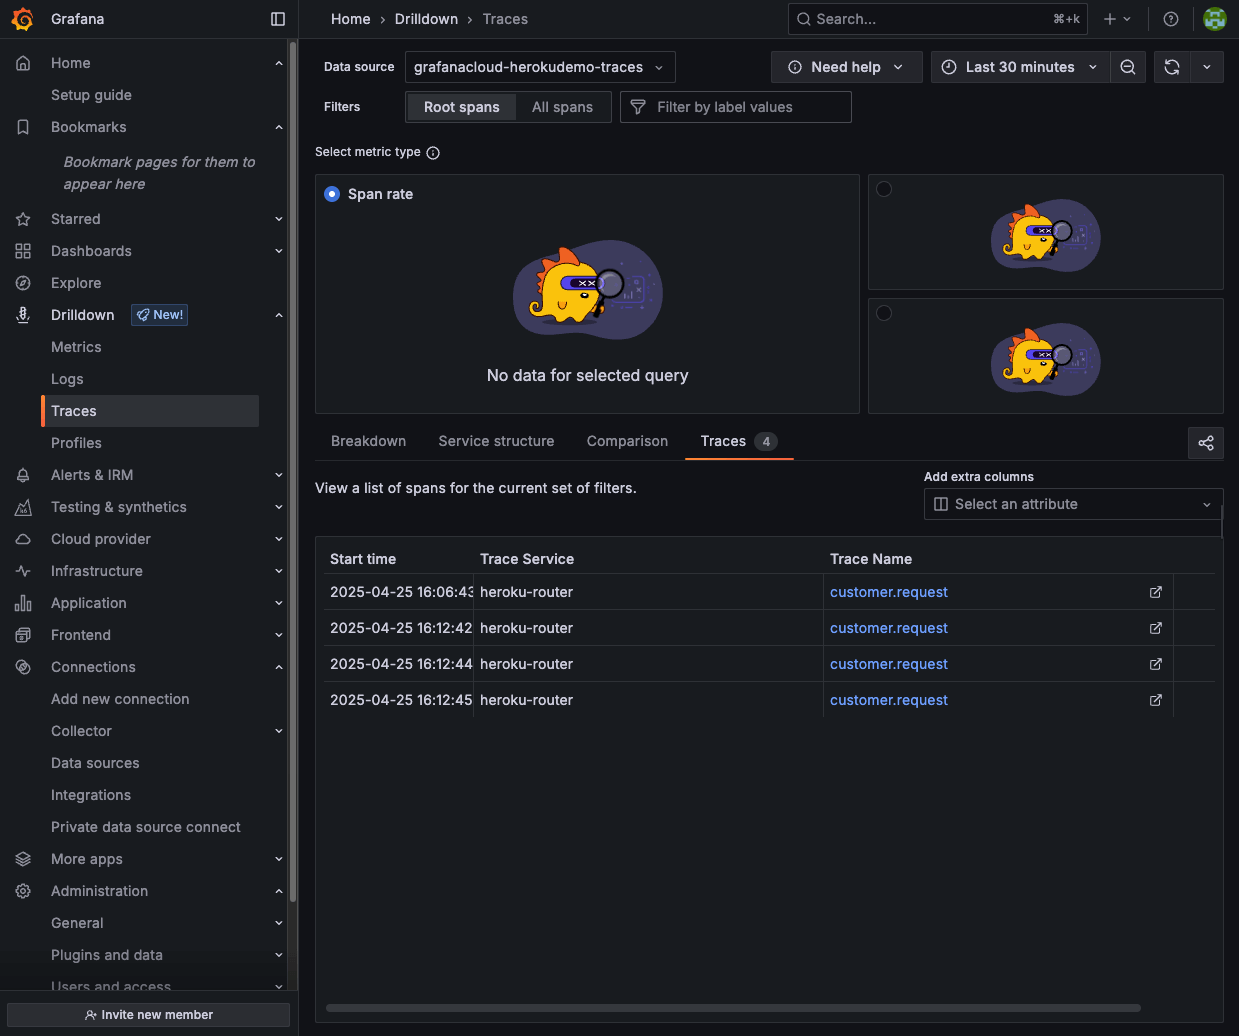
In Conclusion: Fir’s Observability Power – And Where We Go From Here
So, as we’ve shown, Heroku’s Fir platform, with its built-in OpenTelemetry, streamlines the process of setting up observability for your applications. This means you can move quickly from deploying your app to gaining critical insights into its performance, as demonstrated by the walkthrough using Grafana Cloud. But what you’ve seen here is just one of the many benefits of Heroku’s next-generation platform. In the next part of this series, we’ll dive deeper into how to effectively analyze the telemetry data you’re now collecting. We’ll explore techniques for querying, visualizing, and correlating traces, metrics, and logs to unlock powerful insights that will help you optimize your application’s behavior and troubleshoot issues like a pro.
To get the full picture of everything the Fir platform offers, from enhanced observability to a modern developer experience, don’t forget to watch the Fir launch webinar on-demand!
The post OpenTelemetry Basics on Heroku Fir appeared first on Heroku.
]]>Creating a Go/Gin application might seem straightforward: You write a few routes, connect a database, and spin up a local server. But when it comes to deploying your app, things can get tricky.…
The post Deploying a Simple Go/Gin Application on Heroku appeared first on Heroku.
]]>Creating a Go/Gin application might seem straightforward: You write a few routes, connect a database, and spin up a local server. But when it comes to deploying your app, things can get tricky. Developers unfamiliar with cloud deployment often struggle with configuring environment variables, managing dependencies, and ensuring their app runs smoothly on a hosting platform.
Fortunately, Heroku makes this process incredibly simple. With its streamlined deployment workflow and built-in support for Go, Heroku lets you deploy your Go/Gin app with minimal configuration.
In this article, we’ll walk through the process of building and deploying a Go/Gin web application on Heroku. We’ll set up a local development environment, prepare an application for deployment, and deploy it to run on Heroku. Along the way, we’ll cover best practices and troubleshooting tips to ensure a smooth deployment.
By the end of this guide, you’ll have a fully functional Go/Gin application running on Heroku—and you’ll gain the knowledge needed to deploy future projects with confidence. Let’s get started!
Setting up your development environment
To get started, you must set up your development environment. Here are the steps to install what you need and test your application locally.
An example project can be found in this GitHub repository.
Download and install Go
Download the Go installer from the official Go website, making sure you choose the correct operating system. For Windows or Linux, follow the respective installation instructions on the website.
If you’re on macOS, you can use Homebrew:
$ brew install goOnce installed, verify your installation by running:
$ go versionYou should see your Go version printed in the terminal. For this guide, we’re running version 1.24.0.
Set up your workspace
Create a new directory for your project and initialize a Go module. Open your terminal and execute:
~/project$ go mod init github.com/YOUR-USERNAME/YOUR-REPO-NAMEThis neatly organizes your project and its dependencies, ensuring everything is in order. In the examples to follow YOUR-REPO-NAME will be go-gin.
Add the Gin framework
Now it’s time to invite Gin to the party. Gin is a high-performance web framework that will help you build your REST server fast.
Run the following command to add Gin to your project:
~/project$ go get github.com/gin-gonic/ginThis fetches the Gin package and its dependencies.
The server application code goes in a file called main.go. Download that code here.
Finally, run the server:
~/project$ go run main.goTest your application locally
Before declaring your quest a success, make sure your application runs smoothly on your local machine. As you run the server as described above, you’ll see output indicating that it’s up and running.
~/project$ go run main.go

[GIN-debug] [WARNING] Creating an Engine instance with the Logger and Recovery middleware already attached.

[GIN-debug] [WARNING] Running in "debug" mode. Switch to "release" mode in production.
 - using env:	export GIN_MODE=release
 - using code:	gin.SetMode(gin.ReleaseMode)

[GIN-debug] GET    /quotes                   --> main.main.func1 (3 handlers)
[GIN-debug] GET    /quote                    --> main.main.func2 (3 handlers)
[GIN-debug] POST   /quote                    --> main.main.func3 (3 handlers)
[GIN-debug] [WARNING] You trusted all proxies, this is NOT safe. We recommend you to set a value.
Please check https://pkg.go.dev/github.com/gin-gonic/gin#readme-don-t-trust-all-proxies for details.
[GIN-debug] Listening and serving HTTP on :8080
Test your API server endpoints by sending a curl request in a separate terminal window. For example:
$ curl -s -X GET https://localhost:8080/quote | jq
{
  "quote": "The journey of a thousand miles begins with a single step."
}
(We use jq to pretty-print the JSON result.)
Creating a Heroku App
Assuming you have installed the Heroku CLI, you can create a new Heroku app. Run the following commands:
~/project$ heroku login

~/project$ heroku apps:create my-go-gin-api

Creating ⬢ my-go-gin-api... done
https://my-go-gin-api-7f40e19ce771.herokuapp.com/ | https://git.heroku.com/my-go-gin-api.git
This creates your Heroku app, accessible at the app URL (in the above example, that’s https://my-go-gin-api-7f40e19ce771.herokuapp.com/). The command also creates a Git remote so you can push your code repo to Heroku with a single command.
~/project$ git remote show heroku

* remote heroku
  Fetch URL: https://git.heroku.com/my-go-gin-api.git
  Push  URL: https://git.heroku.com/my-go-gin-api.git
You’ll also see your newly created app in your Heroku Dashboard. Clicking the Open app button will take you to your app URL.

Create the Procfile
The Procfile tells Heroku how to run your application. In your project’s root directory, create a file named Procfile (without any extension). For most simple Go applications, your Procfile will consist of a single line, like this:
web: go run main.goThis tells Heroku that your app will be a web process, and Heroku should start the process by running the command go run main.go. Simple enough! Add the file to your repository.
Tidy up your Go project
Finally, use the following command to clean up your go.mod file to ensure all dependencies are properly listed:
$ go mod tidyEnsure your go.mod and go.sum files have also been added to your repository. This allows Heroku to automatically download and manage dependencies during deployment with the Procfile.
Deploying your application
After completing these simple preparation steps, you’re ready to push your project to Heroku. Commit your changes. Then, push them to your Heroku remote.
~/project$ git add .
~/project$ git commit -m "Prepare app for Heroku deployment"
~/project$ git push heroku main
The git push command will set off a flurry of activity in your terminal, as Heroku begins building your application in preparation to run it:
…
Writing objects: 100% (26/26), 9.52 KiB | 9.52 MiB/s, done.
…
remote: Building source:
remote:
remote: -----> Building on the Heroku-24 stack
remote: -----> Determining which buildpack to use for this app
remote: -----> Go app detected
remote: -----> Fetching jq... done
remote: -----> Fetching stdlib.sh.v8... done
remote: ----->
remote:        Detected go modules via go.mod
remote: ----->
remote:        Detected Module Name: github.com/your-username/go-gin
remote: ----->
remote: -----> New Go Version, clearing old cache
remote: -----> Installing go1.24.0
remote: -----> Fetching go1.24.0.linux-amd64.tar.gz... done
remote: -----> Determining packages to install
remote: go: downloading github.com/gin-gonic/gin v1.10.0
…
remote:
remote:        Installed the following binaries:
remote:        		./bin/go-gin
remote: -----> Discovering process types
remote:        Procfile declares types -> web
remote:
remote: -----> Compressing...
remote:        Done: 6.6M
remote: -----> Launching...
remote:        Released v3
remote:        https://my-go-gin-api-7f40e19ce771.herokuapp.com/ deployed to Heroku
remote:
remote: Verifying deploy... done.
To https://git.heroku.com/my-go-gin-api.git
 * [new branch]      main -> main
This output tells you the location of the binary that Heroku built during the deploy process. In this case, it is at: ./bin/go-gin. For some Go applications, if you have trouble reaching your service and see errors in the logs, you might need to edit your Procfile to have Heroku run the binary directly, rather than using go directly with the source file. For example, your modified Procfile might look like this:
web: ./bin/go-ginTest the live application
With your Go application running on Heroku, you can test it by sending a curl request to your Heroku app URL. For example:
$ curl -s \
    -X GET https://my-go-gin-api-7f40e19ce771.herokuapp.com/quote | jq

{
  "quote": "This too shall pass."
}
To ensure everything is running smoothly after deployment, you can the following command to tail the server’s live logs:
~/project$ heroku logs --tail

…
2025-02-25T15:11:01.922123+00:00 heroku[web.1]: State changed from starting to up
2025-02-25T15:11:22.000000+00:00 app[api]: Build succeeded
2025-02-25T15:16:31.411009+00:00 app[web.1]: [GIN] 2025/02/25 - 15:16:31 | 200 |      29.199µs |   174.17.39.113 | GET      "/quote"
2025-02-25T15:16:31.411487+00:00 heroku[router]: at=info method=GET path="/quote" host=my-go-gin-api-7f40e19ce771.herokuapp.com request_id=7df071ec-9841-499f-b584-61574920e9df fwd="174.17.39.113" dyno=web.1 connect=0ms service=0ms status=200 bytes=186 protocol=https
It’s time for you to Go!
In this article, we walked through each step of creating your Go application that uses the Gin framework, from project setup to Heroku deployment. You can see the power and simplicity of combining Gin’s robust routing capabilities with Heroku’s flexible, cloud-based platform. On top of this, it’s easy to scale your applications as your needs evolve.
Explore the additional features both Heroku and Gin offer. Heroku’s extensive add-on ecosystem can boost your application’s functionality. You can also tap into advanced Gin middleware to optimize performance and strengthen security. To learn more, check out the following resources:
- Getting Started on Heroku with Go
- Heroku Go Support
- Heroku Go Buildpacks
- Heroku Add-ons
- The Gin Web Framework
- External middleware for use with Gin
The post Deploying a Simple Go/Gin Application on Heroku appeared first on Heroku.
]]>In this post, we’ll walk through what it takes to scale a SignalR app to run across multiple servers. We’ll start with the basics, then show you how to use Redis as a backplane and enable sticky sessions to keep WebSocket connections stable. And we’ll deploy it all to Heroku. If you're curious about what…
The post Scaling Real-Time SignalR Applications on Heroku appeared first on Heroku.
]]>In this post, we’ll walk through what it takes to scale a SignalR app to run across multiple servers. We’ll start with the basics, then show you how to use Redis as a backplane and enable sticky sessions to keep WebSocket connections stable. And we’ll deploy it all to Heroku. If you’re curious about what it takes to run a real-time app across multiple dynos, this guide is for you.
Introduction to our app
For my demo application, I started with Microsoft’s tutorial project on building a real-time application using SignalR, found here. Because we’re focusing on how to scale a SignalR application, we won’t spend too much time covering how to build the original application.
You can access the code used for this demo in our GitHub repository. I’ll briefly highlight a few pieces.
I used .NET 9.0 (9.0.203 at the time of writing). To start, I created a new web application:
~$ dotnet new webapp -o SignalRChat

The template "ASP.NET Core Web App (Razor Pages)" was created successfully.
This template contains technologies from parties other than Microsoft, see https://aka.ms/aspnetcore/9.0-third-party-notices for details.

Processing post-creation actions...
Restoring /home/user/SignalRChat/SignalRChat.csproj:
Restore succeeded
Then, I installed LibMan to get the JavaScript client library for our SignalR project.
~/SignalRChat$ dotnet tool install -g Microsoft.Web.LibraryManager.Cli

~/SignalRChat$ libman install @microsoft/signalr@latest \
  -p unpkg \
  -d wwwroot/js/signalr \
  --files dist/browser/signalr.js
With my dependencies in place, I created the following files:
hubs/ChatHub.cs: The hub class that serves as a high-level pipeline and handles client-server communication.Pages/Index.cshtml: The main Razor file, combining HTML and embedded C# with Razor syntax.wwwroot/js/chat.js: The chat logic for the application.
Lastly, I had the main application code in Program.cs:
using SignalRChat.Hubs;

var builder = WebApplication.CreateBuilder(args);

// Add services to the container.
builder.Services.AddRazorPages();
builder.Services.AddSignalR();

var app = builder.Build();

// Configure the HTTP request pipeline.
if (!app.Environment.IsDevelopment())
{
    app.UseExceptionHandler("/Error");
    // The default HSTS value is 30 days. You may want to change this for production scenarios, see https://aka.ms/aspnetcore-hsts.
    app.UseHsts();
}

app.UseHttpsRedirection();
app.UseStaticFiles();

app.UseRouting();

app.UseAuthorization();

app.MapRazorPages();
app.MapHub("/chatHub");

app.Run();
You’ll notice in this initial version that I’ve added SignalR, but I haven’t configured it to use a Redis backplane yet. We’ll iterate and get there soon.
For a sanity check, I tested my application.
~/SignalRChat$ dotnet build

Restore complete (0.2s)
  SignalRChat succeeded (3.1s) → bin/Debug/net9.0/SignalRChat.dll

Build succeeded in 3.7s

~/SignalRChat$ dotnet run

Using launch settings from /home/user/SignalRChat/Properties/launchSettings.json...
Building...
info: Microsoft.Hosting.Lifetime[14]
      Now listening on: https://localhost:5028
info: Microsoft.Hosting.Lifetime[0]
      Application started. Press Ctrl+C to shut down.
info: Microsoft.Hosting.Lifetime[0]
      Hosting environment: Development
info: Microsoft.Hosting.Lifetime[0]
      Content root path: /home/user/SignalRChat
In one browser, I navigated to https://localhost:5028. Then, with a different browser, I navigated to the same page.
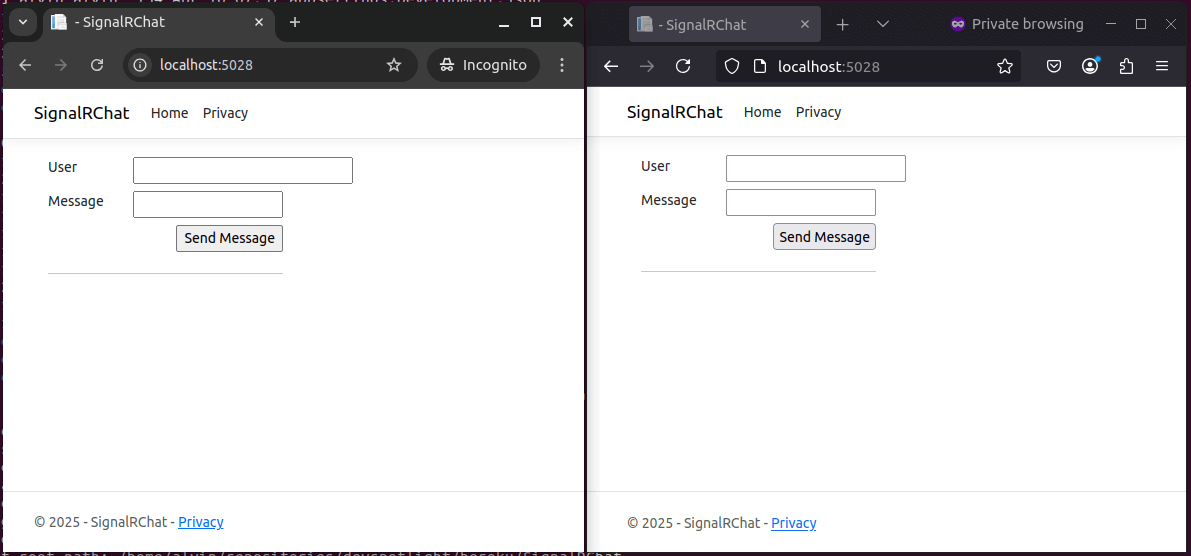
I verified that both browsers had WebSocket connections to my running application, and I posted a message from each browser.
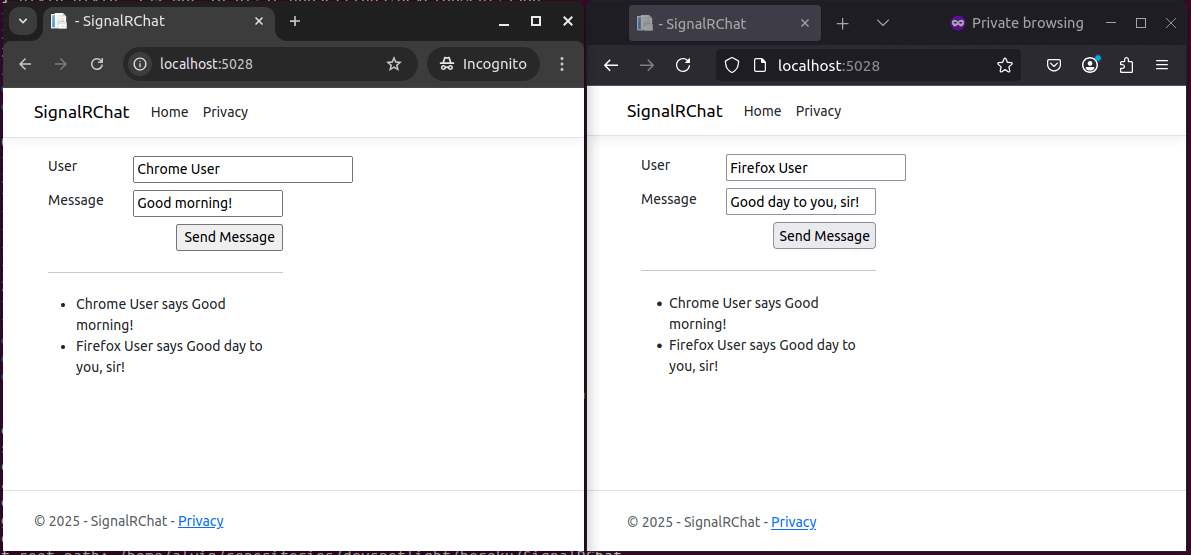
In real time, the messages posted in one browser were displayed in the other. My app was up and running.
Now, it was time to scale.
How To scale SignalR
Scaling a SignalR app isn’t as simple as just adding more servers. Out of the box, each server maintains its own list of connected clients. That means if a user is connected to server A, and a message is sent through server B, that user won’t receive it—unless there’s a mechanism to synchronize messages across all servers. This is where scaling gets tricky.
To pull this off, you need two things:
- Backplane: The backplane handles message coordination between servers. It ensures that when one instance of your app sends a message, all other instances relay that message to their connected clients. Redis is commonly used for this purpose because it’s fast, lightweight, and supported natively by SignalR.
- Sticky sessions: WebSockets are long-lived connections, and if your app is spread across multiple servers, you can’t have a user’s connection bouncing between them. Sticky sessions make sure all of a user’s requests are routed to the same server, which keeps WebSocket connections stable and prevents dropped connections during scale-out.
By combining these two techniques, you set your SignalR app up to handle real-time communication at scale. Let’s walk through how I did this.
Using Redis as a backplane
The first task in scaling up meant modifying my application to use Redis as a backplane. First, I added the StackExchange.Redis package for .NET.
~/SignalRChat$ dotnet add package \
               Microsoft.AspNetCore.SignalR.StackExchangeRedis
Then, I modified Program.cs, replacing the original builder.Services.AddSignalR(); line with the following:
var redisUrl = Environment.GetEnvironmentVariable("REDIS_URL") ?? "localhost:6379";

if (redisUrl == "localhost:6379") {
    builder.Services.AddSignalR().AddStackExchangeRedis(redisUrl, options =>
    {
        options.Configuration.ChannelPrefix = RedisChannel.Literal("SignalRChat");
        options.Configuration.Ssl = redisUrl.StartsWith("rediss://");
        options.Configuration.AbortOnConnectFail = false;
    });
} else {
    var uri = new Uri(redisUrl);
    var userInfoParts = uri.UserInfo.Split(':');
    if (userInfoParts.Length != 2)
    {
        throw new InvalidOperationException("REDIS_URL is not in the expected format ('redis://user:password@host:port')");
    }

    var configurationOptions = new ConfigurationOptions
    {
        EndPoints = { { uri.Host, uri.Port } },
        Password = userInfoParts[1],
        Ssl = true,
    };
    configurationOptions.CertificateValidation += (sender, cert, chain, errors) => true;

    builder.Services.AddSignalR(options =>
    {
        options.ClientTimeoutInterval = TimeSpan.FromSeconds(60); // default is 30
        options.KeepAliveInterval = TimeSpan.FromSeconds(15);     // default is 15
    }).AddStackExchangeRedis(redisUrl, options => {
        options.Configuration = configurationOptions;
    });
}
The above code configures the SignalR application to use Redis, connecting via a default address (localhost:6379) or through a connection string in the environment variable, REDIS_URL. Using REDIS_URL is an example of me thinking ahead, as I plan to deploy this application to Heroku with the Heroku Key-Value Store add-on.
For how to set up the Redis connection between my .NET application and my Heroku Key-Value Store add-on, I took my cues from here.
With Program.cs modified to use Redis as a backplane, I tested my application locally again.
~/SignalRChat$ dotnet run
This time, with my two browser windows open, I also opened a terminal and connected to my local Redis instance, running on port 6379. I listed the Pub/Sub channels and then subscribed to the main ChatHub channel.
127.0.0.1:6379> pubsub channels

1) "SignalRChat__Booksleeve_MasterChanged"
2) "SignalRChatSignalRChat.Hubs.ChatHub:internal:ack:demo_b3204c22a84c9"
3) "SignalRChatSignalRChat.Hubs.ChatHub:internal:return:demo_b3204c22a84c9"
4) "SignalRChatSignalRChat.Hubs.ChatHub:all"
5) "SignalRChatSignalRChat.Hubs.ChatHub:internal:groups"

127.0.0.1:6379> subscribe SignalRChatSignalRChat.Hubs.ChatHub:all

Reading messages... (press Ctrl-C to quit)
1) "subscribe"
2) "SignalRChatSignalRChat.Hubs.ChatHub:all"
3) (integer) 1
In one browser, I sent a message. Then, in the other, I sent a reply. Here’s what came across in my Redis CLI:
1) "message"
2) "SignalRChatSignalRChat.Hubs.ChatHub:all"
3) "\x92\x90\x81\xa4json\xc4W{\"type\":1,\"target\":\"ReceiveMessage\",\"arguments\":[\"Chrome User\",\"This is my message.\"]}\x1e"
1) "message"
2) "SignalRChatSignalRChat.Hubs.ChatHub:all"
3) "\x92\x90\x81\xa4json\xc4Y{\"type\":1,\"target\":\"ReceiveMessage\",\"arguments\":[\"Firefox User\",\"And this is a reply.\"]}\x1e"
I successfully verified that my SignalR application was using Redis as its backplane. Scaling task one of two was complete!
Moving onto sticky sessions, I would need to scale. For that, I needed to deploy to Heroku.
Deploying to Heroku
Deploying my Redis-backed application to Heroku was straightforward. Here were the steps:
Step #1: Login
~/SignalRChat$ heroku login
Step #2: Create app
~/SignalRChat$ heroku create signalr-chat-demo

Creating ⬢ signalr-chat-demo... done
https://signalr-chat-demo-b49ac4212f6d.herokuapp.com/ | https://git.heroku.com/signalr-chat-demo.git
Step #3: Add the Heroku Key-Value Store add-on
~/SignalRChat$ heroku addons:add heroku-redis

Creating heroku-redis on ⬢ signalr-chat-demo... ~$0.004/hour (max $3/month)
Your add-on should be available in a few minutes.
! WARNING: Data stored in essential plans on Heroku Redis are not persisted.
redis-solid-16630 is being created in the background. The app will restart when complete...
Use heroku addons:info redis-solid-16630 to check creation progress
Use heroku addons:docs heroku-redis to view documentation
I waited a few minutes for Heroku to create my add-on. After this was completed, I had access to REDIS_URL.
~/SignalRChat$ heroku config

=== signalr-chat-demo Config Vars

REDIS_URL: rediss://:pcbcd9558e402ff2615a4484ac5ca9ac373f811e53bcb17f81ada3c243f8a11cc@ec2-52-20-254-181.compute-1.amazonaws.com:8150
Step #4: Add a Procfile
Next, I added a file called Procfile to my root project folder. The Procfile tells Heroku how to start up my app. It has one line:
web: cd bin/publish; ./SignalRChat --urls https://*:$PORT
Step #5: Push code to Heroku
~/SignalRChat$ git push heroku main
…
remote: -----> Building on the Heroku-24 stack
remote: -----> Using buildpack: heroku/dotnet
remote: -----> .NET app detected
remote: -----> SDK version detection
remote:        Detected .NET project: `/tmp/build_ad246347/SignalRChat.csproj`
remote:        Inferring version requirement from `/tmp/build_ad246347/SignalRChat.csproj`
remote:        Detected version requirement: `^9.0`
remote:        Resolved .NET SDK version `9.0.203` (linux-amd64)
remote: -----> SDK installation
remote:        Downloading SDK from https://builds.dotnet.microsoft.com/dotnet/Sdk/9.0.203/dotnet-sdk-9.0.203-linux-x64.tar.gz ... (0.7s)
remote:        Verifying SDK checksum
remote:        Installing SDK
remote: -----> Publish app
…
remote: -----> Launching...
remote:        Released v4
remote:        https://signalr-chat-demo-b49ac4212f6d.herokuapp.com/ deployed to Heroku
remote:
remote: Verifying deploy... done.
Step #6: Test Heroku app
In my two browser windows, I navigated to my Heroku app URL (in my case, https://signalr-chat-demo-b49ac4212f6d.herokuapp.com/) and tested sending messages to the chat.

I also had a terminal window open, connecting to my Heroku Key-Value Store add-on via heroku redis:cli. Just like I did when testing locally, I subscribed to the main chat channel. As I sent messages, they came across in Redis.
redis:8150> subscribe SignalRChat.Hubs.ChatHub:all
1) subscribe
2) SignalRChat.Hubs.ChatHub:all
3) 2
redis:8150> 1) message
2) SignalRChat.Hubs.ChatHub:all
3) ''''json'R{"type":1,"target":"ReceiveMessage","arguments":["Chrome User","I'm on Heroku!"]}
redis:8150> 1) message
2) SignalRChat.Hubs.ChatHub:all
3) ''''json'M{"type":1,"target":"ReceiveMessage","arguments":["Firefox User","So am I!"]}
As another sanity check, I looked in my developer tools console in my browser. Looking in the Network Inspector, I saw a stable WebSocket connection (wss://) as well as the inbound and outbound connection data.

I had successfully deployed to Heroku, using Redis as my backplane. I hadn’t scaled up to multiple dynos just yet, but everything was looking smooth so far.
Scaling with Multiple Dynos
Next, I needed to scale up to use multiple dynos. With Heroku, this is simple. However, you can’t scale up with Eco or Basic dynos. So, I needed to change my dyno type to the next level up: standard-1x.
~/SignalRChat$ heroku ps:type web=standard-1x

Scaling dynos on signalr-chat-demo... done
=== Process Types

 Type Size        Qty Cost/hour Max cost/month
 ──── ─────────── ─── ───────── ──────────────
 web  Standard-1X 1   ~$0.035   $25

=== Dyno Totals

 Type        Total
 ─────────── ─────
 Standard-1X 1
With my dyno type set, I could scale up to use multiple dynos. I went with three.
~/SignalRChat$ heroku ps:scale web=3
Scaling dynos... done, now running web at 3:Standard-1X
Maintaining WebSocket Connections with Sticky Sessions
I reloaded the application in my browser. Now, my inspector console showed an issue:
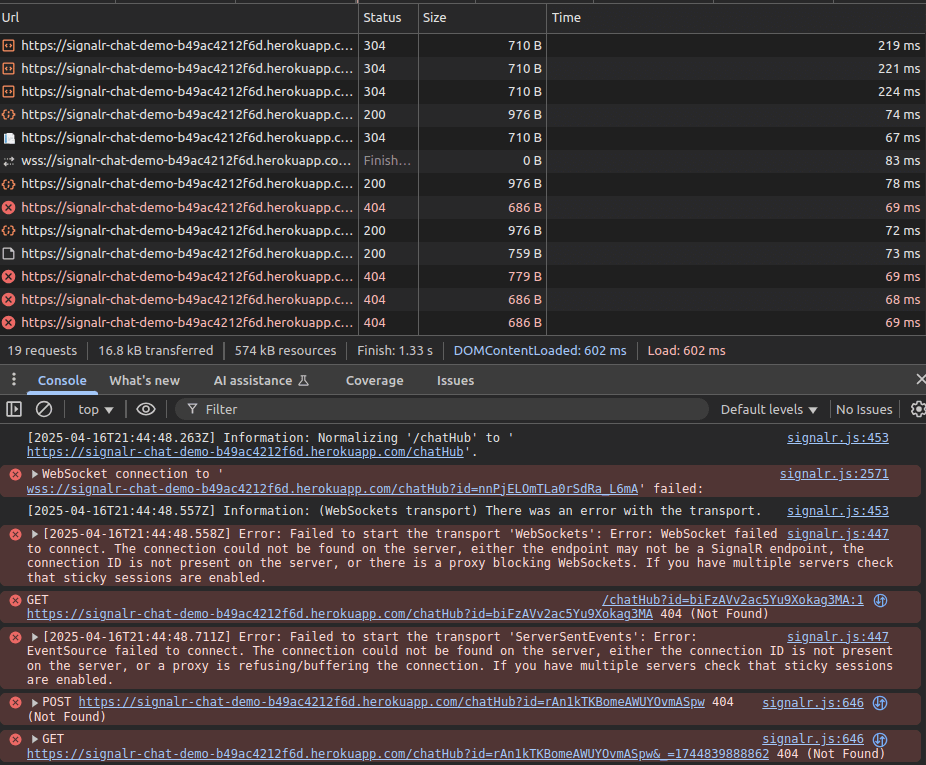
Here’s the error:
Error: Failed to start the transport 'WebSockets': Error: WebSocket failed to connect. The connection could not be found on the server, either the endpoint may not be a SignalR endpoint, the connection ID is not present on the server, or there is a proxy blocking WebSockets. If you have multiple servers check that sticky sessions are enabled.
That’s a pretty helpful error message. Just as we had expected, our real-time SignalR application would run into issues once we scaled up to multiple dynos. What was the solution? Sticky sessions with Heroku’s session affinity feature.
Enabling Heroku session affinity
This feature from Heroku works to keep all HTTP requests coming from a client consistently routed to a single dyno. It’s easy to set up, and it would solve our multi-dyno WebSocket connection issue.
~/SignalRChat$ heroku features:enable http-session-affinity

Enabling http-session-affinity for ⬢ signalr-chat-demo... done
That was it. With sticky sessions enabled, I was ready to test again.
Testing with sticky sessions on multiple dynos
I reloaded the application in both browsers. This time, my network inspector showed no errors. It looked like I had a stable WebSocket connection.
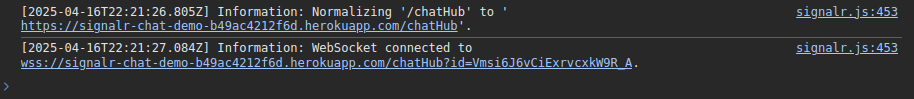
Real-time chat messages were sent and received without any problems.
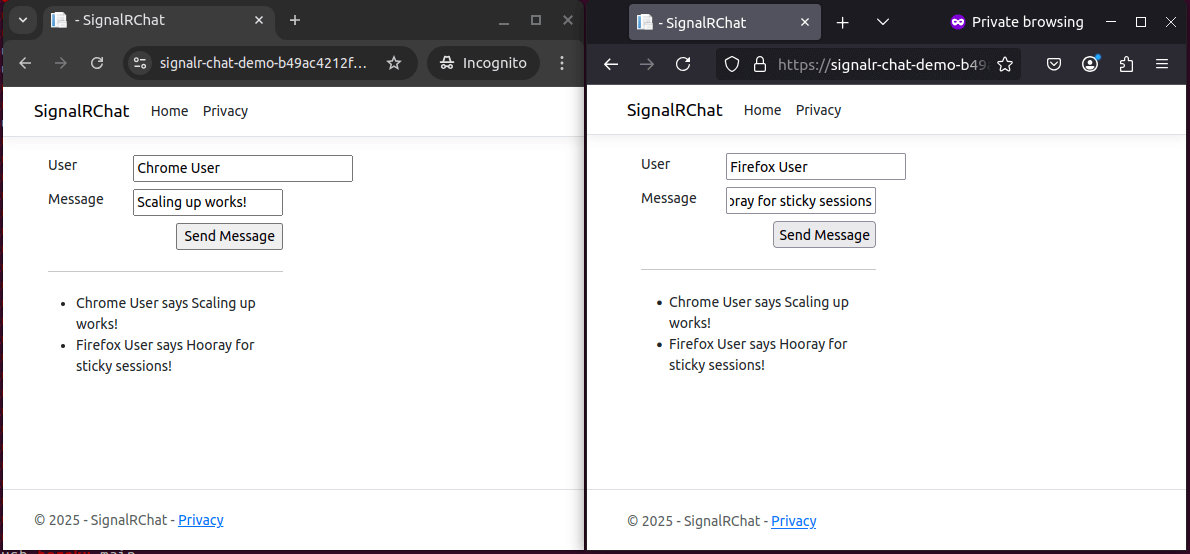
Success!
Wrapping Up
With Redis as a backplane and sticky sessions enabled, our SignalR app scaled seamlessly across multiple dynos on Heroku. It delivered real-time messages smoothly, and the WebSocket connections remained stable even under a scaled-out setup.
The takeaway? You don’t need a complicated setup to scale SignalR, just the right combination of tooling and configuration. Whether you’re building chat apps, live dashboards, or collaborative tools, you now have a tested approach to scale real-time experiences with confidence.
Ready to build and deploy your own scalable SignalR application? Check out the .NET Getting Started guide for foundational knowledge. For a visual walkthrough of deploying .NET applications to Heroku, watch our Deploying .NET Applications on Heroku video.
The post Scaling Real-Time SignalR Applications on Heroku appeared first on Heroku.
]]>At Salesforce, we are helping our customers bring their agentic strategy to life with Heroku, Agentforce , and Data Cloud . These powerful products…
The post Heroku AI: Managed Inference and Agents is now Generally Available appeared first on Heroku.
]]>At Salesforce, we are helping our customers bring their agentic strategy to life with Heroku, Agentforce, and Data Cloud. These powerful products allow anyone in the company, from business analysts to developers to build robust, custom agents that can transform their business. Behind the scenes, developers offload complex decisions, automate tasks, and compose intelligent applications using large language models and tool execution flows. Together, these AI-powered primitives are becoming a key complement to traditional application development, enabling a new wave of developer capabilities.
Heroku Managed Inference and Agents bring together a set of powerful primitives that make it simple for developers to build, scale, and operate AI-powered features and applications, without the heavy lifting of managing their own AI infrastructure. With access to leading models from top providers and elegant primitives for building agents that can reason, act, and call tools, developers can focus on delivering differentiated experiences for their users, rather than wrangling inference infrastructure or orchestration logic.
Managed Inference for simplified AI integration
Managed Inference provides ready-to-use access to a curated set of powerful AI models, chosen for their generative power and performance, optimized for ease of use and efficacy in the domains our customers need most. Whether you’re looking to generate text, classify content, summarize documents, or build intelligent workflows, you can now bring AI to your Heroku apps in seconds.
Getting started is as easy as attaching the Heroku Managed Inference and Agents add-on to your app or running: heroku ai:models:create
Agents with Model Context Protocol
Extend Managed Inference with an elegant set of primitives and operations, allowing developers to create agents that can execute code in Heroku’s trusted Dynos, as well as call tools and application logic. These capabilities allow agents to act on behalf of the customer, and to extend both application logic and platform capabilities. Allowing developers to interleave application code, calls to AI, execute logic created by AI, and use of tools, all within the programmatic context. Heroku Managed Inference and Agents can now do more than just generate, it can reason, act, and build by adapting to context, and evolving with your users’ needs.
Heroku Managed Inference and Agents uses the Model Context protocol (MCP) to give your agents new capabilities. MCP helps you build agents and complex workflows by standardizing the way you can provide context and integrate tools. This means you can expose your app’s logic, APIs or custom tools to agents such as Agentforce, Claude or Cursor with custom code.
Heroku Managed Inference and Agents currently supports STDIO MCP servers. Attaching your MCP servers is as simple as attaching your add-on to your Heroku app which contains the MCP server. We are actively developing platform capabilities to support remote MCP servers hosted on heroku, which will feature OAuth integration and buildpack capabilities.

What’s next
Heroku Managed Inference and Agents marks a major milestone on our journey to provide AI-native capabilities on the platform and we’ve designed it with the graceful developer and operator experiences you’ve come to expect. Combined with MCP Server support, AppLink for Agentforce integration, and an evolving selection of curated models and tools, developers will be able to rapidly integrate the latest AI advancements and create next-generation, intelligent user experiences.
Again, to get started, provision Managed Inference and Agents from Heroku Elements or via the command line. We are excited to see what you build with Heroku Managed Inference and Agents! Attend our webinar on May 28 to see a demo and get your questions answered!
To learn more about Heroku AI, check out our Dev Center docs and try it out for yourself.
Interested in unlocking the full potential of your AI agents? Read Heroku AI: Build and Deploy Enterprise Grade MCP Servers.
Stay tuned for more — we’re just getting started.
The post Heroku AI: Managed Inference and Agents is now Generally Available appeared first on Heroku.
]]>MCP is an open protocol that standardizes how applications provide context to LLMs. Think of MCP like a USB-C port for AI applications. Just as USB-C provides a standardized way to connect your devices to various peripherals and accessories, MCP provides a standardized way to connect AI models to different data sources and tools.
The post Heroku AI: Build and Deploy Enterprise Grade MCP Servers appeared first on Heroku.
]]>MCP is an open protocol that standardizes how applications provide context to LLMs. Think of MCP like a USB-C port for AI applications. Just as USB-C provides a standardized way to connect your devices to various peripherals and accessories, MCP provides a standardized way to connect AI models to different data sources and tools.
Heroku Managed Inference and Agents dramatically simplifies hosting these MCP servers and making them available, not only to itself, but also to external agents like Claude, Cursor, or Agentforce. These new capabilities accelerate industry standardization towards agent interoperability by reducing the infrastructure, security, and discovery challenges in building and running MCP servers. Heroku Managed Inference and Agents provides:
- Community SDK support: Build your servers using the official MCP SDK, or any other MCP SDK of your choice.
- Effortless Management: Once you have a server running, set up your Procfile and push to Heroku. The Managed Inference and Agents add-on automatically manages server registration with the MCP Toolkit.
- Unified Endpoint: Managed Inference and Agents automatically has access to all registered servers. Additionally, a MCP Toolkit URL is generated, which can be used to access your servers in external clients.
- Only Pay for What You Use: MCP servers managed by the MCP Toolkit are spun up when in use, and are spun down when there are no requests.
![]()
This guide walks you through setting up your own MCP server on Heroku and enabling your Agent to securely and efficiently perform real-world tasks.
Before getting started
MCP Servers are just like any other software application, and therefore can be deployed to Heroku as standalone apps. So while you could build your own multi-tenant SSE server and deploy it yourself, Heroku MCP Toolkits help you do things that standalone servers cannot do.
- First and foremost, they make it seamless to integrate servers with your Heroku Managed Inference and Agents.
- Secondly, they allow tools to be scaled to 0 by default, and spun up only when needed – making them more cost efficient for infrequent requests.
- Thirdly, they provide code isolation which enables secure code execution for LLM generated code.
- Finally, they wrap multiple servers in a single url making it incredibly easy to connect with external clients.
Getting started: Create and deploy your first MCP Server
- Step 1 – Build your Server
- Use an official MCP SDK to create an MCP Server. Note: At this stage, Heroku MCP Toolkits only support STDIO servers. We are working on streamlining platform support for SSE/http servers with authentication.
- MCP Servers are normal Heroku Apps built on the language of your choice. For example, if you are using node, you’ll want to follow best practices and ensure your node and npm engines are set in your package.json like you would typically for a node app on Heroku.
- Step 2 – Add the MCP process type
- Define your MCP process via Procfile with a process prefix of
mcp*. E.g.mcp-heroku: npm start(example)
- Define your MCP process via Procfile with a process prefix of
- Step 3 – Deploy your server
- Once your app is deployed, all
mcp*process types will be ready to be picked up by the Heroku Managed Inference and Agents add-on.
- Once your app is deployed, all
For more examples, take a look at the sample servers listed in our dev center documentation.
Creating an MCP Toolkit
Attach the Heroku Managed Inference and Agents add-on to the app that you just created. This will register any apps defined in the app to the MCP Toolkit. Each new Managed Inference and Agents add-on will correspond to a new MCP Toolkit.
- Navigate to Your App: Open your application’s dashboard on Heroku.
- Go to Resources: Select the “Resources” tab.
- Add Managed Inference and Agents: Search for “Managed Inference and Agents” in the add-ons section and add it to your app.
What plan to select
Each Managed Inference and Agents plan has a corresponding model (ex. Claude 3.5 Haiku or Stable Image Ultra). You should select the model that aligns with your needs. If your goal is to give your model access to MCP tools, then you will need to select one of the Claude chat models. If you have no need for a model, and only want to host MCP tools for external use, that can be done by selecting any plan. Inference usage is metered, so you will incur no cost if there is no usage of Heroku managed models.
As far as the MCP servers are concerned, you will pay for the dyno units consumed by the one-off dynos that are spun up. The cost of tool calls depends on the specific dyno tier selected for your app, but the default eco dynos, that is about .0008 cents/second. Each individual tool call is capped at 300 seconds.
If you decide to host your inference on Heroku, your inference model will have the following default tools free of charge. This includes tools like Code Execution and Document/Web Reader.
Managing and using your MCP Toolkit
The MCP Toolkit configuration can be viewed and managed through a user-friendly tab in the Heroku Managed Inference and Agents add-on. As with all add-ons, navigate to the App Resources page, and click on the Managed Inference and Agents add-on that you provisioned. Navigate to the Tools tab. Here, you will find the following information:
- The list of registered servers, and their statuses
- The list of tools per server, along with their request schemas
These tools are all available to your selected Managed Inference model with no extra configuration. Additionally, you will find the MCP Toolkit URL and MCP Toolkit Token on this page, which can be used for integration with external MCP Clients. The MCP Toolkit Token is masked by default for security.
Caution: Your MCP Toolkit Token can be used to trigger actions in your registered MCP servers, so avoid sharing it unless necessary.
For more information, check out the dev center documentation.
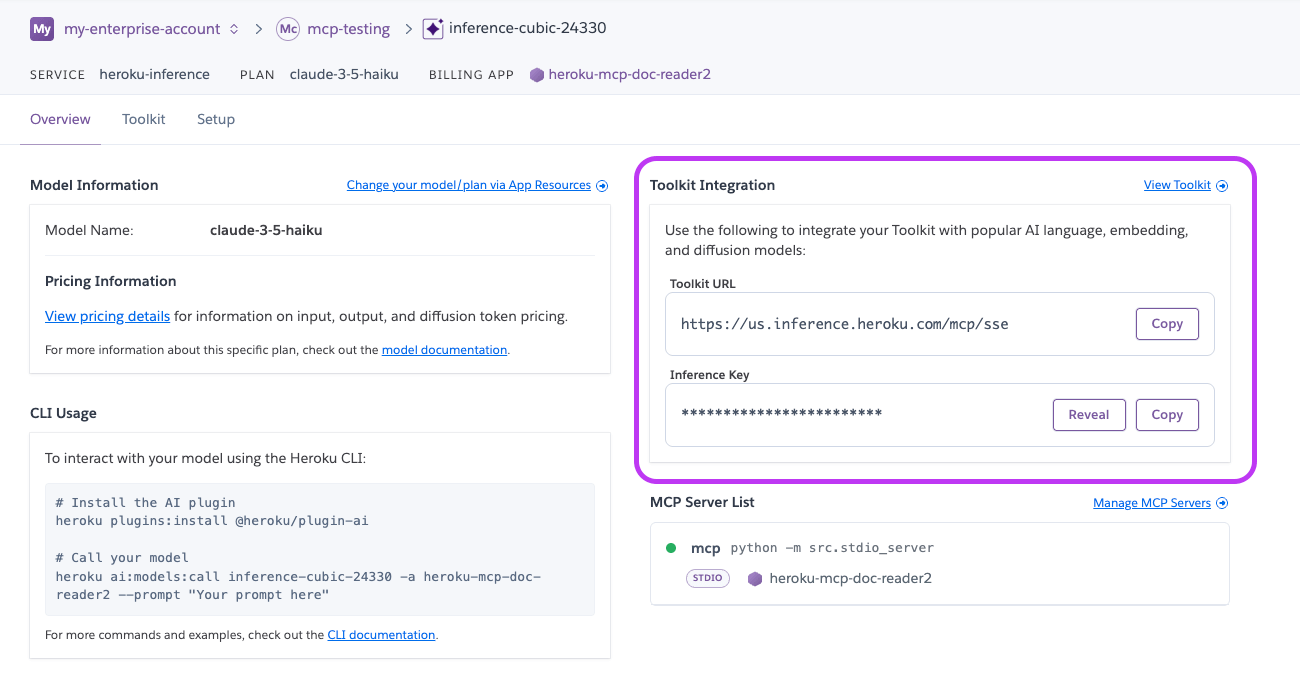
Coming soon
We are actively working on simplifying the process of building SSE/HTTP servers with auth endpoints – both for Heroku Managed Inference and Agents, and for external MCP clients. This will make it possible for servers to access user specific resources, while adhering to the recommended security standards. Additionally, we are building an in-dashboard playground for Managed Inference and Agents so you can run quick experiments with your models and tools.
We are excited to see what you build with Heroku Managed Inference and Agents and MCP on Heroku! Attend our webinar on May 28 to see a demo and get your questions answered!
The post Heroku AI: Build and Deploy Enterprise Grade MCP Servers appeared first on Heroku.
]]>Today’s distributed systems are massively complex. To develop and maintain them properly, your ability to capture, analyze, and act on log data becomes essential. You need good logging for the critical insights to help you:
Diagnose and troubleshoot issues
Rightsize cloud resources
Ensure security
In this post, we’ll explore the…
The post Optimizing Enterprise Operations with Heroku’s Advanced Logging Features appeared first on Heroku.
]]>Today’s distributed systems are massively complex. To develop and maintain them properly, your ability to capture, analyze, and act on log data becomes essential. You need good logging for the critical insights to help you:
- Diagnose and troubleshoot issues
- Rightsize cloud resources
- Ensure security
In this post, we’ll explore the importance of logging in enterprise operations and how Heroku’s advanced logging features meet the needs of modern enterprises. We’ll look specifically into features such as Private Space Logging and data residency. Then, we’ll wrap up by looking at how Heroku offers the core attributes of any robust logging solution—scalability, reliability, security, and control.
Private Space Logging: visibility for enhanced monitoring
Private Space Logging offers centralized visibility into all applications deployed within a specific Private Space. This feature provides a consolidated view of the logs for all resources and services required to run an application at scale—including databases, gateways, backend services, CDNs, and more.
In traditional logging systems, logs are dispersed across different applications and environments. Private Space Logging centralizes all the logs in an application ecosystem, making it easier for operations teams to monitor and troubleshoot issues across multiple points in the whole system. When an enterprise manages multiple applications, each composed of diverse services and stacks, quick issue identification and resolution are vital. Private Space Logging helps enterprises in this, contributing to their efficiency and reducing MTTR (Mean Time To Recovery).
Setting up Private Space Logging in Heroku is straightforward. You can quickly get up and running with Private Space Logging simply by creating a Private Space and providing a log drain URL. For example:
heroku spaces:create acme-space \
  --shield \
  --team my-team \
  --log-drain-url https://somename:somesecret@loghost.example.com/logpath
The log drain is the specific location where all the logs of a Private Space will be directed.
Private Space Logging works seamlessly with popular logging and monitoring tools, including Mezmo, SolarWinds, and New Relic. This way, organizations can get the benefits of Heroku’s centralized logging while leveraging their existing toolsets for advanced analytics, alerting, and visualization.
With Private Space Logging, enterprises enjoy simplified monitoring and troubleshooting processes. It’s an essential component for any organization looking to maintain a high level of operational efficiency and security.
Ensuring regulatory compliance with data residency
Data residency refers to the physical or geographical location where an enterprise’s data is stored and processed. For many industries—especially those in finance, healthcare, and government—complying with regional data regulations is a best practice and a legal requirement. Many countries have strict laws regarding how data is stored and processed within their borders. Failure to comply can result in severe penalties, including fines, legal action, and even the prohibition of business operations.
Heroku’s logging and data management capabilities can help enterprises ensure they meet data residency and compliance requirements. For example, when deploying applications within a Private Space, you can choose the region where the space should be located, ensuring that all data—including logs—remains within a specified geographic area. This ability lets you maintain control over where your data is stored and processed. By centralizing logs within a defined region, Heroku helps you maintain a clear and auditable trail of data access and usage. This is a key requirement for many compliance frameworks.
Centralized logging also supports organizations in meeting the transparency and reporting obligations often required by data protection regulations. The visibility and control from Heroku’s logging features simplify your process of identifying or removing logs if required by law. Also, Heroku’s Audit Trails for Enterprise Accounts can provide reports on specific events as they happened in the previous month, another useful capability for regulatory compliance.
Best practices for data residency and compliance include:
- Choosing the appropriate region for data storage: When setting up a Heroku Private Space, carefully select the region that aligns with your enterprise’s data residency requirements. This ensures that all application data and logs stay within the correct regulatory jurisdiction.
- Regular auditing of logs: Use Heroku’s logging integrations with third-party tools to review logs for compliance. Automated auditing and monitoring can help detect any anomalies or breaches in compliance.
- Removing or anonymizing sensitive information: Many regulations prohibit personal identifiable information (PII) from being generally accessible. Just as with credentials or other confidential information, PII should be excluded from logs.
- Ensuring your organization’s privacy statement includes logs: Do not overlook logs in your organization’s privacy posture.
- Ensure third-party log applications align with your privacy stance: Heroku provides easy integration with many different log processors, thoroughly vetting these partners for data residency and regulation compliance before integration.
Efficient and secure logging at scale
As applications generate more data, particularly in high-traffic situations, the ability to maintain performance while processing and storing large volumes of logs becomes essential. Heroku’s logging infrastructure leverages autoscaling systems to ensure that it can ingest, process, and store logs efficiently—no matter your scale. What does this mean for your enterprise? Even as the amount of your applications’ log data increases, the performance of the logging system remains robust, with minimal latency or degradation in service.
Maintaining security and control over log data is a fundamental aspect of Heroku’s logging features. Enterprise log data is sensitive data. Ensuring that this data is protected from unauthorized access is crucial. Heroku employs multiple layers of security to safeguard log data, including encryption, access controls, and audit trails.
Heroku’s logging system offers robust access controls, allowing your enterprise to define who can view, manage, and analyze log data. Access can be restricted based on roles, ensuring that only authorized personnel have access to sensitive logs. This is crucial for compliance with regulations that require strict control over data access, such as GDPR or HIPAA.
In addition to access controls, Heroku provides encryption for log data both at rest and in transit. Logs are encrypted using industry-standard protocols. Heroku also provides Customer Managed Keys (CMK) so that organizations have complete control over the encryption protecting their logs.
In a production environment, establishing clear log retention policies and configuring logging appropriately is crucial for both performance and compliance. Here are some recommendations:
Log retention:
- Define Clear Retention Policies: Determine how long logs should be retained based on regulatory requirements, auditing needs, and operational requirements. Different types of logs might have different retention periods. For example, security logs might need to be kept longer than application debug logs.
- Automated Log Archiving and Deletion: Implement automated processes to archive older logs to cost-effective storage and delete logs that have exceeded their retention period. This ensures compliance with data retention policies and prevents storage overload.
- Consider Log Volume and Storage Costs: Be mindful of the volume of logs generated. High-volume logging can lead to significant storage costs. Regularly review and optimize logging levels to balance the need for detailed information with storage efficiency.
Configuration recommendations:
- Log Level Management: In production, set log levels to
INFOorWARNINGto reduce verbosity and minimize log volume. AvoidDEBUGlevel logging unless actively troubleshooting a specific issue. - Structured Logging: Use structured logging formats (e.g., JSON) for easier parsing and analysis. This makes it simpler to query and filter logs.
- Log Rotation: Configure log rotation to prevent individual log files from growing too large. This ensures that logs are manageable and prevents disk space issues.
- Monitoring and Alerting: Set up monitoring and alerting on log data to detect anomalies, errors, and security incidents in real-time. Integrate logging with monitoring tools to trigger alerts based on specific log patterns.
- Regular Log Review: Periodically review logs to identify potential issues, performance bottlenecks, and security threats. This proactive approach can help prevent major incidents and improve overall system stability.
By implementing these log retention policies and configuration recommendations, enterprises can ensure efficient log management, compliance with regulations, and optimal performance in their production environments.
Key benefits of Heroku’s advanced logging features
In your enterprise operations, robust logging cannot be a backburner consideration. It’s vital to your ability to maintain your applications and adhere to data protection laws. Heroku’s advanced logging features make it possible for you to manage these important concerns:
- Centralize your logs for comprehensive visibility
- Integrate seamlessly with third-party solutions for advanced analytics.
- Control where your log data is stored and processed, to maintain compliance and meet data residency requirements.
- Scale your applications confidently, knowing that your enterprise’s applications and logging operations will remain reliable and secure.
To learn more about logging solutions for your organization, check out Heroku Enterprise or contact us today.
The post Optimizing Enterprise Operations with Heroku’s Advanced Logging Features appeared first on Heroku.
]]>The post How I Improved My Productivity with Cursor and the Heroku MCP Server appeared first on Heroku.
]]>What is Model Context Protocol?
Model Context Protocol (MCP) is an open standard from Anthropic that defines a uniform way for my AI assistant (like Cursor) to talk to external tools and data sources. Instead of juggling custom APIs or integrations, MCP wraps up both the “context” my code assistant needs (code snippets, environment state, database schema) and the “instructions” it should follow (fetch logs, run queries, deploy apps) into a single, predictable format—much like a USB‑C port lets any device plug into any charger without extra adapters, Model Context Protocol is the universal connector for your AI tools and services.
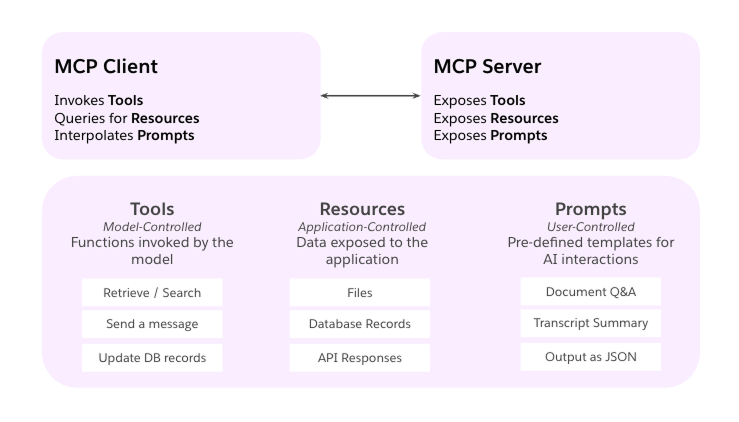
Under the hood, MCP follows a simple client–server model:
- Host: my editor or chat interface (e.g., Cursor) that decides what my assistant can access
- Client: the small bridge component that keeps a live connection open
- Server: a lightweight service exposing specific capabilities (APIs, database calls, shell commands) in MCP’s schema
When I ask Cursor to “scale my Heroku dynos” or “pull the latest customer records,” it sends an MCP request to the right server, gets back a structured response, and I can keep coding without switching contexts or writing new integration code.
AI Dev Tools I Use Everyday
When I’m not on stage presenting or behind a mic recording a podcast, I’m usually in VS Code building JavaScript demos that highlight Heroku’s capabilities and best practices. Backend work is my comfort zone, front-end and design aren’t, so I lean on AI to bridge those gaps. Given a design spec (from Figma for example), I can get a frontend prototype in minutes, instead of writing HTML/CSS at hand, making the interaction with the design team straightforward. I’ve tried Gemini for ideation, and ChatGPT and Claude for debugging and refactoring code.
Lately, though, Cursor has become my go-to IDE. Its inline LLM suggestions and agentic features let me write, test, design, and even deploy code without leaving the editor. Pairing Cursor with different MCPs means that I can remain on the IDE, it keeps me focused, cuts out needless context-switching, and helps me ship demos faster.
Here, I share a list of the MCPs I use and how they improve my productivity:
Heroku MCP Server
All my demos go straight to Heroku. With the Heroku extension for VS Code, I rarely leave my editor to manage apps. And thanks to the Heroku MCP Server, my AI assistant now deploys, scales dynos, fetches logs, and updates config, all without opening the dashboard or terminal.
To install it in your IDE, start by generating a Heroku Authorization token:
heroku authorizations:create --description "Heroku MCP IDE"Alternatively, you can generate a token in the Heroku Dashboard:
- Go to Account Settings → Applications → Authorizations and click Create new authorization.
- Copy the token you receive.
Then open your Cursor mcp.json and add the following JSON configuration with the previously generated Heroku Authorization token:
Note: Make sure you have npx installed a global command in your operative system, npx is part of Node.js.
{
  "mcpServers": {
    "heroku": {
      "command": "npx",
      "args": [
        "-y",
        "@heroku/mcp-server"
      ],
      "env": {
        "HEROKU_API_KEY": ""
      }
    },
  }
}
Check the project README for setup instructions on Claude Desktop, Zed, Cline, Windsurf, and VS Code.
LangChain MCPDoc
Many projects have started to adopt the /llms.txt file, which serves as a website index for LLMs, providing background information, guidance, and links to detailed markdown files. Cursor and other AI IDEs can use the llms.txt file to retrieve context for their tasks. The LangChain MCPDoc offers a convenient way to load llms.txt files, whether they are located remotely or locally, making them available to your agents.
Depending on the project I’m working on, I rely on this MCP to fetch documentation, especially when I’m building other MCPs, I use the recommended https://modelcontextprotocol.io/llms.txt file, or if I’m using LangChain JS to build agentic applications with Node.js, I use https://js.langchain.com/llms.txt.
I have also created my own Heroku llms.txt file, which you can download locally and use for your Heroku-related projects.
Here is how you can setup the LangChain MCPDoc in Cursor:
Note: Make sure you have uvx installed as a global command in your operative system, uvx is part of uv, a Python package manager.
{
  "mcpServers": {
    "heroku-docs-mcp": {
      "command": "uvx",
      "args": [
        "--from",
        "mcpdoc",
        "mcpdoc",
        "--urls",
        "HerokuDevCenter:file:///Users/jduque/AI/llmstxt/heroku/llms.txt",
        "--allowed-domains",
        "*",
        "--transport",
        "stdio"
      ]
    },
    "modelcontextprotocol-docs-mcp": {
      "command": "uvx",
      "args": [
        "--from",
        "mcpdoc",
        "mcpdoc",
        "--urls",
        "ModelContextProtocol:https://modelcontextprotocol.io/llms.txt",
        "--allowed-domains",
        "*",
        "--transport",
        "stdio"
      ]
    }
  }
}
Figma MCP Server
Another one of my favorites is the Figma MCP Server. It allows Cursor to download design data from Figma. I just copy and paste the link of the frame in Figma that I want to implement into my Cursor chat, and with the right prompt, it does the magic. For example, recently I had to implement our brand guidelines on a demo I’m working on, and I just pasted the frame that contains the Heroku color palette. It created a Tailwind CSS theme with the right styles. Without this tool, I’ll have to copy all the colors from the Figma file and organize them in the JSON structure as expected by Tailwind.
Here is how you can setup the Figma MCP Server in Cursor:
{
  "mcpServers": {
    "figma-mcp-server": {
      "command": "npx",
      "args": [
        "-y",
        "figma-developer-mcp",
        "--figma-api-key=",
        "--stdio"
      ]
    }
  }
}
Conclusion
Adding the Heroku MCP Server to Cursor transformed my editor into a powerful development tool. I stopped jumping between terminals, dashboards, and code. Instead, I write a prompt, and Cursor handles the rest: running queries, deploying apps, scaling dynos, or pulling logs.
This shift improved my productivity and shaved minutes off every task, cutting down on errors from running commands by memory or context-switching. More importantly, it lets me stay in flow longer, so I can focus on the parts of coding I enjoy the most.
If you’re already using Cursor or another AI coding tool, give MCP a try. Also, take a look at this quick demo where I use the Heroku MCP Server and Cursor to build and deploy a simple web app.
The post How I Improved My Productivity with Cursor and the Heroku MCP Server appeared first on Heroku.
]]>What is Heroku-Streamlit?
Heroku-Streamlit is a ready-to-deploy template that allows data scientists, analysts, and developers to quickly share their data insights through interactive web applications. With minimal configuration,…
The post Introducing Heroku-Streamlit: Seamless Data Visualization appeared first on Heroku.
]]>What is Heroku-Streamlit?
Heroku-Streamlit is a ready-to-deploy template that allows data scientists, analysts, and developers to quickly share their data insights through interactive web applications. With minimal configuration, you can transform your data scripts into engaging web applications that anyone can access.
The repository comes pre-configured with:
- One-click deployment to Heroku
- Streamlit’s powerful visualization capabilities
- Sample Uber NYC pickup data application
- Easy customization options for your own projects
Why Use Heroku-Streamlit?
For Data Scientists
- Focus on Analysis, Not Deployment: Write Python code and let Heroku handle the infrastructure
- Share Your Work Easily: Give stakeholders access to your insights through a web browser
- Interactive Presentations: Create dynamic dashboards instead of static reports
For Developers
- Rapid Prototyping: Build and deploy data applications in minutes, not days
- Simplified Workflow: Streamlined deployment process with pre-configured settings
- Customizable: Easily extend with additional Python packages
Getting Started in Minutes
Deploying your first Streamlit application on Heroku is as simple as:
- Click the “Deploy to Heroku” button in the repository
- Wait a few minutes for your app to deploy
- Access your live, interactive Streamlit application
For those who prefer a more hands-on approach, the repository includes detailed instructions for manual deployment.
Customizing Your Application
While the template comes with a sample Uber pickup visualization, you can easily customize it to showcase your own data:
- Add your Python dependencies to requirements.txt
- Update the Procfile to point to your Streamlit script
- Push your changes to Heroku
Supercharge Streamlit Apps with Heroku AI: MIA
Take your Streamlit applications to the next level by integrating Heroku Managed Inference and Agents today!
- Zero Infrastructure Management: Deploy complex LLM models without the need for servers, GPUs, or scaling
- Production-Ready Performance: Automatic scaling, high availability, and optimized inference
- Cost-Effective: Flexible pricing – only pay for what you use
Build sophisticated AI agents to:
- Create Conversational Interfaces: Add natural language chat to your Streamlit apps
- Enable Autonomous Workflows: Build agents that can process data, make decisions, and take action
The Future of Data Sharing
Heroku-Streamlit represents a step forward in sharing data insights on Heroku. By removing the barriers between data analysis and web deployment, we’re enabling more teams to make data-driven decisions through interactive applications.
We’re excited to see what you build with this template and look forward to your feedback and contributions!
Ready to get started? Visit the repository and deploy your first Streamlit app on Heroku today!
The post Introducing Heroku-Streamlit: Seamless Data Visualization appeared first on Heroku.
]]>The post How to Add the Moesif API Observability Add-On to Your Heroku Applications appeared first on Heroku.
]]>What is Heroku?
Heroku is a cloud-based Platform as a Service (PaaS) that enables developers to build, run, and scale applications entirely in the cloud. It abstracts away the complexities of infrastructure management, allowing you to focus on writing code and delivering features. Heroku supports many programming languages and frameworks, making it an excellent application development and deployment tool.
What is Moesif?
Moesif is an API analytics and monetization platform that provides deep insights into how your APIs are used and delivers the capabilities to monetize them easily. It captures detailed information about API calls, including request/response payloads, latency, errors, and user behavior. With Moesif, you can:
- Monitor API Performance: Identify bottlenecks, track error rates, and optimize response times.
- Understand User Behavior: See how users interact with your APIs, which endpoints are most popular, and what features they’re utilizing.
- Debug Issues: Quickly pinpoint the root cause of errors and resolve problems impacting your users.
- Monetize Your API: Implement usage-based billing models and track revenue generated from your API.
Benefits of Heroku and Moesif
By using the Moesif Heroku add-on, you can reduce the time to set up API Observability and ensure a seamless integration with Heroku. Billing and user management is automatically handled by Heroku which further reduces your overhead.
Why Are API Analytics Important?
If your app contains APIs, then a specialized API analytics platform must be used to truly understand how your APIs are used and what value they deliver. API analytics are essential for several reasons:
- Improved Performance: Identify and fix performance issues before they affect your users.
- Enhanced User Experience: Understand how users use your API and tailor it to their needs.
- Data-Driven Decisions: Make informed API development, pricing, and business-level decisions based on usage data.
- Increased Revenue: Monetize your API effectively by understanding usage patterns and identifying growth opportunities.
API analytics allow you to examine not only the engineering side of the puzzle but also derive a large number of business insights.
Adding Moesif to Your Heroku Application (Step-by-Step)
When using Heroku and Moesif together, the process is straightforward and can be done directly through the Heroku CLI and UI. Below, we will go through how to add Moesif to your Heroku instance, including the steps in the UI or Heroku CLI, depending on your preferred approach.
Add Via CLI
First, we will look at installing the Moesif Add-On through the CLI. For this, we assume that you:
- Have a Heroku account and an app running on Heroku
- You have the Heroku CLI installed and logged into the application you want to add Moesif to.
With these prerequisites handled, you can proceed.
Install the Add-on
Moesif can be attached to a Heroku application via the CLI:
heroku addons:create moesif
Once the command is executed, you should see something similar to the following:
-----> Adding moesif to sharp-mountain-4005... done, v18 (free)
A MOESIF_APPLICATION_ID config var is added to your Heroku app’s configuration during provisioning. It contains the write-only API token that identifies your application with Moesif. You can confirm the variable exists via the heroku config:get command:
heroku config:get MOESIF_APPLICATION_ID
This will print out your Moesif Application ID to the console, confirming it is correctly set in the config file.
Add Via UI
Alternatively, you can install the Moesif Add-On through the Heroku Dashboard UI. For this, we assume that you:
- Have a Heroku account and an app running on Heroku
- Are logged into the Heroku Dashboard for the app you’d like to add Moesif to
With these prerequisites handled, you can proceed.
Install the Add-On
While logged into the dashboard for the app you want to add Moesif to, on the Overview page, click the Configure Add-ons button.

This will then bring you to the Resources screen to view your current add-ons. In this instance, we have none. From here, click the Find more add-ons button.

On the next screen, where all available add-ons are listed, click Metrics and Analytics on the left-side menu. Locate the Moesif API Observability entry and click on it.

On the Moesif API Observability and Monetization overview page, click Install Moesif API Observability in the top-right corner.
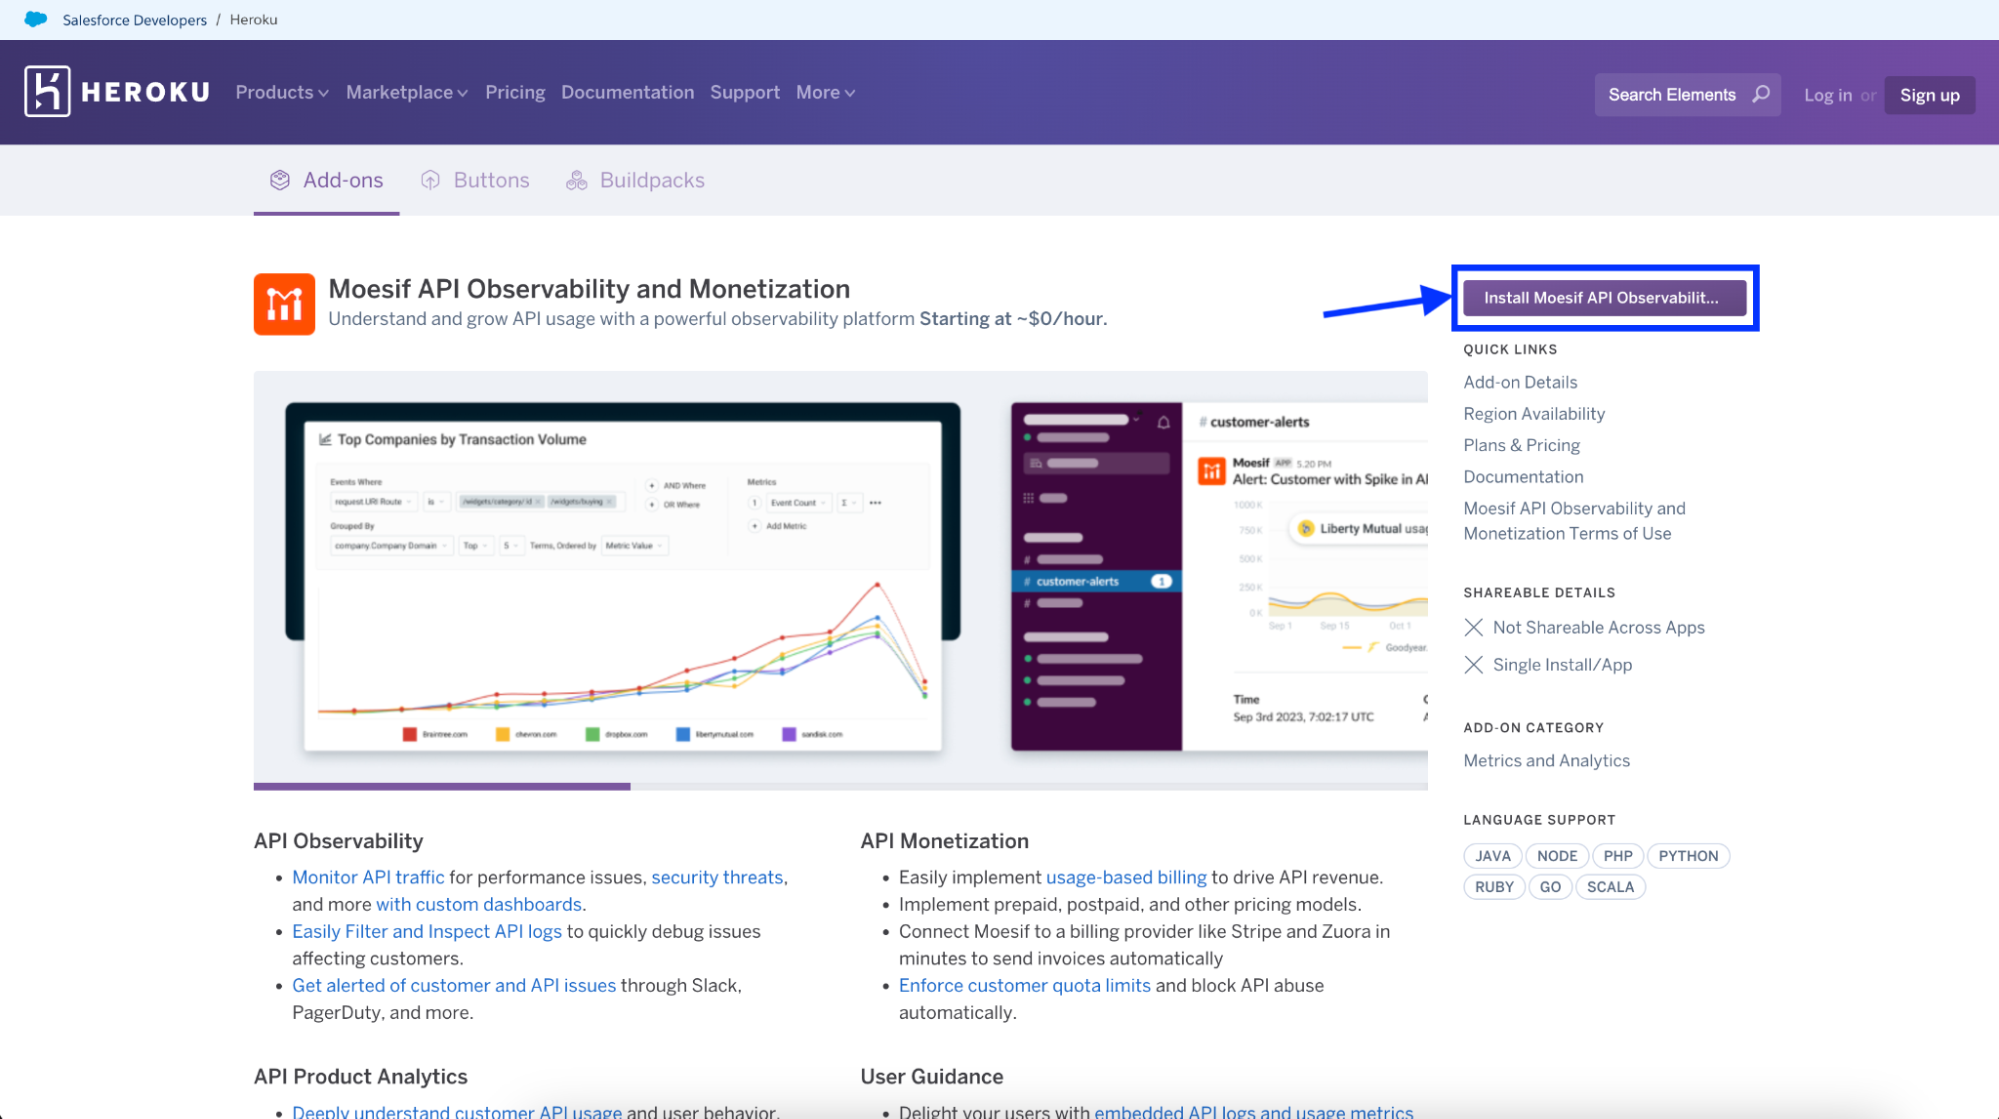
Next, you’ll be prompted to confirm the installation and submit the order. To confirm and install, click the Submit Order Form button to add Moesif to your Heroku app and activate your subscription.

Once complete, you’ll see that Moesif has been added to your Heroku instance and is ready for further configuration.

Install the server integration
With Moesif installed on our Heroku instance and subscription activated, we need to add Moesif to the application running on Heroku. To do this, go to your Heroku dashboard and open Moesif from under “Installed add-ons”

Once inside the Moesif application, the onboarding flow that appears will walk you through adding the Moesif SDK to your code.

When initializing the SDK, use the environment variable MOESIF_APPLICATION_ID for the application ID. For example, in a Node application, you’d grab the Moesif Application ID by using process.env.MOESIF_APPLICATION_ID. This would be retrieved from the app config variables.
Local setup
After you provision the add-on, you must replicate your config variables locally so your development environment can operate against the service.
Use the Heroku Local command-line tool to configure, run, and manage process types specified in your app’s Procfile. Heroku Local reads configuration variables from a .env file. To view all of your app’s config vars, type heroku config. Use the following command for each value that you want to add to your .env file:
heroku config:get MOESIF_APPLICATION_ID -s >> .env
Credentials and other sensitive values should not be committed to source control. If you’re using Git, you can exclude the .env file by adding it to the gitignore file with:
echo .env >> .gitignore
For more information, see the Heroku Local article.
Using Moesif Dashboards
Once everything is configured, events should begin to flow into Moesif. These events can be used for analytics and monetization directly within the Moesif platform.
Key Moesif Features to Leverage:
- Live Event Log: See individual API calls in real-time.
- Time Series Metrics: Track API traffic, latency, errors, and more over time.
- Funnels and Retention: Analyze user journeys through your API.
- Alerting: Get notified of critical API issues.
- Monetization: Drive revenue from your API calls using post-paid and pre-paid billing
Check out our docs and tutorials pages for all the ways you can leverage Moesif.
Open Through The Heroku CLI
To open Moesif, you can the following command cia the Heroku CLI:
heroku addons:open moesif
Or, from the Heroku Application Dashboard, select Moesif from the Add-ons menu.
Once logged in, you’ll have full access to the Moesif platform, which includes everything needed for extensive API analytics and monetization.
Try It Out
Want to try out Moesif for yourself? You can do so by following the directions above and creating an account through Heroku or sign-up directly. Powerful API analytics and monetization capabilities are just a few clicks away.
The post How to Add the Moesif API Observability Add-On to Your Heroku Applications appeared first on Heroku.
]]>The Heroku MCP server enables AI-powered applications like Claude Desktop, Cursor, and Windsurf to directly interface with Heroku, unlocking new levels of automation, efficiency, and intelligence…
The post Introducing the Official Heroku MCP Server appeared first on Heroku.
]]>The Heroku MCP server enables AI-powered applications like Claude Desktop, Cursor, and Windsurf to directly interface with Heroku, unlocking new levels of automation, efficiency, and intelligence for managing your custom applications.
How Does the Heroku MCP Server Work?
Under the hood, the Heroku MCP Server makes intelligent use of the toolchain developers already trust: the Heroku CLI. It uses the CLI as the primary engine for executing actions, ensuring consistency and benefiting from its existing command orchestration logic.
To maximize performance and responsiveness, especially for sequences of operations, the server runs the Heroku CLI in REPL (Read-Eval-Print Loop) mode. This maintains a persistent CLI process, enabling significantly faster command execution and making multi-tool operations much more efficient compared to launching a new CLI process for every action.
What Can Your Agents Do Today?
The initial release of the Heroku MCP Server focuses on core developer workflows:
- App Lifecycle Management: Empower agents to handle deploying, scaling, restarting, viewing logs, and monitoring your applications.
- Database Operations: Enable actions on your Heroku Postgres databases.
- Add-on Management: Allow agents to discover available add-ons and attach or detach resources to your apps.
- Scaling and Performance: Facilitate intelligent scaling of your application resources.
Access the full list of tools here.
Here’s How to Get Started
Authentication Setup
Generate a Heroku authorization token by using the following CLI command.
heroku authorizations:create
Copy the token and use it as your HEROKU_API_KEY in the following steps.
Configuration with MCP Clients
MCP clients maintain the MCP config file in different locations:
Add the following to the appropriate config file:
{
  "mcpServers": {
    "heroku": {
      "command": "npx -y @heroku/mcp-server",
      "env": {
        "HEROKU_API_KEY": ""
      }
    }
  }
}
Other Clients
For integration with other MCP compatible clients, please refer to the client specific config documentation.
Turbo Charge Your IDE and Agents
Heroku’s core mission has always been to simplify the complexities of app development and deployment, and a key part of that is meeting developers right where they work: inside their IDE. We’ve championed this with tools like the Heroku VS Code extension, which brings the power of the Heroku Dashboard and the versatility of the CLI directly into your AI editor like Cursor, reducing the need to switch contexts for many common tasks.
As AI-native developer workflows emerge, the friction between coding environments and cloud platforms will disappear entirely. Developers want to stay focused, leveraging AI assistance without interrupting their flow or needing deep platform-specific expertise for routine tasks.
The Heroku MCP Server builds directly on our philosophy of seamless IDE and agent integration. While the VS Code extension provides excellent visual affordances and manual control for developers, the MCP Server addresses the rise of agent-driven development. It provides an intuitive way for your agents to manage your Heroku applications, databases, and infrastructure, making it an essential part of any AI PaaS (AI Platform as a Service) strategy.
What’s Next?
This is just the beginning! We’re actively working on exposing even more of the Heroku platform’s capabilities through the MCP server. Our goal is to continuously enhance the AI-driven developer experience on Heroku, making it richer, more powerful, and even more intuitive. Stay tuned for updates as we expand the range of actions your agents can perform.
Join the Conversation
The Heroku MCP Server is just one piece of Heroku’s plan for providing an excellent AI-driven developer experience, and to provide the primitives necessary to build, manage, and scale AI applications and agents. Stay tuned for next month’s GA of our Managed Inference and Agents product, which comes complete with support for a range of MCP tools, and upcoming enhancements to broad MCP support across the platform.
The post Introducing the Official Heroku MCP Server appeared first on Heroku.
]]>In this article, we’ll cover:
What the Heroku-20 EOL means for your application.
Risks of continuing…
The post Migrating Your Ruby Apps to the Latest Stack appeared first on Heroku.
]]>In this article, we’ll cover:
What the Heroku-20 EOL means for your application.
Risks of continuing with Ruby 2.7, especially in combination with Heroku-20.
Recommendations and strategies for securely migrating your stack and Ruby version.
But first, here are the commands you can run to determine your current Heroku stack and Ruby version:
$ heroku stack --app <APP NAME>
=== ⬢ your-app-name Available Stacks

  cnb
  container
* heroku-20
  heroku-22
  heroku-24
The above command will list the available stacks and denote the current stack your application is using. If it shows heroku-20, then it’s time to consider an upgrade.
To check your Ruby version, run:
$ heroku run ruby -v --app <APP NAME>
With this information, you’ll be ready to understand your risks clearly and take the recommended migration steps outlined below.
Understanding the Heroku-20 and Ruby 2.7 EOL
Before you plan your migration, it’s crucial to clearly understand what EOL means for both your Heroku stack and your Ruby version.
Heroku-20 Stack
Heroku-20, based on Ubuntu 20.04 LTS, will reach EOL for standard support in April 2025. After this date, Ubuntu 20.04 will stop receiving regular security updates, patches, and technical support. This means any new vulnerabilities discovered after this point will not be officially addressed, significantly increasing security risks and potential compatibility issues with newer software and libraries.
Starting May 1st, 2025, builds will no longer be allowed for Heroku-20 apps.
Ruby 2.7
Ruby 2.7 reached EOL in March 2023. This means Ruby 2.7 no longer receives security patches, bug fixes, or compatibility updates. Applications using Ruby 2.7 are vulnerable to newly discovered security risks and are likely to encounter compatibility problems with other system components, such as newer versions of OpenSSL.
Additionally, Ruby 3.0 reached EOL in April 2024, and Ruby 3.1 is EOL as well. As of this writing, the latest stable Ruby version is Ruby 3.4.2.
Understanding your options and risks
Before jumping straight into a migration, you might have some questions about the implications and potential risks associated with your current stack and Ruby version. Let’s cover the common questions.
Can I continue using Ruby 2.7 on Heroku?
While it’s technically possible to run Ruby 2.7 on Heroku‑20, doing so carries significant risks. Ruby 2.7 no longer receives bug fixes or security updates, making applications vulnerable to emerging threats.
What are the risks of staying on the Heroku‑20 stack?
If you remain on Heroku-20 past its EOL in April 2025, your application environment will become increasingly insecure. You’ll no longer receive critical patches for security vulnerabilities, potentially leading to exploitation. Additionally, dependencies and libraries may become incompatible or fail to build correctly.
Can I just move off of Heroku while keeping my current Ruby version?
Even if you migrate away from Heroku, using Ruby 2.7 on an unsupported or self-managed environment still carries significant risks. Older Ruby versions that no longer receive updates may face mounting compatibility challenges with newer system components. For example, newer Ubuntu releases run OpenSSL 3.x. This will conflict with Ruby 2.7’s expectations of OpenSSL 1.1.x.
While migrating off Heroku might seem like a quick fix, the underlying issue—EOL for Ruby 2.7—remains. Even if you self-manage your infrastructure or move to another platform, you’ll still face security vulnerabilities and compatibility issues. In the long term, maintenance challenges will increase. Modern Ubuntu versions (22.04+) use OpenSSL 3.x, incompatible with Ruby 2.7, making your application more difficult and costly to maintain.
Migration Recommendations
A structured migration plan ensures a smooth transition with minimal disruption. Here are some key pointers for how to approach upgrading your Ruby and Heroku stack.
#1: Embrace Rails LTS
If you’re using Rails with Ruby 2.7, consider migrating to a Rails LTS release. This move requires upgrading both Rails and Ruby and transitioning to a supported Heroku stack (such as Heroku‑22 or Heroku‑24) that continues to receive security updates.
#2: Upgrade incrementally
Rather than overhauling your entire system at once, upgrade Rails one major version at a time—deploy and resolve issues after each change—and handle Ruby upgrades as a separate process. This approach isolates problems and helps you gradually transition toward running at least Ruby 3.2.6.
#3: Adopt the latest versions
Ultimately, your goal should be to run your application on the latest Ruby version and Heroku‑24. Newer releases offer improved performance, enhanced security, and native support for modern libraries like OpenSSL 3, reducing the risk of future compatibility issues.
#4: Consider professional upgrade services
Professional upgrade services are specialized consultants who analyze your codebase and infrastructure to create a tailored migration plan that minimizes downtime and disruption. Their expertise is especially valuable for legacy projects running on significantly outdated versions. Options include:
Keep in mind that older Rails and Ruby versions can be more challenging and costly to upgrade.
#5: Understand the ecosystem constraints
Upgrading your application stack isn’t just about Heroku—it’s about ensuring that your entire environment remains secure and maintainable. Even if you migrate off Heroku, you remain subject to the same challenges regarding security patches, build pipelines, and compatibility. It’s essential to plan so that your overall stack (Ruby, Rails, OS) stays within a supported lifecycle.
Conclusion
Given the upcoming EOL for the Heroku-20 stack and the already-passed EOL of Ruby 2.7, proactive migration is essential to maintain your application’s security, stability, and compatibility. Start your migration plan early and consider incremental upgrades to avoid disruption. Taking these steps now can prevent a last-minute scramble and ensure your application continues to benefit from the latest security and performance enhancements.
Resources
- Ubuntu lifecycle and release cadence
- Ruby 2.7.8 (Last) Release Announcement
- Heroku-20 Stack Documentation
- Heroku Guidance on “Upgrading to the Latest Stack”
- Heroku-20 End-of-Life FAQ
The post Migrating Your Ruby Apps to the Latest Stack appeared first on Heroku.
]]>As part of the Salesforce portfolio, Heroku has always been a trusted platform for building apps in any language. Our…
The post Heroku: Powering the Next Wave of Apps with AI appeared first on Heroku.
]]>As part of the Salesforce portfolio, Heroku has always been a trusted platform for building apps in any language. Our mission remains focused on helping you deliver value faster, greater reliability, and improved efficiently—all while simplifying the complexities of an ever-changing ecosystem. Our latest innovations empower developers to build custom AI apps faster, enhance existing apps with AI capabilities, and create specialized actions and experiences for AI agents in any language.
To date over 65 million apps in Ruby, .NET, Java, Python, Go, and more have launched to serve billions of requests a day that provide healthcare, sell clothing, detect bank fraud, and order car parts. The next generation of Heroku brings AI capabilities into the platform and with developer tools like Cursor, all in service of helping organizations accelerate their agentic initiatives to improve customer experience and focus on creating unique value.
What’s New: Streamlining AI and Cloud-Native Development
Heroku AppLink
Dramatically streamlines the ability to add custom actions and logic written in any language to Agentforce agents through Salesforce Flows, Apex, and Data Cloud. Agentforce is the agentic layer of the Salesforce Platform for deploying autonomous AI agents across any business function. This capability brings the ecosystem of programming languages and custom code to augment and enhance Salesforce implementations. AppLink is available today in pilot.
Heroku Eventing
Delivers a robust solution to simplify the development of event-based app architectures with a centralized hub for managing, subscribing to, and publishing events, streamlining the development process. Eventing can be used to subscribe and publish to any system including the Salesforce platform. Eventing is available in pilot.
Heroku Fir Generation
This latest version of the Heroku Platform delivers an integrated and automated experience that is resilient, secure, and performant at global scale. Built on open, cloud-native standards like Kubernetes, Open Container Initiative (OCI), and Open Telemetry; the platform now leverages AWS services including Amazon Elastic Kubernetes Service (EKS), Amazon Elastic Container Registry (ECR), AWS Global Accelerator, and AWS Graviton. Generally available later this month.
VS Code Extension
Delivers an all-in-one experience with the essential developer tools to create and manage apps within the IDE. Developers are able to be more productive in building apps and can eliminate the context switching between multiple tools. VS Code Extension is available here.
.NET Support
Enhances and expands the developer experience to include C#, Visual Basic, and F# apps using the .NET and ASP.NET Core frameworks. .NET is available here.
Heroku-Jupyter
Delivers an open-source, production-ready solution to easily spin up cloud-based Jupyter environments in minutes without the challenges of storage or complex configurations. Available open source here.
Heroku Managed Inference and Agents
Delivers a streamlined developer and operator experience in building and managing custom AI apps in any language alongside your data and AI models in one trusted environment. Heroku provides safe execution of AI generated code during agentic workflows, plus secure access to tools and resources like databases and add-ons. Heroku Managed Inference and Agents is available here.
Get Ready to Dig in
We started Heroku before Docker, Kubernetes, and in the early days of cloud to help developers deploy cloud-native apps faster and easier. Fast forward to today and AI has flipped the ecosystem on its head and the landscape is almost unrecognizable. We’re excited to introduce the next generation of the platform to accelerate the needs of cloud-native and AI app delivery at scale with the delightful developer and operator experiences you’ve come to expect from Heroku.
Learn more about Heroku – Register today to join us online Wednesday, April 30 at 1:00pm ET, to learn more about the next generation of Heroku, the platform for AI apps in any language.
The post Heroku: Powering the Next Wave of Apps with AI appeared first on Heroku.
]]>A change of this scale is not something that we take lightly. Replatforming decisions can represent a massive shift in user experience and operational processes for a single company; we need to consider the needs of the millions of apps for the thousands of companies running…
The post Heroku Fir: Dive into the New Platform Capabilities appeared first on Heroku.
]]>A change of this scale is not something that we take lightly. Replatforming decisions can represent a massive shift in user experience and operational processes for a single company; we need to consider the needs of the millions of apps for the thousands of companies running on Heroku. With Fir, we are delivering the foundation for the Next Generation of Heroku which brings the power and breadth of the cloud native ecosystem, without the complexity, and a simple, elegant user experience. Helping our customers do more with minimal disruption.
“The deployment environment was very simple and comfortable. And it was similar to the cedar generation environment.”
Team Manager, ICAN Management, Inc
If you’re looking for enhanced flexibility, scalability, and robust observability, check out what’s new with this next generation and where Heroku is headed. To explore what Fir means for you and get a firsthand look at the new platform, register for the Fir GA Webinar on April 30th 10:00AM PST / 1:00PM EST, where we’ll walk through the new capabilities and what’s coming next.
See our Demo video to see all the capabilities discussed below in action!
Build Smarter, Not Harder with Cloud Native Buildpacks
A core part of the Heroku experience has long been its ability to take idiomatic code written in nearly any major language and seamlessly turn it into a running application. The Fir generation delivers on that experience using Cloud Native Buildpacks (CNBs) as its standard build system. CNBs analyze your code and automatically build it into secure, efficient, and portable Open Container Initiative (OCI) container images, ready for deployment.

Focus on your code, not container configuration: Instead of grappling with the complexities of writing and maintaining production-ready Dockerfiles, CNBs automate the process of turning your source code into secure, optimized container images. Heroku provides and maintains open source CNBs infused with expertise for your favorite languages, handling dependencies, compilation, and optimization automatically. Leveraging CNBs means deploying to Heroku Fir remains as simple as git push heroku main, freeing you to concentrate on building great features.
Build Once, Run Anywhere: Portability is inherent with CNBs, as they create standard OCI container images. This means you can build your application once on Heroku Fir and confidently run the identical artifact anywhere OCI images are supported: on Heroku Fir, on other OCI-compliant cloud platforms, or locally with Docker. This adherence to open standards gives you deployment flexibility and minimizes vendor lock-in.
Extensible Build Primitive: While Heroku’s CNBs cover many scenarios out-of-the-box, the buildpack standard provides a powerful, safe, and composable way to extend the build process. Need support for a niche language or custom build logic? You can create your own CNB or utilize community/third-party buildpacks. These integrate with Heroku’s official buildpacks and the standard buildpack lifecycle, offering controlled customization without the pitfalls of managing complex, monolithic Dockerfiles. This standardized extensibility fosters innovation, allowing customers to tailor the platform to their unique needs.
With Cloud Native Buildpacks, Heroku Fir brings containerization within reach for every developer by combining simplicity, security, and portability, all while ensuring compatibility with the OCI ecosystem and tooling.
Deeper Insights with Integrated OpenTelemetry
Observability is paramount for maintaining the health and performance of modern applications. That’s why we’re providing OpenTelemetry (OTel) data natively on all Fir-Generation Heroku apps. This widely-adopted framework provides a standardized way to collect and export telemetry data from your applications.
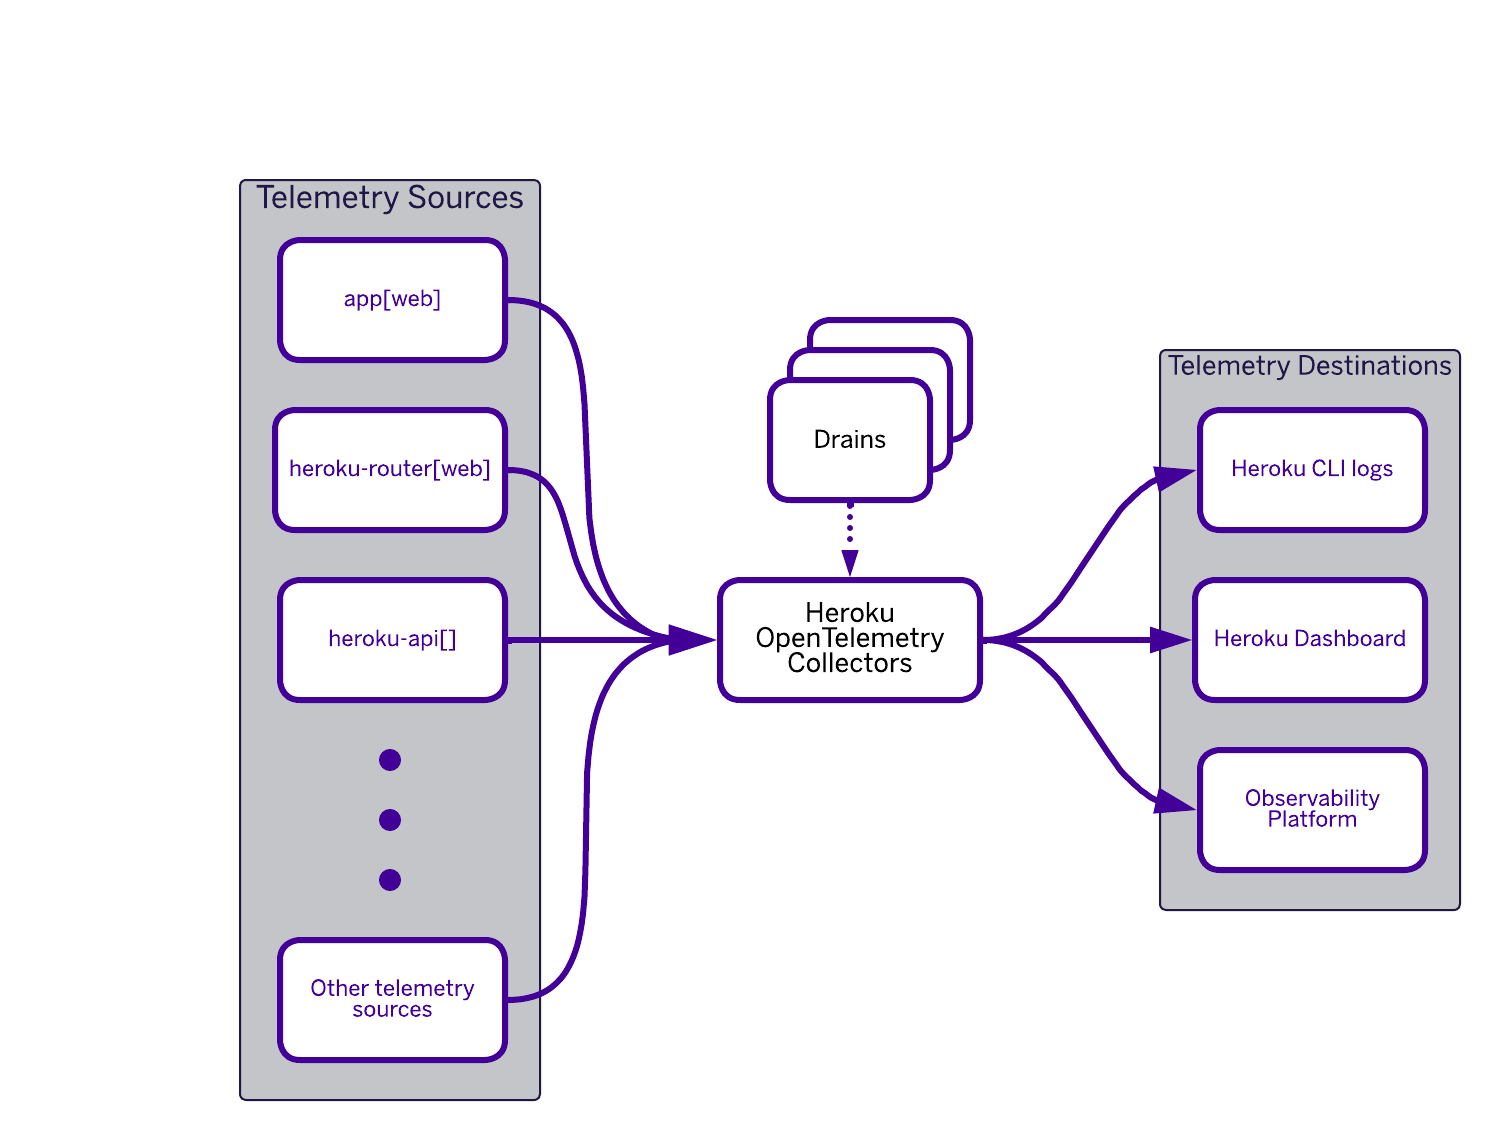
Fir streamlines the process of collecting and exporting telemetry data without extensive configuration. For an immediate, out-of-the-box view, this data automatically populates the familiar Heroku Metrics tab, providing essential insights with zero setup.
When you need to go deeper, Fir’s native support for OpenTelemetry allows you to fully utilize its core signals (traces, metrics, and logs) with upstream SDKs in your language.
Comprehensive Telemetry Signals
Comprehensive telemetry signals are fundamental to understanding, optimizing, and maintaining the health of your applications. By leveraging a combination of traces, metrics, and logs, you gain a holistic view of system behavior, enabling faster issue resolution and more informed decision-making.
Traces provide visibility into the execution path of individual requests, allowing you to pinpoint where latency occurs and identify performance bottlenecks across distributed systems. This insight is invaluable for troubleshooting complex issues, across different application architectures. From monoliths to microservices, understanding the full request path via traces is crucial for isolating problems that degrade the user experience.
Metrics offer quantitative measurements of your system’s performance and resource utilization, such as CPU load, memory usage, and request rates. These continuous data streams help you monitor overall system health, detect anomalies, and plan for scalability by forecasting capacity needs.
Logs, on the other hand, capture discrete events that reflect the inner workings of your application. They offer detailed context for debugging errors, auditing user actions, and tracking security events. OpenTelemetry embraces your existing logging solutions by automatically correlating logs with traces using injected context (like trace IDs) for easier troubleshooting across systems, and providing capabilities to standardize and enrich logs from different sources into a more unified format.
When combined, these telemetry signals provide a powerful toolkit for maintaining application reliability, enhancing security, and optimizing performance — ensuring that your systems can scale to meet evolving business demands.
Telemetry Export with Heroku Telemetry Drains
Extending Heroku’s hallmark simplicity to modern observability, Fir embraces native OpenTelemetry. Fir’s native OpenTelemetry integration makes comprehensive observability straightforward. Crucially, Heroku automatically collects platform and application telemetry (traces, metrics, logs) and seamlessly combines it with any custom instrumentation you add using standard OTel SDKs in your code. This unified stream provides a complete picture of your application’s health and performance, all in one place.
Heroku has always prioritized simplicity and ease of use for developers, and the new Heroku Telemetry tools build upon this foundation. Previously, Heroku’s log drains allowed developers to effortlessly set up and manage log streams, ensuring that critical application data was easily accessible. Now, you can see from the command below that it’s just as easy to configure app or space level telemetry drains and enable seamless transmission of all this data to your preferred observability backend and tools.
heroku telemetry:add https://telemetry.example.com --app myapp --signals traces,metrics --transport http --headers '{"x-sample-header":"sample-value"}'
Greater Flexibility with Expanded Dyno Options
One of the most significant advancements in the Fir generation is the dramatically expanded range of dyno options. Moving beyond the offerings available in previous generations, Fir provides 18 dyno options across various specifications to match resources exactly to your application’s needs.
This isn’t just about having more choices; it’s about having the right choices for your applications. You can see the full list of new dyno options in the table below or review the Technical Specifications by Dyno Size.
Precise Resource Allocation: Fir enables precise resource allocation, eliminating over-provisioning or the need to fit applications into mismatched dynos. These new granular options facilitate the fine-tuning of CPU and memory resources for applications, resulting in more efficient and cost-effective deployments.
Greater Optionality: We’ve listened to your feedback and introduced more intermediate sizes, as well as smaller options like dyno-1c-0.5gb (0.5GB RAM, 1 vCPU) and dyno-2c-1gb (1GB RAM, 2 vCPU). These brand new offerings bring greater optionality to balance your compute, memory, and cost needs.
Optimized for Diverse Workloads: Whether you’re running memory-intensive applications, compute-heavy tasks, or general-purpose web services, Fir’s diverse dyno families provide optimized configurations to meet your specific performance requirements. By offering this increased granularity, Fir empowers you to optimize your application’s performance and costs with unparalleled precision.
| Family | Dyno Type | CPU (Virtual) Cores | Memory (RAM) |
|---|---|---|---|
| Classic | dyno-1c-0.5gb | 1 | 0.5GB |
| Classic | dyno-2c-1gb | 2 | 1 GB |
| General Purpose (1 compute : 4 memory) | dyno-1c-4gb | 1 | 4 GB |
| General Purpose | dyno-2c-8gb | 2 | 8 GB |
| General Purpose | dyno-4c-16gb | 4 | 16 GB |
| General Purpose | dyno-8c-32gb | 8 | 32 GB |
| General Purpose | dyno-16c-64gb | 16 | 64 GB |
| Compute (1 compute: 2 memory) | dyno-2c-4gb | 2 | 4 GB |
| Compute | dyno-4c-8gb | 4 | 8 GB |
| Compute | dyno-8c-16gb | 8 | 16 GB |
| Compute | dyno-16c-32gb | 16 | 32 GB |
| Compute | dyno-32c-64gb | 32 | 64 GB |
| Memory (1 compute: 8 memory) | dyno-1c-8gb | 1 | 8 GB |
| Memory | dyno-2c-16gb | 2 | 16 GB |
| Memory | dyno-4c-32gb | 4 | 32 GB |
| Memory | dyno-8c-64gb | 8 | 64 GB |
| Memory | dyno-16c-128gb | 16 | 128 GB |
Enhanced Platform Data Residency
With this next generation of Heroku, our new architecture allows us to keep all data and services in the same region where our customers are running and storing their data.
All Telemetry data generated by your apps and Heroku’s infrastructure stays within your Fir Space’s region, bolstering Heroku’s data residency capabilities for our customers.
With OpenTelemetry deeply integrated into Fir, you gain valuable insights into your application’s performance with built-in support, allowing for more effective monitoring, debugging, and optimization and it all stays local to where your application is running.
Also, now that Cloud Native Buildpacks are the standard build system for our newest platform, that means that all builds are also created within the same space as where the apps and dynos will be run, and therefore will stay in the same region.
With Fir, you have granular control over how your data is stored and where it runs. In addition, you likely boost application performance by using geographical proximity to optimize data access.
Conclusion
The next generation of Heroku is here, designed with you, the developer, in mind. By offering significantly expanded dyno options, embracing the power of Cloud Native Buildpacks, and integrating robust observability with OpenTelemetry, Heroku Fir empowers you to build, deploy, scale, and monitor your applications with greater flexibility, efficiency, and confidence.
While we’re excited the next generation of Heroku is now generally available, we’re just getting started. Fir is the foundation for delivering the most highly requested Heroku features, and it will enable us to ship faster than ever before. We’re delighted to share the direction we’re heading in, starting with these roadmap items:
- Heroku AppLink for Salesforce
- Enhanced networking features including exposing apps through AWS VPC PrivateLink and AWS Transit Gateway
- Expanded isolation & sandboxing use cases, such as Fir for Multi-Tenancy
- Software supply chain security, including Software Bill of Materials (SBOMs) generation and cryptographically signed build provenance
Want to dive deeper into Fir? Join our team of experts for the Fir GA webinar on April 30th at 10:00AM PST / 1:00PM EST, where we’ll walk through the new platform and give you a sneak peek at what’s ahead.
We’re excited for you to experience the platform and see what you build with it.
The post Heroku Fir: Dive into the New Platform Capabilities appeared first on Heroku.
]]>Today, we're thrilled to announce that .NET support on Heroku, previously in beta , is now Generally Available (GA), marking a significant milestone for .NET developers on our platform. We want to thank our beta users for their invaluable feedback, which has helped us to refine and enhance the .NET experience on Heroku.
The post .NET on Heroku: Now Generally Available appeared first on Heroku.
]]>Today, we’re thrilled to announce that .NET support on Heroku, previously in beta, is now Generally Available (GA), marking a significant milestone for .NET developers on our platform. We want to thank our beta users for their invaluable feedback, which has helped us to refine and enhance the .NET experience on Heroku.
Key Benefits of .NET GA
With General Availability, .NET applications on Heroku are fully supported in production environments. This represents our long-term commitment to the .NET ecosystem, meaning you can rely on Heroku’s robust infrastructure and support services for your critical .NET workloads.
.NET joins as our 7th runtime ecosystem on the Heroku platform. Like all of our other ecosystems, what this means for .NET developers:
- You’ll have access to the latest stable version of the .NET runtime the day it’s released.
- Comprehensive documentation is available on the Heroku Dev Center, tailored specifically for .NET developers.
- Our support team is here to help with your .NET deployments, and you’re covered by Heroku’s support policy.
- You’ll have a developer experience that feels native and follows idioms familiar to .NET developers.
General Availability signifies that .NET on Heroku is production-ready, fully supported, and seamlessly integrated into the Heroku ecosystem, providing .NET developers with a first-class experience.
Built for .NET
Heroku now supports .NET, including languages like C#, F#, and Visual Basic. Heroku automatically understands, builds, and deploys your .NET applications, applying smart defaults to simplify your workflow. However, if you need more control, you can easily override these defaults to tailor the environment to your specific requirements, ensuring you can focus on coding and innovation.
.NET on Heroku includes:
- The most recent .NET SDK and runtimes are installed automatically based on your project’s
TargetFramework. You can override that using aglobal.jsonfile if needed. - ASP.NET Core apps are configured to listen on the right port by default. All executable project types, including Console and Worker Services, are detected during build. The build log shows helpful output that can easily be adapted to your own process types with Procfile for more control.
- Heroku supports framework-dependent apps by default, allowing a solution with many projects to be efficiently supported. Other deployment models, such as self-contained, ReadyToRun, and highly optimized Native AOT, are also supported out of the box.
Whether you’re working with a single project or a solution that includes multiple apps, Heroku adapts to your setup in a way that feels intuitive and natural for .NET developers.
Stay in the Flow
Beyond the core support, .NET apps plug right into the developer workflow you expect.
- Use Heroku Pipelines to manage staging and production environments.
- Run tests automatically with Heroku CI, supporting any major .NET testing framework.
- Preview pull requests with Review Apps – complete, disposable Heroku apps that spin up automatically for each GitHub PR.
- Automate tasks like database migrations with Release Phase, scale dynos instantly as demand grows, and roll back to any previously released version if something goes wrong.
With Heroku, you get a smooth, automated, and collaborative .NET development experience, allowing you to release with confidence from coding to production.
Getting Started with .NET on Heroku
Wherever you are in your .NET journey, Heroku offers a smooth path to deployment:
- New to Heroku? Head over to our .NET sign up page for more information.
- Ready to Deploy? Start with our Getting Started with .NET tutorial for a step-by-step guide.
- Already using the
heroku/dotnetbuildpack from the beta? You’re already on the GA version – no changes needed. - Need More Info? Check out the .NET Support Reference on Dev Center.
- Using a Community Buildpack? Continue to use it, or migrate to the official buildpack – migration guides are coming soon.
- Migrating from Another Platform? Reach out to Heroku Support – we’re ready to help.
The Heroku platform now offers .NET developers the performance, reliability, scalability, and ease of use they expect. Share your feedback with us on GitHub and help shape the future of .NET on Heroku!
We’re thrilled to support the .NET community and can’t wait to see what you build next.
The post .NET on Heroku: Now Generally Available appeared first on Heroku.
]]>Jupyter Notebooks provide an interactive computing environment ideal for data analysis, visualization, and machine learning. However, cloud-based Jupyter deployments often face challenges like ephemeral storage and complex server configurations. Heroku-Jupyter solves these issues by providing a streamlined cloud-based experience.
Persistent Storage for reliable, up-to-date models
Reliable Data Management…
The post Jupyter Notebooks on Heroku with Persistent Storage appeared first on Heroku.
]]>Why Jupyter on Heroku?
Jupyter Notebooks provide an interactive computing environment ideal for data analysis, visualization, and machine learning. However, cloud-based Jupyter deployments often face challenges like ephemeral storage and complex server configurations. Heroku-Jupyter solves these issues by providing a streamlined cloud-based experience.
Persistent Storage for reliable, up-to-date models
- Reliable Data Management: Your notebooks are safely stored in PostgreSQL, ensuring they remain accessible and secure across sessions.
- Data Integrity: With persistent storage, you can trust that your data and models are always up-to-date and backed up, reducing the risk of data loss.
Security First Dev Environment
- Built-in Password Protection: Protect your work with robust password authentication, ensuring that only authorized users can access your notebooks.
- Compliance and Privacy: Heroku’s security features help you meet compliance requirements and maintain data privacy, making it suitable for enterprise-level applications.
Scalability and Flexibility
- One-Click Deployment: No manual setup or infrastructure management—just deploy and start coding.
- Auto-Scaling: Heroku automatically scales your Jupyter environment to handle increased loads, ensuring your applications perform optimally under varying conditions.
- Customizable Environment: While Heroku-Jupyter comes with smart defaults, you can easily override settings to tailor the environment to your specific needs, whether you’re working on a small project or a large-scale application.
Advance AI Capabilities
By leveraging Heroku’s developer-friendly platform, Jupyter users can focus on innovation without worrying about infrastructure.
You can now supercharge your Retrieval-Augmented Generation (RAG) applications on Heroku by combining Heroku-Jupyter, pgvector, and Heroku Managed Inference and Agents.
You can use an embedding model in Heroku Managed Inference and Agents (cohere-embed-multilingual) to convert text into vector representations stored in pgvector for fast retrieval. Then, leverage an inference model in Heroku Managed Inference and Agents (claude-3-5-sonnet) to generate intelligent responses using the retrieved context.
With Heroku-Jupyter, you can easily experiment, fine-tune, and optimize your pipeline—all within Heroku’s ecosystem
A Production-Ready Jupyter Notebook Environment
A delightful developer experience is at the heart of what we do at Heroku. Heroku-Jupyter enhances your workflow through One-Click Deployment buttons. This makes it easy to get started in minutes. No need for complex configuration—just deploy and start working instantly. Once logged into your Heroku account, after clicking the Deploy to Heroku button your Jupiter Notebook will be live in minutes.
Conclusion
We’re committed to bringing Heroku, the beloved developer platform into the AI era by integrating with tools like pgvector and Heroku Managed Inference and Agents. Whether you’re a data scientist, educator, or developer, Heroku-Jupyter is designed to meet your needs and help you achieve your goals with a production-ready Jupyter Notebook environment.
We’d love your feedback! Join the open-source community on GitHub, contribute to the project, and help shape the future of Heroku-Jupyter.
The post Jupyter Notebooks on Heroku with Persistent Storage appeared first on Heroku.
]]>A Solution for GitHub IP Range Restrictions
Heroku is a powerful platform that offers robust CI/CD capabilities and secure, scalable environments for deploying applications. However, GitHub Orgs cannot be configured with Heroku IP ranges, which can be a requirement for some organizations' security rules. While this is under consideration, we want to share an alternative that leverages GitHub Actions, Heroku’s ability to…
The post Using GitHub Actions with Heroku Flow for additional Security Control appeared first on Heroku.
]]>A Solution for GitHub IP Range Restrictions
Heroku is a powerful platform that offers robust CI/CD capabilities and secure, scalable environments for deploying applications. However, GitHub Orgs cannot be configured with Heroku IP ranges, which can be a requirement for some organizations’ security rules. While this is under consideration, we want to share an alternative that leverages GitHub Actions, Heroku’s ability to run arbitrary workloads and its powerful Platform API. If you’re looking to integrate private repositories with Heroku CI/CD, need strict control over source code sharing in regulated environments, or want to explore why running a GitHub Action Runner on Heroku might be more efficient, this blog post is for you!
In this post, we will share and describe a set of repositories and configuration instructions that enable you to leverage GitHub Actions—its features, dashboard reporting, and the ability to host the GitHub Runner on Heroku—for optimal execution and secure access to your private application code, all while still within the Heroku Pipeline dashboard experience.
Keep in mind, while aspects of this solution are part of the core Heroku offering, the pattern explained in this article is provided as a sample only and the final configuration will be your responsibility. Additionally, while we have tried hard to ensure all aspects of the Heroku Flow feature work in this mode – there are some considerations to keep in mind we will share later in this blog and in the accompanying code.
What are GitHub Actions?
In short, GitHub Actions are small code snippets—typically shell scripts or Node.js—that run in response to events like commits or PR creation. You define which events trigger your actions, which can perform various tasks, primarily integrating with CI/CD systems or automating testing, scanning, and code health checks. For secure access to your deployment platform and source code, GitHub requires you to host a Docker image of their Runner component. They also require that you routinely update your runner instances within 30 days of a new release. You can read more about GitHub Actions.
Using GitHub Actions with Heroku
Heroku supports these requirements in two key ways: hosting the runner and providing access to the build and deployment platform. First, Heroku can host official Docker images just as easily as application code, eliminating the need to manage infrastructure provisioning or scaling. Second, the Heroku Platform API enables GitHub Actions to automate managing Review Apps through an existing pipeline, move code through the pipeline, and trigger deployments—all while storing source code briefly on ephemeral storage. Additionally, this setup includes automation for the mandatory 30-day upgrade window for the GitHub Runner component, reusing the above mentioned features to schedule a weekly workflow that rebuilds its Docker image and autodeploy as a Heroku app, which removes the burden of having to update it manually. The following diagram outlines the location of application source repositories, the two GitHub actions required and within Heroku the configuration to run the GitHub runner and of course application deployments created by the actions – all within a Heroku Private space.

There are two repositories we are sharing that help you accomplish the above:
- Heroku-hosted runner for GitHub Actions – This project defines a Dockerfile to run a custom Heroku-hosted runner for Github Actions (see also self-hosted runners). The runner is hosted on Heroku as a docker image via
heroku.yml. Once the self-hosted runner is running on Heroku you can start adding workflows to your private GitHub repositories to automate Heroku Review Apps creation and Heroku Apps deploy using the following action (that includes workflow examples). - Heroku Flow Action – GitHub Action to upload the source code to Heroku from a private GitHub repository using the Heroku Source Endpoint API. The uploaded code is then built to either deploy an app (on
push,workflow_dispatch, andscheduleevents) or create/update a review app (onpull_requestevents such asopened,reopened, andsynchronize). Whenever a PR branch is updated, the latest commit is deployed to the review app if existing, otherwise a new review app is created. The Review App is automatically removed when the pull request is closed (onpull_requestevents when the action is ‘closed‘). The action handles only the above mentioned events to prevent unexpected behavior, handling event-specific requirements and improving action reliability.
The README files in the above repos go into more details – but at a high level what is involved is the following steps to setup GitHub Runner in Heroku and configure the GitHub Actions:
- Identify a Private Space to run your the GitHub Runner in and resulting pipeline apps.
- Identify outbound IPs from the Private Space to be shared in your GitHub configuration.
- Deploy the GitHub Runner to the Private Space with your GitHub access token and Organization Name.
- Configure one or more private repos with the Heroku Flow Action and test by creating some PRs.
What you should see from step 4 is the following:
- A new GitHub Action is started.
- A Review App within the configured Pipeline is automatically created upon the creation of a PR.
- From the Pipeline you can follow the application build as soon as it progresses.
Advantages to using GitHub Actions with Heroku Flow
Using this approach you are able to fully leverage your Heroku investment and reuse the features that the platform already offers, such as build and deploy capabilities and compute power, without needing to use external tools or platforms. In this way, your CI/CD is fully integrated where your apps are, a close integration that allows you to unlock scenarios where you can connect your Heroku-hosted runners to resources within or attached to your Private Space (e.g. secret managers, package registries, Heroku apps …) via Private Space peering or VPN connections.
Using a Private Space is not mandatory, but it adds a layer of security and provides a static set of public IP addresses that can be configured in your GitHub Org. Moreover, Private Spaces are now available for online customers too, so both verified Heroku Teams and Heroku Enterprises can leverage such an option.
Your Heroku Flow can be improved and customized with ad-hoc steps and provide additional features such as manual and scheduled app builds and deploys via GitHub Actions “Run Workflow” and cron/scheduler.
Last, but not least, your Heroku-hosted runners’ consumption is pro-rated to the second.
This solution complements your current Heroku development environments and can be used even for non-Heroku projects, a complete and enhanced delivery workflow is at your fingertips that in the future can open to other integration scenarios (e.g. on-premise GitHub Server, GitLab, Bitbucket …), while remaining on the platform you love!
Considerations for Using GitHub Actions with Heroku Flow
Please keep the following considerations in mind as you explore this pattern and read the README files within the above repositories in detail to fully understand their value and implications. In summary, some key aspects to be aware of are as follows:
- From the Review App UI in the Heroku Pipeline, the URL used to allow easy access to the instance of the actual GitHub repository is not available in this configuration. You will instead need to relay the correct GitHub repository URL to your stakeholders in a different way.
- Heroku CI has a feature that automatically runs tests before creating Review Applications, among other features described here. In this configuration, the standard Heroku-managed Git repository is explicitly not used, and as such, tests are not run in the conventional way. If you need this capability, you could consider extending the action code to run your tests before every subsequent push to your GitHub repository.
- Currently, this configuration is not compatible with Fir, our next-generation platform version.
- While we are using the core GitHub Runner software, we are not using the standard GitHub docker images: Rather, we create a custom image for you. It is up to you to test whether other GitHub actions you have created work as expected.
Please continue to review more detailed consideration information in the README’s here and here.
Conclusion: Heroku + Github Actions Streamlines your CI/CD
GitHub Actions is a powerful tool for automating deployment pipeline tasks. Given the ability to reduce the toil of managing your own GitHub Runner instance along with the ease with which you can monitor the pipeline and let stakeholders test builds through Heroku Review Apps, we’re excited to share this pattern with our customers. As mentioned earlier, out-of-the-box support for this capability is under consideration by our product team. We invite you to share your thoughts on this roadmap item directly via commenting on the github issue. Meanwhile please feel free to fork and/or make suggestions on the above GitHub repos. We welcome your feedback, whether or not you’ve explored this approach. Finally, at Heroku, we consider feedback a gift. If you have broader ideas or suggestions, please connect with us via the Heroku GitHub roadmap.
The post Using GitHub Actions with Heroku Flow for additional Security Control appeared first on Heroku.
]]>One of the core strengths of Heroku buildpacks is their automatic nature. They intelligently detect your application's language and framework, fetching the necessary build tools and configuring the Heroku platform to run your app seamlessly. This means no more wrestling with…
The post Simplifying JVM App Development with Heroku’s Buildpack Magic appeared first on Heroku.
]]>One of the core strengths of Heroku buildpacks is their automatic nature. They intelligently detect your application’s language and framework, fetching the necessary build tools and configuring the Heroku platform to run your app seamlessly. This means no more wrestling with server configurations or deployment scripts – Heroku handles it all.

Beyond just building your application, our Java Buildpacks go a step further by understanding the nuances of different Java frameworks and tools. They automatically inject framework-specific configurations, such as database connection details for Postgres, eliminating the need for manual setup. This deep integration significantly reduces the friction of deploying complex Java applications. You don’t have to teach Heroku how to run your Spring Boot, Quarkus, or Micronaut app, and in some cases you don’t have to teach these frameworks how to interact with Heroku services either. In many cases, even a Procfile becomes optional! Let’s take a closer look at how the Java Buildpack supports these popular development frameworks.
Spring Boot Development Framework
The Maven or Gradle buildpack recognizes your Spring Boot project by inspecting your build definition, for example your pom.xml file. It automatically packages your app into an executable JAR, and configures the environment to run it using the embedded web server. It also helps out with Spring specific environment variables, ensuring your Spring Boot app behaves as expected when working with databases. Database connections are automatically configured using SPRING_ (such as SPRING_DATASOURCE_URL), so Spring automatically detects your use of the Heroku Postgres add-on. This is also true for our Heroku Key Value Store add-on, whereby the SPRING_REDIS_URL environment variable is automatically set. In many cases, a Procfile isn’t necessary since the buildpack can determine the main JAR file automatically and adds a default process for your application such as: web: java -Dserver.port=$PORT $JAVA_OPTS -jar $jarFile.
Quarkus Development Framework
We recently added support for Quarkus, known for its focus on developer joy. The Java (Maven) or Java (Gradle) buildpacks recognize your Quarkus project by inspecting your build definition. You can omit the usual Procfile and Heroku will default to Quarkus’ runner JAR automatically: java -Dquarkus.http.port=$PORT $JAVA_OPTS -jar build/quarkus-app/quarkus-run.jar.
Micronaut Development Framework
Micronaut, another framework designed for speed and efficiency, also benefits from the Java Buildpack’s intelligent automation. Just like with Spring Boot and Quarkus, database connections via DATABASE_URL and JDBC_DATABASE_URL and other environment-specific settings are handled automatically. You can omit the usual Procfile and Heroku will default to this automatically: java -Dmicronaut.server.port=$PORT $JAVA_OPTS -jar build/libs/*.jar.
Enhance Java Virtual Machine (JVM) Apps with Runtime Metrics
Heroku’s Language Runtime Metrics provide JVM metrics for your application, displayed in the Heroku Dashboard. This feature complements our existing system-level metrics by offering insights specific to your application’s execution, such as memory usage and garbage collection. These more granular metrics offer a clearer picture of your code’s behavior.
Heroku automatically configures your application to collect these metrics via a light-weight JVM agent. No configuration necessary.

Beyond Java: Heroku’s JVM Language Support
Apart from offering excellent support for building Java applications, Heroku offers support for additional JVM languages in Scala and Clojure. The buildpacks for those languages offer a similar suite of features backed by the sbt and Leiningen build tools.
Building great apps with Heroku and Java
Looking through our Heroku customer stories we can see that our customers are enjoying our Java support, building engagement apps, helping with cloud adoption and driving growth by leveraging Heroku’s ability to elastically scale compute intensive workloads.

- eCommerce Site & business platform: Improve user or employee engagement, and retention.
Customer Story: Goodshuffle Pro - Cloud Adoption: Replatforming legacy back-end services.
Customer Story: Dovetail - Engines & APIs: Project customer growth.
Customer Story: PensionBee
Extend Salesforce with Java: Heroku AppLink & Eventing
Yes, and in fact, with any language supported by Heroku, it’s possible to extend your Flow, Apex, and Agentforce experiences with code, frameworks, and tools you’re familiar with from the Java ecosystem. Even if you haven’t used Java before, you’ll find its syntax similar to that of Apex. Check out our latest Heroku Eventing and AppLink pilot samples written in Java to find out more!
Heroku Java Buildpacks: Simplifying Deployment and Configuration
Heroku’s Java buildpacks are powerful tools that significantly simplify deploying JVM applications. By automating the build process, injecting framework-specific configurations, and handling runtime setup, it lets developers focus on writing code, not managing framework configuration. Here are some useful articles the Heroku DevCenter site:
- Getting started with Java and Maven
- Getting started with Java and Gradle
- Working with Spring Boot
- Connecting to Relational Databases on Heroku with Java
To submit feedback on your favorite JVM language, framework, or packaging tool, please connect with us via the Heroku GitHub roadmap. We welcome your ideas and suggestions.
The post Simplifying JVM App Development with Heroku’s Buildpack Magic appeared first on Heroku.
]]>The process of bringing their custom apps on Heroku to their Salesforce implementations has historically been a complex and time-consuming process. To address this, we’ve introduced Heroku AppLink ,…
The post Heroku AppLink Pilot: The Shortest Path to Bring Your Code to Agentforce appeared first on Heroku.
]]>The process of bringing their custom apps on Heroku to their Salesforce implementations has historically been a complex and time-consuming process. To address this, we’ve introduced Heroku AppLink, a powerful new tool designed to streamline the integration process.
Taming the Complexity of Salesforce <-> Heroku Connections
Without a native integration solution, developers and admins face several key challenges:
- Lack of visibility – No centralized place for admin/developer to view and manage all existing connections.
- Limited discoverability – Salesforce Admins and Developers struggle to discover Heroku resources in their implementations.
- Fragmented management – No centralized way for Heroku admins to manage access and connection settings.
- Security & compliance challenges – Ensuring that Heroku services meet Salesforce’s security requirements.
These challenges slowed down development, created inefficiencies between teams, and made it harder to design solutions that fully leveraged the combined power of the Heroku platform and Salesforce Clouds.
That’s why we built Heroku AppLink.
Simplifying Integration with Heroku AppLink
Heroku AppLink, now available in pilot, makes it effortless to securely connect your Heroku applications to Agentforce, Data Cloud, and any Salesforce Cloud. AppLink is designed with long term manageability, visibility, and ease of use in mind.
Now, with a single command, teams can:
- Accelerate development by eliminating manual setup and integration tasks.
- Enhance security with a standardized integration approach and managed connections that meet Salesforce security standards.
- Boost operational efficiency with more granular environment and connection definitions.
- Enhance visibility & governance by providing a single source of truth for Heroku – Salesforce integrations and single UX for managing credentials and connections.
Key Features of Heroku AppLink
- Seamless integration: Automatically connect Heroku apps with Agentforce, Salesforce Clouds, and Data Cloud for near real-time interactions.
- Managed security: Supports three interaction modes while enforcing Salesforce user permissions for data access, and while maintaining user context.
- Flows and Apex-based invocation: Call Heroku-hosted services directly from Salesforce Flows and Apex.
- SDK templates: Use predefined SDK templates to perform DML operations on Salesforce and Data Cloud data.
- Built-in discoverability: Centralized access to Heroku services and resources.
To see Heroku AppLink in action, check out our Heroku AppLink and Eventing Demo video.
Join the Heroku AppLink Pilot
The Heroku AppLink pilot is now complete. We’ve gathered great feedback to help shape the future of Heroku integrations tools. Thank you to all the developers who participated!
Heroku AppLink and Eventing: Better Together, Like Pair Programing
We’re also piloting Heroku Eventing, which works alongside AppLink to provide real-time event streaming between Heroku and Salesforce.
- Heroku AppLink -> Best for secure, managed integrations.
- Heroku Eventing -> Best for event-driven architectures, allowing real time data flow across systems.
Together, these two new capabilities can allow developers to build more responsive and interactive applications and collaborate effectively with their Salesforce Admins.
We’re excited to bring a more connected Heroku experience to developers.
The post Heroku AppLink Pilot: The Shortest Path to Bring Your Code to Agentforce appeared first on Heroku.
]]>We’re thrilled to introduce Heroku Eventing, a powerful tool designed to help teams manage events more efficiently and securely. This new feature simplifies the process of integrating and monitoring events from various sources, ensuring a seamless and secure experience.
Simplifying Monitoring and Observability
One of the most common challenges our customers face is the need for comprehensive monitoring and observability. Traditionally, this involves manually gathering…
The post Heroku Eventing: A Router for All Your Events appeared first on Heroku.
]]>We’re thrilled to introduce Heroku Eventing, a powerful tool designed to help teams manage events more efficiently and securely. This new feature simplifies the process of integrating and monitoring events from various sources, ensuring a seamless and secure experience.
Simplifying Monitoring and Observability
One of the most common challenges our customers face is the need for comprehensive monitoring and observability. Traditionally, this involves manually gathering data from multiple systems or setting up complex, potentially insecure connections. Heroku Eventing offers a streamlined and secure solution to this problem.
With Heroku Eventing, teams can aggregate data from sources such as Salesforce, ServiceNow, New Relic, and Splunk, and view them in a unified, user-friendly interface. This integration provides a clear and accessible overview of platform performance and health metrics, making it easier to monitor and manage your applications.
What is Heroku Eventing?
Heroku Eventing is a robust tool that simplifies event-based application development on the Heroku platform. It offers a centralized hub for managing, subscribing to, and publishing events, streamlining the development process:
- Centralized Management: Manage all subscriptions and publications related to an app from a single, intuitive interface.
- Seamless Integration: Connect directly with Heroku Kafka and Postgres Database.
- Flexible Event Distribution: Push Kafka and Postgres events to subscribers, including data cloud and Salesforce Platform Events.
- Unified API: Use a single API to subscribe and publish to all events and webhooks.
- Secure Authentication: Securely store authentication credentials for all connected services.
- Compliance: Compliant with industry standards, including Cloud Events and Bloblang.
To see Heroku Eventing in action and better understand how it functions, check out this demo video.
Join the Pilot
Heroku Eventing is now available as a pilot. We’re looking for developers to try it out and give us feedback. By joining the pilot, you’ll get early access to Heroku Eventing, and your input will help shape the future of Heroku tools.
Heroku Eventing and AppLink: Better Together, Like Pair Programing
We’ve recently completed a pilot of Heroku AppLink, which works alongside Eventing to expose Heroku apps as APIs in Salesforce, so you can more easily integrate your custom apps with Salesforce.
- Heroku AppLink -> Best for secure, managed integrations.
- Heroku Eventing -> Best for event-driven architectures, allowing real time data flow across systems.
Together, these two features allow developers to build more responsive and interactive applications.
Stay tuned for more updates as we continue improving the Heroku AppLink and Eventing experience based on pilot feedback.
We’re excited to bring a more connected Heroku experience to developers.
The post Heroku Eventing: A Router for All Your Events appeared first on Heroku.
]]>Visual Studio Code (VS Code) is one of the most popular code editors, loved by developers for its extensibility, lightweight…
The post Heroku Extension for Visual Studio Code (VS Code) Now Generally Available appeared first on Heroku.
]]>Why Visual Studio Code?
Visual Studio Code (VS Code) is one of the most popular code editors, loved by developers for its extensibility, lightweight design, and robust ecosystem of extensions. Given its widespread adoption, we built the Heroku Extension to integrate seamlessly with VS Code, enabling developers to manage their Heroku apps without interrupting their flow.
Many modern AI-powered code editors, such as Windsurf and Cursor, are forks of VS Code, leveraging its powerful architecture while incorporating AI-driven capabilities. Because our extension is built for VS Code, it’s automatically compatible with these AI code editors, allowing developers to use Heroku’s platform insights and management tools in their preferred environments.
For Salesforce developers, this extension is fully compatible with Salesforce Code Builder, making it easier than ever to extend Salesforce applications with Heroku’s cloud services. Whether you’re working in VS Code, an AI-powered fork, or Code Builder, the Heroku extension enhances your development workflow by providing seamless cloud integration.
Streamline Cloud Development with Heroku and VS Code
A delightful developer experience is at the heart of what we do at Heroku. Heroku’s VS Code Extension enhances the DevEx through…
- Easy Installation: install the extension from many providers. Including the VS Code Marketplace or OpenVSX Registry. The Heroku VS Code extension is compatible with VS Code, Salesforce Code Builder and VS Code forks (Eg: Cursor, Windsurf, Trae, Google IDX)
- Real-time Resource Insights: Access to a dedicated Resource Explorer to monitor dyno statuses, manage add-ons like Heroku Postgres and Heroku Key-Value Store, and view logs directly in your IDE.
- One-click Deployment: Deploy your apps with one click, view live deployment logs, and run shell commands—all within VS Code.
- Simple Onboarding: Existing Heroku users can quickly authenticate and import apps, while newcomers can choose from curated starter templates to kickstart their journey.
- Community-Driven: Our developer community asked for Heroku’s VS Code Extension and we heard you! Your continued feedback is key. Join our GitHub community to share suggestions and track upcoming features.
The Future of Cloud Development is Here with Heroku
Heroku Extension for VS Code seamlessly bridges AI-powered coding with efficient cloud deployment, transforming your development workflow. By integrating all essential Heroku functionalities into one environment, you can build, deploy, and manage applications faster and smarter.
Try it today and experience a streamlined, modern approach to cloud development.
The post Heroku Extension for Visual Studio Code (VS Code) Now Generally Available appeared first on Heroku.
]]>New Heroku Partner resources
Heroku introduces new resources designed to help Partners build their expertise and collaborate with the Heroku team. Heroku Partner Readiness Guide : A curated summary of resources to accelerate their journey to becoming a…
The post Heroku Introduces New Partner Resources to Empower Salesforce Consultants appeared first on Heroku.
]]>New Heroku Partner resources
Heroku introduces new resources designed to help Partners build their expertise and collaborate with the Heroku team.
- Heroku Partner Readiness Guide: A curated summary of resources to accelerate their journey to becoming a Heroku Consulting Partner.
- Heroku Technical Learning Journey: A clear path from beginner to advanced proficiency, guiding Consultants through their technical development with Heroku.
- Heroku Partner Trailblazer Community: A place to ask challenging questions, get real-time feedback, network and share ideas with fellow Partners, and access valuable resources.
Coming in 2025 – Heroku Expert Area for Partners and more
The Heroku Expert Area will be a game-changer for Salesforce Consulting Partners aiming to expand their portfolio with pro-code solutions. Becoming a Heroku Expert allows Partners to gain a trusted status and be recognized as a recommended implementation Partner for customers purchasing Heroku.
This level of expertise is also reflected in the Salesforce Partner Finder portal where customers go to look for Partners with trusted Heroku knowledge and validated experience with successful Heroku implementations. This provides customers with credible recommendations for their Heroku projects and ensures high-quality service delivery.
Requirements to become a Heroku Expert
To become a Heroku Expert, Salesforce Consulting Partners must meet specific criteria based on their expertise in implementing and delivering Heroku projects.
There are three levels of expertise for Partners:
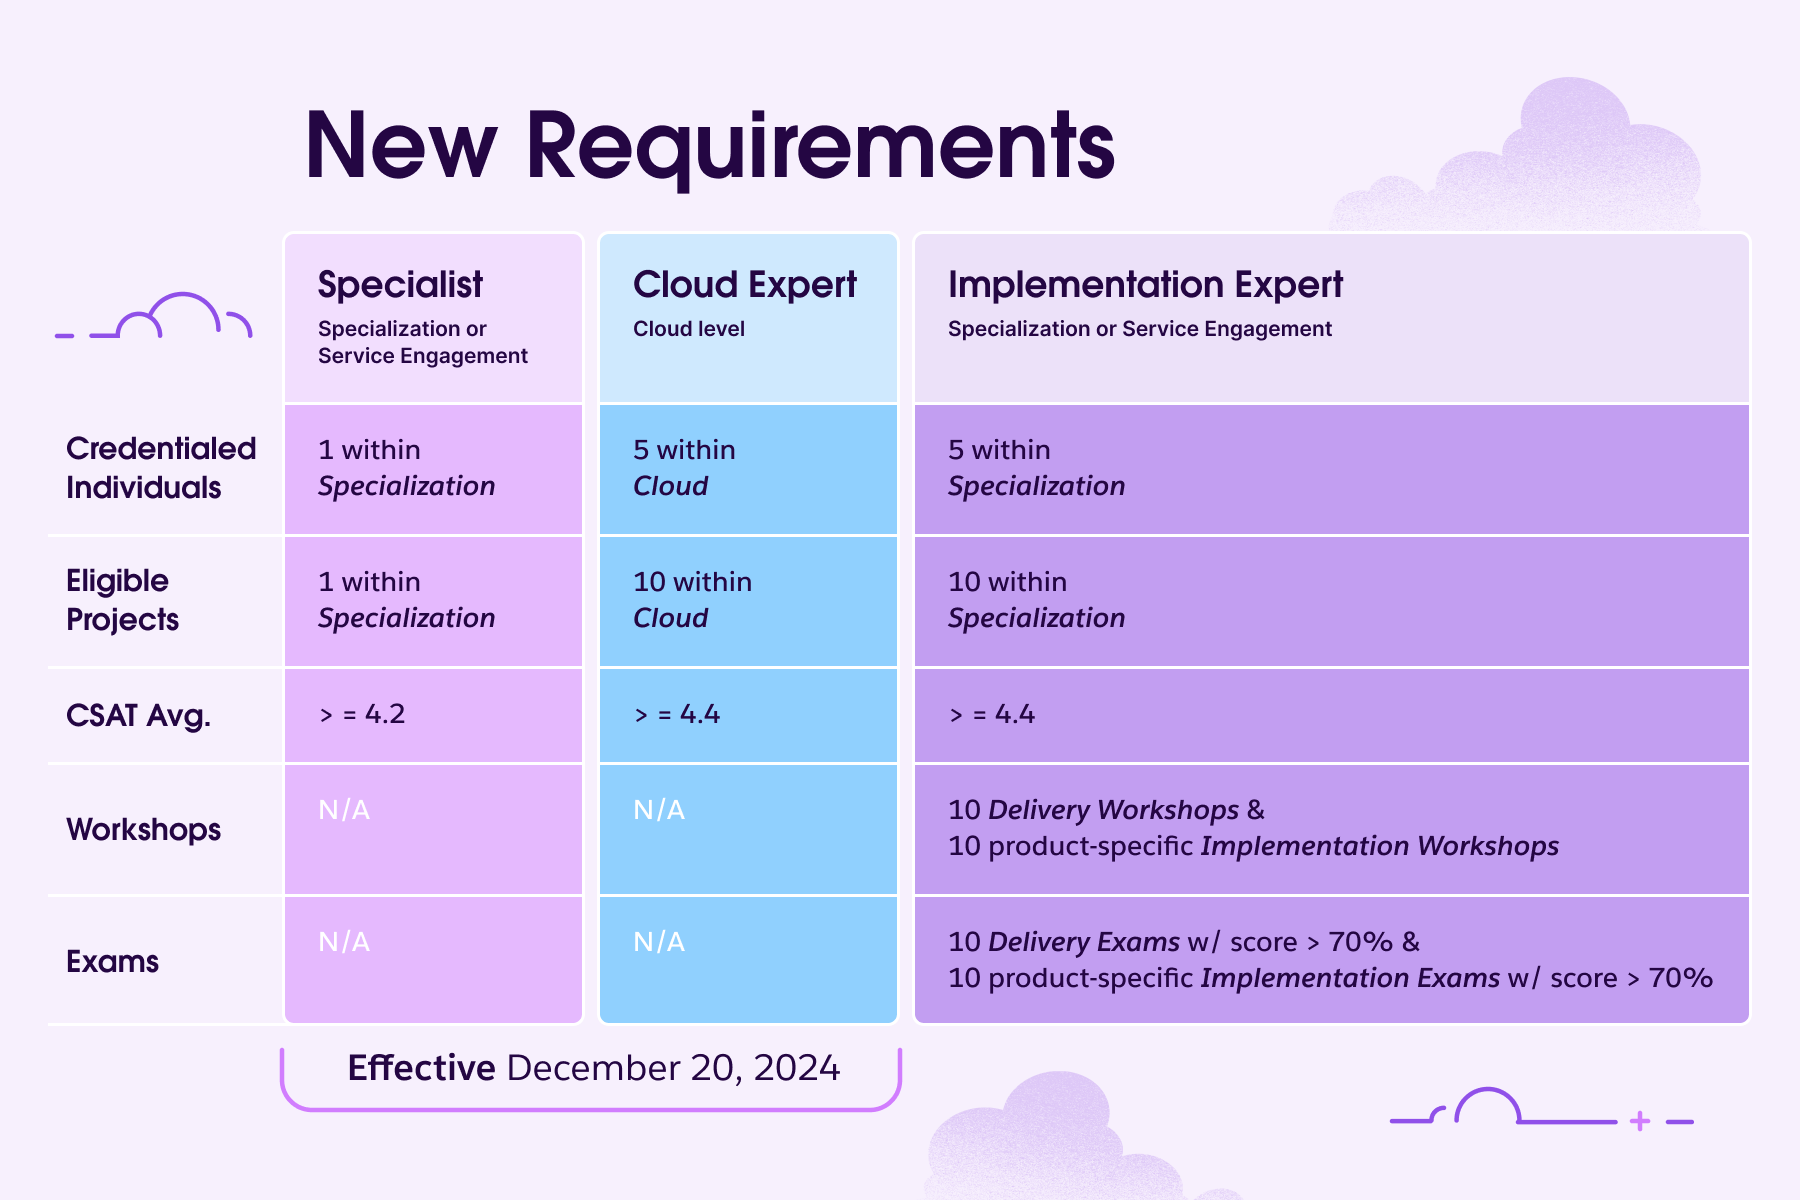
These certifications are designed for Partners who have demonstrated a deep understanding and proven track record with Heroku solutions. To help Partners earn these certifications, Heroku will distribute exam vouchers for the Heroku Architect and Developer exams at no cost, helping lay a solid foundation for growth within the Partner Navigator program.
This Expert Area will launch later in 2025 – stay tuned!
Coming in 2025 – free products to fuel your success
Salesforce Consulting Partners will soon be able to access exclusive Heroku product benefits. These free products will enable Partners to explore Heroku’s capabilities and offer enhanced solutions to their customers.
These benefits will launch later in 2025 – stay tuned!
Looking ahead
These updates represent a major shift in how Salesforce Consulting Partners can leverage Heroku to accelerate their business growth and expand their service offerings. The Heroku Expert Area, combined with the new benefits and resources, will help Partners stay ahead of the curve in an increasingly complex digital landscape.
If you’re a Salesforce Consultant looking to expand your expertise, now is the time to dive deeper into Heroku; explore new Partners resources and stay tuned for more information on becoming a Heroku Expert. The future of cloud app development is here—make sure you’re ready to lead the way.
Interested in learning more? Check out https://www.heroku.com/partnering/
The post Heroku Introduces New Partner Resources to Empower Salesforce Consultants appeared first on Heroku.
]]>Breakout & Theater Sessions You Won’t Want to Miss
TDX is not just a conference—it’s an opportunity to learn from experts, connect with the community, and discover tools and resources that make building on the Salesforce Platform even easier. Here’s…
The post Heroku at TDX 2025: Empowering Developers for the Future appeared first on Heroku.
]]>
Breakout & Theater Sessions You Won’t Want to Miss
TDX is not just a conference—it’s an opportunity to learn from experts, connect with the community, and discover tools and resources that make building on the Salesforce Platform even easier. Here’s a sneak peek at some of the key sessions you can expect from Heroku:
Supercharge your Agentforce Actions with Heroku
Also available on Salesforce+
- Andrew Fawcett, VP of Developer Relations at Heroku
Learn how Salesforce’s Heroku complements Flow and Apex to extend Agentforce capabilities for complex use cases, with elastic compute and the new Heroku integration add-on.
Monitor Real-Time Engagement via Heroku Connect & Agentforce
Also available on Salesforce+
- Errol Schmidt, CEO at reinteractive
- Chris Peterson, Sr. Director of Product Management at Heroku
Learn how Heroku and Heroku Connect can be used to rapidly build a website and connect it to Salesforce, and how to use the connected objects in Agentforce to monitor real-time customer engagement.
Build Scalable APIs for Agentforce with MuleSoft and Heroku
Also available on Salesforce+
- Jonathan Jenkins, Senior Success Architect at Heroku
- Julián Duque, Principal Developer Advocate at Heroku
Learn how to configure and test MuleSoft Flex Gateway on Heroku to run services on multiple dynos and handle ever-increasing workloads. Discover how these services can be leveraged in Agentforce.
How Salesforce Runs Slack Apps at Scale with Heroku
Also available on Salesforce+
- Phi Tran, Software Engineering PMTS
- Yadin Porter de León, Director of Product Marketing at Heroku
Learn how Salesforce's Business Technology team uses Heroku to build and run custom Slack apps at scale, delighting and enabling 85,000 employees.
Improve Apex Performance with Heroku
- Rushi Choudhury, Senior Manager at Workday
- Vivek Viswanathan, Director of Product Management at Heroku
See how Workday improved its Salesforce org by leveraging the Heroku Integration add-on to optimize Apex processes.
Extend Your Code with Heroku and Agentforce
- Vivek Viswanathan, Director of Product Management at Heroku
Learn how to use custom code hosted on Heroku with the Heroku Integration add-on to enhance Agentforce capabilities.
Hands on Learning with Heroku
For a more interactive learning experience, Workshops, Demos and Mini Hacks are the place to be.
Workshop: Get Started with Heroku and Slack App Integration
- Ken Alger, Heroku Developer Advocate
Learn how to integrate Heroku and Slack apps to deliver instant updates, automate tasks, and streamline user interactions.
Demos & Mini Hacks
- Camp Mini Hacks, Level 2 Moscone West
Join the Heroku team at our Demo Booth or Camp Mini Hacks for an interactive experience. Our experts will show you how Heroku seamlessly integrates with Salesforce, Agentforce, and Slack, leveraging popular programming languages to enhance your business impact. Don't miss this chance to explore powerful solutions and get hands-on guidance from the pros!
Heroku at TDX5 Happy Hour
TDX is a great opportunity to connect with fellow developers, product managers, and innovators who are pushing the boundaries of what’s possible. Register to join us! Our team will be on hand to answer questions, offer advice, and help you get the most out of Heroku.
See You at TDX 2025!
We’re incredibly excited to join you at TDX 2025, and we hope you’ll take advantage of all the Heroku sessions, resources, and opportunities available. Whether you’re looking to improve your app development skills, dive deeper into Agentforce and Heroku or discover the latest Heroku features, there’s no better place to be this year.
Visit TDX 2025 to register and explore the full list of sessions.
The post Heroku at TDX 2025: Empowering Developers for the Future appeared first on Heroku.
]]>Heroku CLI v10 introduces several breaking changes, updates for Fir (the next-generation Heroku platform), and overall performance improvements. Here's a breakdown of the key features:
…
The post Heroku CLI v10: Support for Next Generation Heroku Platform appeared first on Heroku.
]]>What’s New in Version 10.0.0?
Heroku CLI v10 introduces several breaking changes, updates for Fir (the next-generation Heroku platform), and overall performance improvements. Here’s a breakdown of the key features:
Breaking Changes
- Node.js 20 Upgrade:
The CLI has been upgraded to Node.js 20, which brings performance improvements, security fixes, and better compatibility with modern development environments. - Changes to
heroku logsCommand:- The
--dynoflag for specifying the process type and dyno name is now deprecated. - Cedar apps: The –dyno flag will continue to work but will be deprecated.
- Fir apps: Users will need to use the new
--process-typeor--dyno-nameflags instead.
- The
- Changes to
ps:stopandps:restartCommands:- Positional arguments for process type and dyno name are deprecated in ps:stop and ps:restart.
- Cedar apps: Positional arguments will still work with a deprecation warning.
- Fir apps: Users must use the
--process-typeor--dyno-nameflags.
- Compatibility with Fir Apps:
Several commands no longer work with Fir apps, includingheroku run,heroku ps:exec,heroku ps:copy,heroku ps:forward, andheroku ps:socks.- Users should now use
heroku run:inside, which is designed to work with Fir apps but not with Cedar apps.
- Users should now use
Support for Next-Generation Heroku Platform (Fir)
- OpenTelemetry Support:
A new suite of commands underheroku telemetryallows seamless integration with OpenTelemetry for Fir apps, enabling better observability. Check out our DevCenter documentation on telemetry drains for setup instructions. - Spaces Updates:
- The
heroku spaces:createcommand now supports a new--generationflag, allowing users to specify whether they are creating a Cedar or Fir space. - A pilot warning message will appear when Fir is selected.
heroku spaces,heroku spaces:infoandheroku spaces:waitnow display the generation of the space.
- The
- Pipelines and Buildpacks:
heroku pipelines:diffhas been updated to support Fir generation apps.- The
heroku buildpackscommand now lists buildpacks specific to Fir apps, based on the latest release.
- Improved Logs for Fir Apps:
heroku logsnow includes a--tailflag for Fir apps to stream logs in real time.- A new “Fetching logs” message is displayed as logs are being retrieved.
- Color rendering issues have been fixed to ensure consistent log output.
Other Updates
- oclif Upgrade: The CLI has been upgraded to oclif v4.14.36, providing a more stable and modular architecture.
- GitHub Workflows: Updated GitHub workflows and actions now run on Node 20
Why These Updates Matter
The upgrade to Node.js 20 sets a solid foundation for future improvements and feature releases. These changes also help ensure that your Heroku CLI experience stays smooth and reliable as we continue to innovate.
The CLI is now ready for the next-generation Fir platform, making it easier to manage and deploy modern apps with enhanced observability, performance, and flexibility.
Ready to upgrade? Update to CLI version 10.0.0 by running heroku update. For more installation options, visit our Dev Center. We encourage you to try it and share your feedback for enhancing the Heroku CLI and for our full Heroku product via the Heroku GitHub roadmap.
The post Heroku CLI v10: Support for Next Generation Heroku Platform appeared first on Heroku.
]]>When we started Heroku, it was the early days of cloud computing, before Docker and Kubernetes were household names in IT. We launched Heroku (and the platform-as-a-service category) to help teams get to the cloud easily with an elegant user experience in front of a powerful platform that automated a lot…
The post The Next Generation of the Heroku Platform appeared first on Heroku.
]]>When we started Heroku, it was the early days of cloud computing, before Docker and Kubernetes were household names in IT. We launched Heroku (and the platform-as-a-service category) to help teams get to the cloud easily with an elegant user experience in front of a powerful platform that automated a lot of the manual work that slowed teams down. To do that then, we had to build a lot of the tooling ourselves, like orchestration and self-hosting the databases in AWS. The platform delivered customers the outcomes they needed to deploy apps quickly and scale effortlessly in the cloud—all without having to worry about how the platform worked.
Fast forward and so much has changed. The landscape of infrastructure, application, and developer tools ecosystem is unrecognizable. Cloud is now the default mode. Cloud-native is a massive movement; the cloud is built on open source, and Kubernetes is the operating system of the cloud. And in an even shorter amount of time, we have seen AI become pervasive in every facet of life, business, and technology–specifically in the software delivery lifecycle.
The challenges facing technology teams have only grown in complexity and risk while increasing the cognitive load on developers and constraining their productivity. While it seems that everything has changed, what hasn’t changed is our mission—to help teams build, deploy, and scale apps and services effortlessly in the cloud.
We’re excited to announce Heroku’s Next Generation Platform-as-a-Service that continues to deliver on this mission, addressing the needs of cloud-native and AI app delivery at scale with a delightful developer experience and a streamlined operator experience.
Heroku changed how the world deployed apps with git push heroku main. That seamless deployment experience is at the core of what developers love about Heroku. Now, we’re bringing that same magic to .NET. Learn more in this post and get started with the beta today.

Kubernetes is the operating system of the cloud, and its ecosystem is vast and innovative. While powerful, it is a part of a platform, not the platform itself. CNCF’s annual survey shows that lack of expertise and concerns about security and observability prevent teams from adopting or scaling Kubernetes. In this release, Heroku brings AWS EKS, ECR, OpenTelemetry, AWS Global Accelerator, Cloud Native Buildpacks, Open Container Initiative (OCI) and AWS Graviton into the platform. Integrating, automating, and scaling with our platform and its opinions help you get started faster and grow safely. One difference now is that some opinions will be “loosely held” and you’ll be able to adjust those configurations to your business requirements. Learn more about the platform updates in this blog.
The impact of AI—on all aspects of our digital lives—continues to grow. However, the ability for organizations to deliver value to their customers and recognize a return on their investments with AI is presenting an increasing challenge. For most companies complexity and security are the largest impediments to integrating AI into their applications and services. By providing managed inference and AI development with AWS Bedrock into the Heroku experience—empowering developers through opinionated simplification—we take care of all the setup, so that you can focus on delivering value. Learn more about Heroku AI in this blog.
We’re excited about this release and are looking forward to hearing from you. Together you’ve built over 65 million apps and created over 38 million data stores on Heroku since 2007, and your critical business apps are serving over 65 billion requests per day. From students learning how to code to processing insurance claims to curating luxury brand experiences—thank you for building your business on Heroku.
The Heroku Next Generation Platform is available in pilot today and will be generally available in early 2025. Sign-up here for pilot access and to stay informed and check out our public roadmap.
The post The Next Generation of the Heroku Platform appeared first on Heroku.
]]>.NET has long been one of the most requested frameworks to join Heroku’s lineup, and for good reason. Known for its power and versatility .NET enables developers to build everything from high-performance APIs to complex, full-stack web applications and scalable microservices. Now, developers can combine .NET’s capabilities with Heroku’s streamlined platform…
The post .NET Support on Heroku appeared first on Heroku.
]]>.NET has long been one of the most requested frameworks to join Heroku’s lineup, and for good reason. Known for its power and versatility .NET enables developers to build everything from high-performance APIs to complex, full-stack web applications and scalable microservices. Now, developers can combine .NET’s capabilities with Heroku’s streamlined platform for a first-class developer experience.
Why Now?
Over the last decade .NET has evolved from a Windows-only framework into a cross-platform and open-source ecosystem. Shaped by lessons learned and inspired by best practices from other technologies, .NET elegantly emphasizes simplicity, maintainability, and performance – qualities that naturally align with Heroku’s mission to help developers focus on building great apps without unnecessary complexity.
For years, developers have relied on community-built buildpacks to run .NET apps on Heroku, from the early buildpacks to the popular .NET Core buildpack. These solutions not only showed the demand, but also demonstrated what was possible. With official support for .NET, we’re building on that foundation to deliver a cohesive and reliable experience. Developers can expect consistent updates, rigorous testing and quality assurance to confidently build and scale their applications.
Want to Get Started?
Our buildpack makes deploying .NET applications a breeze, offering seamless functionality out of the box with the flexibility to customize as needed. Deploying is simple:
heroku create --buildpack heroku/dotnet
git push heroku main
Note: Setting the buildpack with --buildpack heroku/dotnet is only required during the beta.
Whether you’re a seasoned .NET developer or new to the framework, it’s easy to get started. Check out our Getting Started tutorial walking through steps to deploy a Blazor app using a fully managed Heroku Postgres database, running migrations, and more. Our .NET support reference has more detailed documentation.
There’s no better time to use .NET for your apps — and no better place to deploy them than Heroku. Share your feedback via our public roadmap and help shape the future of .NET on Heroku!
We can’t wait to see what you’ll build, and we’re here to help every step of the way.
The post .NET Support on Heroku appeared first on Heroku.
]]>When we launched Cedar, we introduced a new way of thinking about application development and popularized principles like stateless applications, automated builds, and other twelve-factor…
The post Planting New Platform Roots in Cloud Native with Fir appeared first on Heroku.
]]>When we launched Cedar, we introduced a new way of thinking about application development and popularized principles like stateless applications, automated builds, and other twelve-factor principles; encouraging developers to build applications that were portable, horizontally scalable, and resilient. This work extended beyond our own user base and shaped how the industry builds and deploys applications. These principles were adopted by ecosystems like the Spring community and would ultimately become core principles of the cloud-native movement, laying the foundation for the technologies that define the Cloud Native Landscape today.
Embracing and Creating Open Source Standards
Fir is built on a foundation of cloud native technologies and open source standards, ensuring portability, interoperability, and a vibrant ecosystem for your applications. By embracing technologies like the Open Container Initiative (OCI), Cloud Native Buildpacks (CNBs), OpenTelemetry, and Kubernetes (K8s), we're providing a platform that's not only powerful but also incredibly flexible.
By building on these open source foundations, Heroku avoids reinventing the wheel and aligns with open source standards. We can focus our energy on what we do best: creating a smooth and productive developer experience and bringing that attention to the cloud native ecosystem and enabling end user adoption.
Open Container Initiative & Cloud Native Buildpacks
Today, OCI images are the new cloud executables. By moving to OCI artifacts, all Fir apps will be using images with compatibility across different environments. This means you can build your application once, run it locally, and deploy it anywhere, without worrying about vendor lock-in or compatibility issues.
Building container images can be complex and difficult to manage especially at scale. This is why we created Cloud Native Buildpacks with Pivotal. To ensure its broad adoption and ongoing development, we donated the project to the Cloud Native Computing Foundation, establishing it as a standardized way to build container images directly from source code without needing Dockerfiles. Earlier this year, we open sourced CNBs for all of our supported languages. We built these CNBs on years of experience with our existing buildpacks and running them at scale in production. With our language experts, you can focus on your code, and not the intricacies of containerization.
OpenTelemetry
Observability is crucial for modern applications, and OpenTelemetry provides a standardized way to collect and analyze telemetry data. Fir integrates with OpenTelemetry, not only allowing you to instrument your applications with upstream SDKs but also powering our own Heroku Metrics product. These runtime and network telemetry signals can also be easily integrated with your preferred OpenTelemetry-compatible monitoring and analysis tools. Whether you're using an open-source solution or a commercial provider, you can effortlessly integrate your observability pipeline with Fir.
Kubernetes
Fir is built on Kubernetes, the industry-standard container orchestration system. This allows us to offer more flexible dyno types and increased scaling limits to many hundreds of dynos per space, giving you greater control over your application’s resources and performance. We've abstracted away the complexities of Kubernetes, so you can enjoy its benefits without ever having to touch it directly. You get the same simple Heroku experience, now with the added power and scalability of Kubernetes.
By embracing these open source standards, Fir ensures your applications are future-proof, portable, and ready to integrate with the broader cloud-native ecosystem.
A Platform for the Full Stack Developer
At Heroku, we believe in empowering developers, which means the best choices are the ones you don't have to make. The modern day developer is overwhelmed with choices. It’s not good enough to be a full stack developer, it’s common to also be responsible for containerization, base image updates, and potentially operating the cluster the app runs in. Like Cedar, Fir is built on a core principle: maximize developer productivity by minimizing distractions.
What does this mean? Fir is still the Heroku you know and love. It’s rooted in the world renowned developer experience while built on a bedrock of security and stability. We achieve this by offering seamless functionality out of the box with the flexibility to customize as needed. In today's complex development landscape, minimizing cognitive load is crucial. This allows you to focus on what truly matters: delivering value to your customers.
Here are a few examples of how this principle comes to life in Fir:
- Streamlined deployments: Deploy your code with a single command, using Cloud Native Buildpacks to automatically handle the complexities of containerization.
- Simplified scaling: Scale your applications effortlessly with intuitive controls and intelligent defaults, powered by Kubernetes behind the scenes.
- Integrated observability: Gain valuable insights into your application's performance with OpenTelemetry, fully integrated into Fir and our Heroku Metrics product.
By embracing open source standards and adhering to this design principle, we create a platform that is both powerful and predictable. Fir gives you the freedom and flexibility you need to build modern, cloud-native applications, using the developer experience that Heroku is known for.
Looking Ahead
Fir is a platform about bringing Cloud Native to everyone and is built to be the foundation for the next decade and beyond.
This is just the beginning. Today, we’re starting with a pilot for Fir Private Spaces, analogous to our Cedar Generation Private Spaces offering. We have an exciting roadmap ahead, with plans to introduce:
- Enhanced networking features including exposing apps through AWS VPC PrivateLink and AWS Transit Gateway
- Expand Isolation & sandboxing use cases such as Fir for Multi-Tenancy
- Software supply chain security including Software Bill of Materials (SBOMs) generation and cryptographically signed build provenance
Open source technologies form many of the underpinnings of Fir, bringing increased innovation and reliability to the platform, and we’re committed to actively participating in those communities. Your feedback and contributions are invaluable as we continue to evolve and improve Fir, directly shaping the future of the platform. Please join in the conversation on our public roadmap.
Ready to experience the next generation of Heroku? Sign up for the Heroku Fir pilot today and start building your next application on a platform built for the future.
The post Planting New Platform Roots in Cloud Native with Fir appeared first on Heroku.
]]>We are excited to bring AI to the Heroku platform with the pilot of Managed Inference and Agents, delivered with the graceful developer and operational experience and composability that are the heart of Heroku.
Heroku’s Managed Inference and Agents provide access to leading AI models from the world's top AI providers. These solutions optimize the developer and operator experience to easily extend applications on Heroku with AI. Heroku…
The post Heroku AI | Managed Inference and Agents appeared first on Heroku.
]]>We are excited to bring AI to the Heroku platform with the pilot of Managed Inference and Agents, delivered with the graceful developer and operational experience and composability that are the heart of Heroku.
Heroku’s Managed Inference and Agents provide access to leading AI models from the world's top AI providers. These solutions optimize the developer and operator experience to easily extend applications on Heroku with AI. Heroku customers can benefit from this high performance and high trust AI service to focus on their core business needs, while avoiding the complexity and overhead of trying to run their own AI infrastructure and systems.
Heroku AI
At its creation, Heroku took something desirable but complicated—deploying and scaling Rails applications—and made it simple and accessible, so that developers could focus on the value of their applications rather than all the complexity of deploying, scaling, and operating them.
Today, Heroku is doing the same with AI. We’re delivering a set of capabilities that enable developers to focus on the value of their applications augmented with AI, rather than taking on the complexity of operating this rapidly evolving technology. Managed Inference and Agents is the initial offering of Heroku AI, and the cornerstone of our strategic approach to AI on Heroku.
Managed Inference and Agents
Developing applications that leverage AI often means interoperating with large language models (LLMs), embedding models (to power retrieval augmented generation or RAG), and various image or multi-modal models that support content beyond text. The range of model types is vast, their value in different domains are quite variable, and their APIs and configurations are often divergent and complex.
Heroku Managed Inference provides access to an opinionated set of models, chosen for their generative power and performance, optimized for ease of use and efficacy in the domains our customers need most.
Adding access to an AI model in your Heroku application is as easy as heroku ai:models:create in the Heroku CLI. This provides the environment variables for the selected model, making it seamless to call from within your application.
To facilitate model testing and evaluation, the Heroku CLI also provides heroku ai:models:call, allowing users to interact with a model from the command line, simplifying the process of optimizing prompts and context, and debugging interactions with AI models.
Heroku Agents extend Managed Inference with an elegant set of primitives and operations, allowing developers to create AI agents that can execute code in Heroku’s trusted Dynos, as well as call tools and application logic. These capabilities allow agents to act on behalf of the customer, and to extend both application logic and platform capabilities in developer-centric ways. Allowing developers to interleave application code, calls to AI, execute logic created by AI, and use of AI tools, all within the programmatic context.
Join the Pilot Today
Heroku Managed Inference and Agents is now in Pilot, and we invite you to join this exciting phase of the product to push the boundaries of AI applications. Apply to join the Managed Inference and Agents Pilot here, and please send any questions, comments, or requests our way.
Check out this blog for more details about how Heroku, a Salesforce company, supercharges Agentforce.
The post Heroku AI | Managed Inference and Agents appeared first on Heroku.
]]>Now generally available, Router 2.0 will replace the legacy Common Runtime router in the coming months, and bring new networking capabilities and performance to our customers.
The beta launch of Router 2.0 also enabled us to deliver HTTP/2 to our customers. And now, because Router 2.0 has become generally available, HTTP/2 is also generally available for all common runtime customers and even Private Spaces customers too.
We’re excited to have Router 2.0 be the foundation for Heroku to…
The post Router 2.0 and HTTP/2 Now Generally Available appeared first on Heroku.
]]>Now generally available, Router 2.0 will replace the legacy Common Runtime router in the coming months, and bring new networking capabilities and performance to our customers.
The beta launch of Router 2.0 also enabled us to deliver HTTP/2 to our customers. And now, because Router 2.0 has become generally available, HTTP/2 is also generally available for all common runtime customers and even Private Spaces customers too.
We’re excited to have Router 2.0 be the foundation for Heroku to deliver new cutting edge networking features and performance improvements for years to come.
Why a New Router?
Why build a new router instead of improving the existing one? Our primary motivator has been faster and safer delivery of new routing features for our customers. You can see the full rationale behind the change in our Public Beta post.
Lessons Learned from Public Beta
Over the past months, Router 2.0 has been available in public beta, allowing us to gather valuable insights and iterate on its design. Because of early adopter customers and a wealth of feedback through our public roadmap, we were able to make dozens of improvements to the Router and ensure it was fully vetted before promoting it to a GA state.
We made all sorts of improvements during that time, and all of them were fairly straight-forward with one exception involving Puma-based applications. Through our investigations, we actually discovered a bug in Puma itself, and were able to contribute back to the community to get it resolved.
The in-depth analysis below showcases the engineering investigation that took place during the Beta period and the amount of rigorous testing that was done to ensure our new platform met the level of performance and trust that our customers expect.
Pumas, Routers, and Keepalives-Oh My!
Tips and Tricks for Leveraging Router 2.0
Ready to try Router 2.0? Well here are some helpful tips & tricks from the folks that know it best:
Tips & Tricks for Migration to Router 2.0
The Power of HTTP/2
Starting today, HTTP/2 support is now generally available for both Common Runtime customers and Private Spaces customers.
HTTP/2 support is one of the most requested and desired improvements for the Heroku platform. HTTP/2 can be significantly faster than HTTP 1.1 by introducing features like multiplexing and header compression to reduce latency and therefore improve the end-user experience of Heroku apps. We were excited to bring the benefits of HTTP/2 to all Heroku customers.
You can find even more information about the benefits of HTTP/2 and how it works on Heroku from our Public Beta Launch Blog.
Stay tuned for an upcoming blog post and demo showcasing the observable performance improvements when enabling HTTP/2 for your web application!
Get Started Today
Enable Router 2.0
To start routing web requests through Router 2.0 for your Common Runtime app simply run the command:
$ heroku features:enable http-routing-2-dot-0 -a <app name>
Enable HTTP/2
Common Runtime:
HTTP/2 is now enabled by default on Router 2.0. If you follow the same command above, your application will begin to handle HTTP/2 traffic.
A valid TLS certificate is required for HTTP/2. We recommend using Heroku Automated Certificate Management.
In the Common Runtime, we support HTTP/2 on custom domains, but not on the built-in <app-name-cff7f1443a49>.herokuapp.com domain.
To disable HTTP/2, while still using Router 2.0, you can use the command:
heroku labs:enable http-disable-http2 -a <app name>
Private Spaces:
To enable HTTP/2 for a Private Spaces app, you can use the command:
$ heroku features:enable spaces-http2 -a <app name>
In Private Spaces, we support HTTP/2 on both custom domains and the built-in default app domain.
To disable HTTP/2, simply disable the Heroku feature spaces-http2 flag on your app.
The Exciting Future of Heroku Networking
We’re really excited to have brought this entire new routing platform online through a rigorously tested beta period. We appreciate all of the patience and support from our customers as we built out Router 2.0 and its associated features.
This is only the beginning. Now that Router 2.0 is GA, we can start on the next aspects of our roadmap to bring even more innovative and modern features online like enhanced Network Error Logging, HTTP/2 all the way to the dyno, HTTP/3, mTLS, and others.
We'll continue monitoring the public roadmap and your feedback as we explore future networking and routing enhancements, especially our continued research on expanding our networking capabilities.
The post Router 2.0 and HTTP/2 Now Generally Available appeared first on Heroku.
]]>Throughout the Router 2.0 beta, our engineering team has addressed several bugs, all fairly straight-forward with one exception involving Puma -based applications. A small subset of Puma applications would experience increased response times upon enabling the Router 2.0 flag, reflected in customers’ Heroku dashboards and router logs. After thorough router investigation and peeling back Puma’s server code, we realized what we had stumbled upon was not actually a Router 2.0 performance issue.…
The post Pumas, Routers & Keepalives—Oh my! appeared first on Heroku.
]]>Throughout the Router 2.0 beta, our engineering team has addressed several bugs, all fairly straight-forward with one exception involving Puma-based applications. A small subset of Puma applications would experience increased response times upon enabling the Router 2.0 flag, reflected in customers’ Heroku dashboards and router logs. After thorough router investigation and peeling back Puma’s server code, we realized what we had stumbled upon was not actually a Router 2.0 performance issue. The root cause was a bug in Puma! This blog takes a deep dive into that investigation, including some tips for avoiding the bug on the Heroku platform while a fix in Puma is being developed. If you’d like a shorter ride (aka. the TL;DR), skip to The Solution section of this blog. For the full story and all the technical nitty gritty, read on.
Reproduction
The long response times issue first surfaced through a customer support ticket for an application running a Puma + Rails web server. As the customer reported, in high load scenarios, the performance differences between Router 2.0 and the legacy router were disturbingly stark. An application scaled to 2 Standard-1X dynos would handle 30 requests per second just fine through the legacy router. Through Router 2.0, the same traffic would produce very long tail response times (95th and 99th percentiles). Under enough load, throughput would drop and requests would fail with H12: Request Timeout. The impact was immediate upon enabling the http-routing-2-dot-0 feature flag:
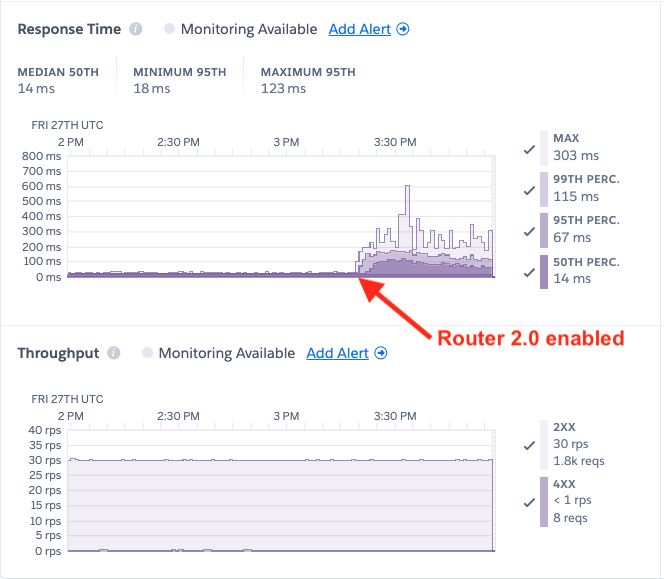
At first, our team of engineers had difficulty reproducing the above, despite running a similarly configured Puma + Rails app on the same framework and language versions. We consistently saw good response times from our app.
Then we tried varying the Rails application’s internal response time. We injected some artificial server lag of 200 milliseconds and that’s when things really took off:
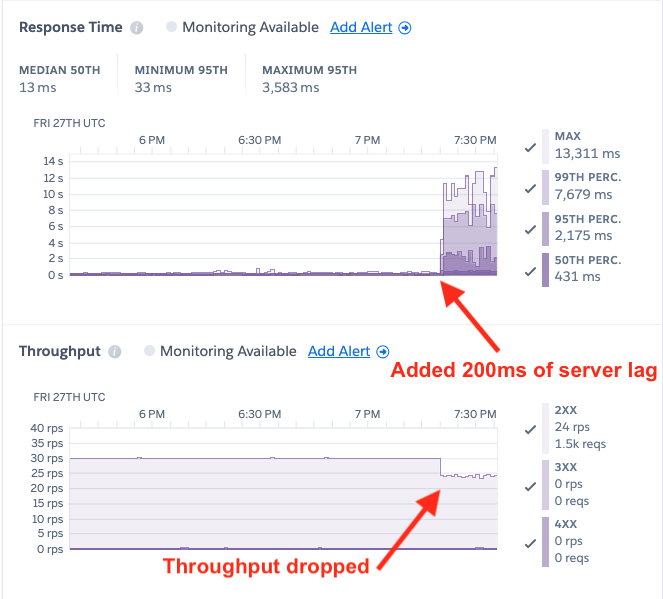
This was quite the realization! In staging environments, Router 2.0 is subject to automatic load tests that run continuously, at varied request rates, body sizes, protocol versions. etc.. These request rates routinely reach much higher levels than 30 requests per second. However, the target applications of these load tests did not include a Heroku app running Puma + Rails with any significant server-side lag.
Investigation
With a reproduction in-hand, we were now in a position to investigate the high response times. We spun up our test app in a staging environment and started injecting a steady load of 30 requests per second.
Our first thought was that perhaps the legacy router is faster at forwarding requests to the dyno because its underlying TCP client manages connections in a way that plays nicer with the Puma server. We hopped on a router instance and began dumping netstat connection states for one of our Puma app's web dynos :
Connections from legacy router → dyno
root@router.1019708 | # netstat | grep ip-10-1-38-72.ec2:11059
tcp 0 0 ip-10-1-87-57.ec2:28631 ip-10-1-38-72.ec2:11059 ESTABLISHED
tcp 0 0 ip-10-1-87-57.ec2:30717 ip-10-1-38-72.ec2:11059 TIME_WAIT
tcp 0 0 ip-10-1-87-57.ec2:15205 ip-10-1-38-72.ec2:11059 ESTABLISHED
tcp 0 0 ip-10-1-87-57.ec2:17919 ip-10-1-38-72.ec2:11059 TIME_WAIT
tcp 0 0 ip-10-1-87-57.ec2:24521 ip-10-1-38-72.ec2:11059 TIME_WAIT
Connections from Router 2.0 → dyno
root@router.1019708 | # netstat | grep ip-10-1-38-72.ec2:11059
tcp 0 0 ip-10-1-87-57.ec2:24630 ip-10-1-38-72.ec2:11059 TIME_WAIT
tcp 0 0 ip-10-1-87-57.ec2:22476 ip-10-1-38-72.ec2:11059 ESTABLISHED
tcp 0 0 ip-10-1-87-57.ec2:38438 ip-10-1-38-72.ec2:11059 TIME_WAIT
tcp 0 0 ip-10-1-87-57.ec2:38444 ip-10-1-38-72.ec2:11059 TIME_WAIT
tcp 0 0 ip-10-1-87-57.ec2:31034 ip-10-1-38-72.ec2:11059 TIME_WAIT
tcp 0 0 ip-10-1-87-57.ec2:38448 ip-10-1-38-72.ec2:11059 TIME_WAIT
tcp 0 0 ip-10-1-87-57.ec2:41882 ip-10-1-38-72.ec2:11059 TIME_WAIT
tcp 0 0 ip-10-1-87-57.ec2:23622 ip-10-1-38-72.ec2:11059 TIME_WAIT
tcp 0 0 ip-10-1-87-57.ec2:31060 ip-10-1-38-72.ec2:11059 TIME_WAIT
tcp 0 0 ip-10-1-87-57.ec2:31042 ip-10-1-38-72.ec2:11059 TIME_WAIT
tcp 0 0 ip-10-1-87-57.ec2:23648 ip-10-1-38-72.ec2:11059 TIME_WAIT
tcp 0 0 ip-10-1-87-57.ec2:31054 ip-10-1-38-72.ec2:11059 TIME_WAIT
tcp 0 0 ip-10-1-87-57.ec2:23638 ip-10-1-38-72.ec2:11059 TIME_WAIT
tcp 0 0 ip-10-1-87-57.ec2:38436 ip-10-1-38-72.ec2:11059 TIME_WAIT
tcp 0 0 ip-10-1-87-57.ec2:31064 ip-10-1-38-72.ec2:11059 TIME_WAIT
tcp 0 0 ip-10-1-87-57.ec2:22492 ip-10-1-38-72.ec2:11059 TIME_WAIT
tcp 0 0 ip-10-1-87-57.ec2:38414 ip-10-1-38-72.ec2:11059 TIME_WAIT
tcp 0 0 ip-10-1-87-57.ec2:42218 ip-10-1-38-72.ec2:11059 ESTABLISHED
tcp 0 0 ip-10-1-87-57.ec2:41880 ip-10-1-38-72.ec2:11059 TIME_WAIT
In the legacy router case, it seemed like there were fewer connections sitting in TIME_WAIT. This TCP state is a normal stop point along the lifecycle of a connection. It means the remote host (dyno) has sent a FIN indicating the connection should be closed. The local host (router) has sent back an ACK, acknowledging the connection is closed.
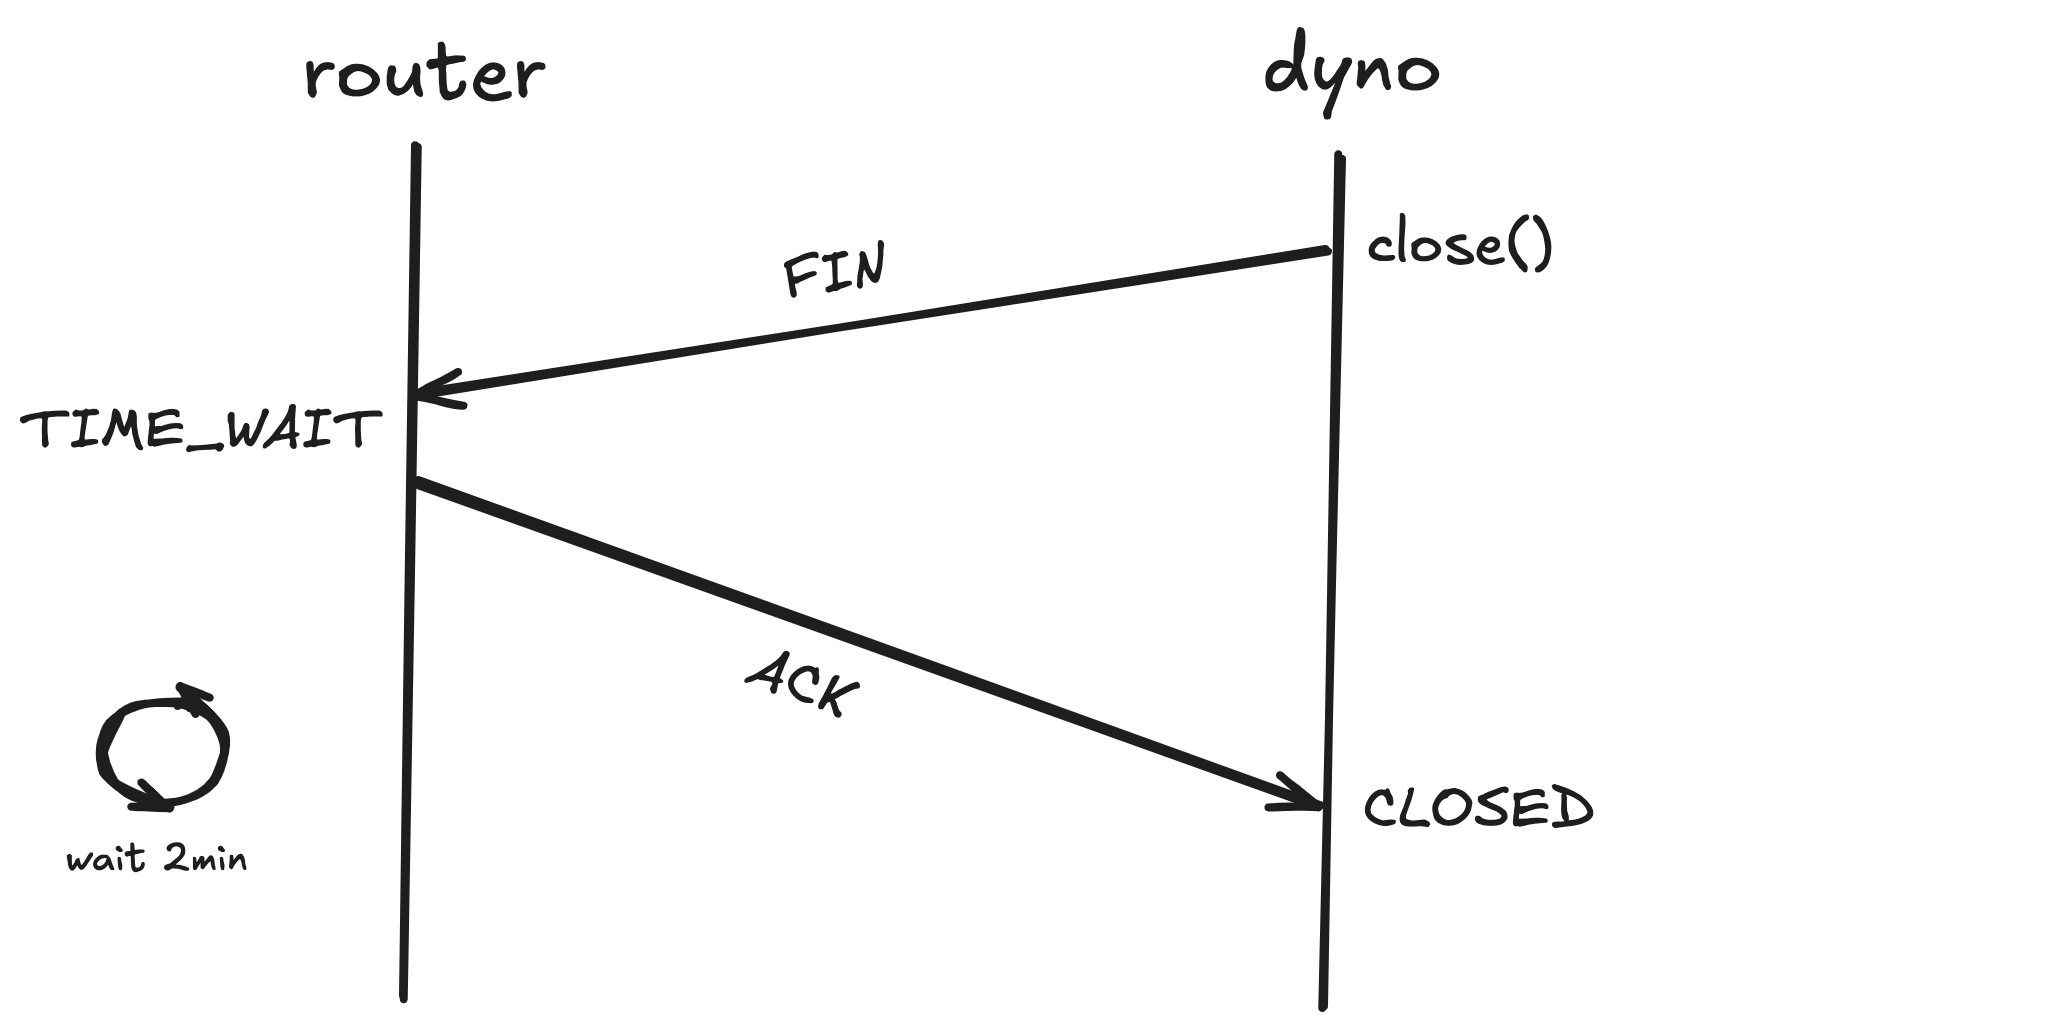
The connection hangs out for some time in TIME_WAIT, with the value varying among operating systems. The Linux default is 2 minutes. Once that timeout is hit, the socket is reclaimed and the router is free to re-use the address + port combination for a new connection.
With this understanding, we formed a hypothesis that the Router 2.0 HTTP client was churning through connections really quickly. Perhaps the new router was opening connections and forwarding requests at a faster rate than the legacy router, thus overwhelming the dyno.
Router 2.0 is written in Go and relies upon the language’s standard HTTP package. Some research turned up various tips for configuring Go’s http.Transport to avoid connection churn. The main recommendation involved tuning MaxIdleConnsPerHost . Without explicitly setting this configuration, the default value of 2 is used.
type Transport struct {
    // MaxIdleConnsPerHost, if non-zero, controls the maximum idle
    // (keep-alive) connections to keep per-host. If zero,
    // DefaultMaxIdleConnsPerHost is used.
    MaxIdleConnsPerHost int
    ...
}

const DefaultMaxIdleConnsPerHost = 2
The problem with a low cap on idle connections per host is that it forces Go to close connections more often. For example, if this value is set to a higher value, like 10, our HTTP transport will keep up to 10 idle connections for this dyno in the pool. Only when the 11th connection goes idle does the transport start closing connections. With the number limited to 2, the transport will close more connections which also means opening more connections to our dyno. This could put strain on the dyno as it requires Puma to spend more time handling connections and less time answering requests.
We wanted to test our hypothesis, so we set DefaultMaxIdleConnsPerHost: 100 on the Router 2.0 transport in staging. The connection distribution did change and now Router 2.0 connections were more stable than before:
root@router.1020195 | # netstat | grep 'ip-10-1-2-62.ec2.:37183'
tcp 0 0 ip-10-1-34-185.ec:36350 ip-10-1-2-62.ec2.:37183 ESTABLISHED
tcp 0 0 ip-10-1-34-185.ec:11956 ip-10-1-2-62.ec2.:37183 ESTABLISHED
tcp 0 0 ip-10-1-34-185.ec:51088 ip-10-1-2-62.ec2.:37183 ESTABLISHED
tcp 0 0 ip-10-1-34-185.ec:60876 ip-10-1-2-62.ec2.:37183 ESTABLISHED
To our dismay, this had zero positive effect on our tail response times. We were still seeing the 99th percentile at well over 2 seconds for a Rails endpoint that should only take about 200 milliseconds to respond.
We tried changing some other configurations on the Go HTTP transport, but saw no improvement. After several rounds of updating a config, waiting for the router artifact to build, and then waiting for the deployment to our staging environment, we began to wonder—can we reproduce this issue locally?
Going local
Fortunately, we already had a local integration test set-up for running requests through Router 2.0 to a dyno. We typically utilize this set-up for verifying features and fixes, rarely for assessing performance. We subbed out our locally running “dyno” for a Puma server with a built-in 200ms lag on the /fixed endpoint. We then fired off 200 requests over 10 different connections with hey:
❯ hey -q 200 -c 10 -host 'purple-local-staging.herokuapp.com' https://localhost:80/fixed

Summary:
  Total:    8.5804 secs
  Slowest:    2.5706 secs
  Fastest:    0.2019 secs
  Average:    0.3582 secs
  Requests/sec:    23.3090

  Total data:    600 bytes
  Size/request:    3 bytes

Response time histogram:
  0.202 [1]    |
  0.439 [185]    |■■■■■■■■■■■■■■■■■■■■■■■■■■■■■■■■■■■■■■■■
  0.676 [0]    |
  0.912 [0]    |
  1.149 [0]    |
  1.386 [0]    |
  1.623 [0]    |
  1.860 [0]    |
  2.097 [1]    |
  2.334 [6]    |■
  2.571 [7]    |■■


Latency distribution:
  10% in 0.2029 secs
  25% in 0.2038 secs
  50% in 0.2046 secs
  75% in 0.2086 secs
  90% in 0.2388 secs
  95% in 2.2764 secs
  99% in 2.5351 secs

Details (average, fastest, slowest):
  DNS+dialup:    0.0003 secs, 0.2019 secs, 2.5706 secs
  DNS-lookup:    0.0002 secs, 0.0000 secs, 0.0034 secs
  req write:    0.0003 secs, 0.0000 secs, 0.0280 secs
  resp wait:    0.3570 secs, 0.2018 secs, 2.5705 secs
  resp read:    0.0002 secs, 0.0000 secs, 0.0175 secs

Status code distribution:
  [200]    200 responses
As you can see, the 95th percentile of response times is over 2 seconds, just as we had seen while running this experiment on the platform. We were now starting to worry that the router itself was inflating the response times. We tried targeting Puma directly at localhost:3000, bypassing the router altogether:
❯ hey -q 200 -c 10 https://localhost:3000/fixed

Summary:
  Total:    8.3314 secs
  Slowest:    2.4579 secs
  Fastest:    0.2010 secs
  Average:    0.3483 secs
  Requests/sec:    24.0055

  Total data:    600 bytes
  Size/request:    3 bytes

Response time histogram:
  0.201 [1]    |
  0.427 [185]    |■■■■■■■■■■■■■■■■■■■■■■■■■■■■■■■■■■■■■■■■
  0.652 [0]    |
  0.878 [0]    |
  1.104 [0]    |
  1.329 [0]    |
  1.555 [0]    |
  1.781 [0]    |
  2.007 [0]    |
  2.232 [2]    |
  2.458 [12]    |■■■


Latency distribution:
  10% in 0.2017 secs
  25% in 0.2019 secs
  50% in 0.2021 secs
  75% in 0.2026 secs
  90% in 0.2042 secs
  95% in 2.2377 secs
  99% in 2.4433 secs

Details (average, fastest, slowest):
  DNS+dialup:    0.0002 secs, 0.2010 secs, 2.4579 secs
  DNS-lookup:    0.0001 secs, 0.0000 secs, 0.0016 secs
  req write:    0.0001 secs, 0.0000 secs, 0.0012 secs
  resp wait:    0.3479 secs, 0.2010 secs, 2.4518 secs
  resp read:    0.0000 secs, 0.0000 secs, 0.0003 secs

Status code distribution:
  [200]    200 responses
Wow! These results suggested the issue is reproducible with any ‘ole Go HTTP client and a Puma server. We next wanted to test out a different client. The load injection tool, hey is also written in Go, just like Router 2.0. We next tried ab which is written in C:
❯ ab -c 10 -n 200 https://127.0.0.1:3000/fixed
This is ApacheBench, Version 2.3 <$Revision: 1913912 $>
Copyright 1996 Adam Twiss, Zeus Technology Ltd, https://www.zeustech.net/
Licensed to The Apache Software Foundation, https://www.apache.org/

Benchmarking 127.0.0.1 (be patient)
Completed 100 requests
Completed 200 requests
Finished 200 requests


Server Software:
Server Hostname:        127.0.0.1
Server Port:            3000

Document Path:          /fixed
Document Length:        3 bytes

Concurrency Level:      10
Time taken for tests:   8.538 seconds
Complete requests:      200
Failed requests:        0
Total transferred:      35000 bytes
HTML transferred:       600 bytes
Requests per second:    23.42 [#/sec] (mean)
Time per request:       426.911 [ms] (mean)
Time per request:       42.691 [ms] (mean, across all concurrent requests)
Transfer rate:          4.00 [Kbytes/sec] received

Connection Times (ms)
              min  mean[+/-sd] median   max
Connect:        0    0   0.2      0       2
Processing:   204  409  34.6    415     434
Waiting:      204  409  34.7    415     434
Total:        205  410  34.5    415     435

Percentage of the requests served within a certain time (ms)
  50%    415
  66%    416
  75%    416
  80%    417
  90%    417
  95%    418
  98%    420
  99%    429
 100%    435 (longest request)
Another wow! The longest request took about 400 milliseconds, much lower than the 2 seconds above. Had we just stumbled upon some fundamental incompatibility between Go’s standard HTTP client and Puma? Not so fast.
A deeper dive into the ab documentation surfaced this option:
❯ ab -h
Usage: ab [options] [http[s]://]hostname[:port]/path
Options are:
    ...
    -k              Use HTTP KeepAlive feature
That’s different than hey’s default of enabling keepalive by default. Could that be significant? We re-ran ab with -k:
❯ ab -k -c 10 -n 200 https://127.0.0.1:3000/fixed
This is ApacheBench, Version 2.3 <$Revision: 1913912 $>
Copyright 1996 Adam Twiss, Zeus Technology Ltd, https://www.zeustech.net/
Licensed to The Apache Software Foundation, https://www.apache.org/

Benchmarking 127.0.0.1 (be patient)
Completed 100 requests
Completed 200 requests
Finished 200 requests


Server Software:
Server Hostname:        127.0.0.1
Server Port:            3000

Document Path:          /fixed
Document Length:        3 bytes

Concurrency Level:      10
Time taken for tests:   8.564 seconds
Complete requests:      200
Failed requests:        0
Keep-Alive requests:    184
Total transferred:      39416 bytes
HTML transferred:       600 bytes
Requests per second:    23.35 [#/sec] (mean)
Time per request:       428.184 [ms] (mean)
Time per request:       42.818 [ms] (mean, across all concurrent requests)
Transfer rate:          4.49 [Kbytes/sec] received

Connection Times (ms)
              min  mean[+/-sd] median   max
Connect:        0    0   0.5      0       6
Processing:   201  405 609.0    202    2453
Waiting:      201  405 609.0    202    2453
Total:        201  406 609.2    202    2453

Percentage of the requests served within a certain time (ms)
  50%    202
  66%    203
  75%    203
  80%    204
  90%   2030
  95%   2242
  98%   2267
  99%   2451
 100%   2453 (longest request)
Now the output looked just like the hey output. Next, we ran hey with keepalives disabled:
❯ hey -disable-keepalive -q 200 -c 10 https://localhost:3000/fixed

Summary:
  Total:    8.3588 secs
  Slowest:    0.4412 secs
  Fastest:    0.2091 secs
  Average:    0.4115 secs
  Requests/sec:    23.9269

  Total data:    600 bytes
  Size/request:    3 bytes

Response time histogram:
  0.209 [1]    |
  0.232 [3]    |■
  0.255 [1]    |
  0.279 [0]    |
  0.302 [0]    |
  0.325 [0]    |
  0.348 [0]    |
  0.372 [0]    |
  0.395 [0]    |
  0.418 [172]    |■■■■■■■■■■■■■■■■■■■■■■■■■■■■■■■■■■■■■■■■
  0.441 [23]    |■■■■■


Latency distribution:
  10% in 0.4140 secs
  25% in 0.4152 secs
  50% in 0.4160 secs
  75% in 0.4171 secs
  90% in 0.4181 secs
  95% in 0.4187 secs
  99% in 0.4344 secs

Details (average, fastest, slowest):
  DNS+dialup:    0.0011 secs, 0.2091 secs, 0.4412 secs
  DNS-lookup:    0.0006 secs, 0.0003 secs, 0.0017 secs
  req write:    0.0001 secs, 0.0000 secs, 0.0011 secs
  resp wait:    0.4102 secs, 0.2035 secs, 0.4343 secs
  resp read:    0.0001 secs, 0.0000 secs, 0.0002 secs

Status code distribution:
  [200]    200 responses
Again, no long tail response times and the median values comparable to the first run with ab.
Even better, this neatly explained the performance difference between Router 2.0 and the legacy router. Router 2.0 adds support for HTTP keepalives by default, in line with HTTP/1.1 spec. In contrast, the legacy router closes connections to dynos after each request. Keepalives usually improve performance, reducing time spent in TCP operations for both the router and the dyno. Yet, the opposite was true for a dyno running Puma.
Diving deep into Puma
Note that we suggest reviewing this brief Puma architecture document if you’re unfamiliar with the framework and want to get the most out of this section. To skip the code review, you may fast-forward to The Solution.
This finding was enough of a smoking gun to send us deep into the the Puma server code, where we homed in on the process_client method. Let’s take a look at that code with a few details in mind:
- Each Puma thread can only handle a single connection at at time. A client is a wrapper around a connection.
- The
handle_requestmethod handles exactly 1 request. It returnsfalsewhen the connection should be closed andtruewhen it should be kept open. A client with keepalive enabled will end up in thetruecondition on line470. fast_checkis onlyfalseonce we’ve processed@max_fast_inlinerequests serially off the connection and when there are more connections waiting to be handled.- For some reason, even when the number of connections exceeds the max number of threads,
@thread_pool.backlog > 0is often times false. - Altogether, this means the below loop usually executes indefinitely until we’re able to bail out when
handle_requestreturnsfalse.
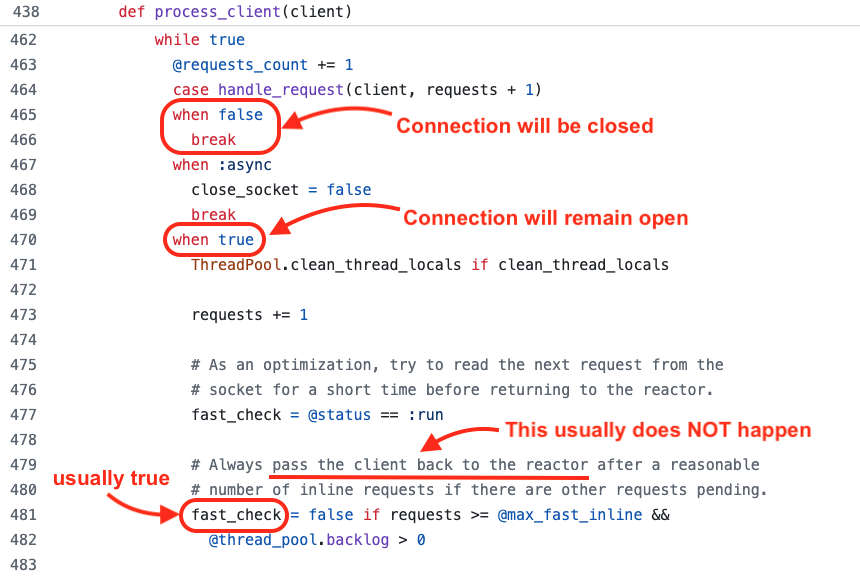
Code snippet from puma/lib/puma/server.rb in Puma 6.4.2.
When does handle_request actually return false? That is also based on a bunch of conditional logic, the core of it is in the prepare_response method. Basically, if force_keep_alive is false, handle_request will return false. (This is not exactly true. It’s more complicated, but that’s not important for this discussion.)
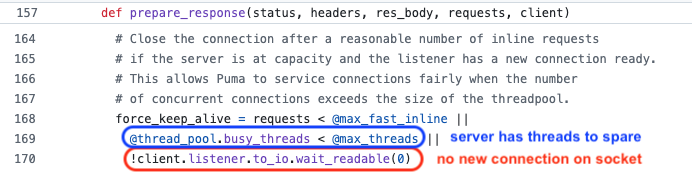
Code snippet from puma/lib/puma/request.rb in Puma 6.4.2.
The last thing to put the puzzle together: max_fast_inline defaults to 10. That means Puma will process at least 10 requests serially off a single connection before handing the connection back to the reactor class. Requests that may have come in a full second ago are just sitting in the queue, waiting for their turn. This directly explains our 10*200ms = 2 seconds of added response time for our longest requests!
We figured setting max_fast_inline=1 might fix this issue, and it does sometimes. However, under sufficient load, even with this setting, response times will climb. The problem is the other two OR’ed conditions circled in blue and red above. Sometimes the number of busy threads is less than the max and sometimes, there are no new connections to accept on the socket. However, these decisions are made at a point in time and the state of the server is constantly changing. They are subject to race conditions since other threads are concurrently accessing these variables and taking actions that modify their values.
The Solution
After reviewing the Puma server code, we came to the conclusion that the simplest and safest way to bail out of processing requests serially would be to flat-out disable keepalives. Explicitly disabling keepalives in the Puma server means handing the client back to the reactor after each request. This is how we ensure requests are served in order.
Once confirming these results with the Heroku Ruby language owners, we opened a Github issue on the Puma project and a pull request to add an enable_keep_alives option to the Puma DSL. When set to false, keepalives are completely disabled. The option will be released soon, likely in Puma 6.5.0.
We then re-ran our load tests with enable_keep_alives disabled in Puma and Router 2.0 enabled on the app:
// config/puma.rb
...
enable_keep_alives false
The response times and throughput improved, as expected. Additionally, once disabling Router 2.0, the response times stayed the same:

Moving forward
Keeping keepalives
Keeping connections alive reduces time spent in TCP operations. Under sufficient load and scale, avoiding this overhead cost can positively impact apps’ response times. Additionally, keepalives are the de facto standard in HTTP/1.1 and HTTP/2. Because of this, Heroku has chosen to move forward with keepalives as the default behavior for Router 2.0.
Through raising this issue on the Puma project, there has already been movement to fix the bad keepalive behavior in the Puma server. Heroku engineers remain active participants in discussions arounds these efforts and are committed to solving this problem. Once a full fix is available, customers will be able to upgrade their Puma versions and use keepalives safely, without risk of long response times.
Disabling keepalives as a stopgap
In the meantime, we have provided another option for disabling keepalives when using Router 2.0. The following labs flag may be used in conjunction with Router 2.0 to disable keepalives between the router and your web dynos:
heroku labs:enable http-disable-keepalive-to-dyno -a my-app
Note that this flag has no effect when using the legacy router as keepalives between the legacy router and dyno are not supported. For more information, see Heroku Labs: Disabling Keepalives to Dyno for Router 2.0.
Other options for Puma
You may find that your Puma app does not need keepalives disabled in order to perform well while using Router 2.0. We recommend testing and tuning other configuration options, so that your app can still benefit from persistent connections between the new router and your dyno:
- Increase the number of threads. More threads means Puma is better able to handle concurrent connections.
- Increase the number of workers. This is similar to increasing the number of threads.
- Decrease the
max_fast_inlinenumber. This will limit the number of requests served serially off a connection before handling queued requests.
Other languages & frameworks
Our team also wanted to see if this same issue would present in other languages or frameworks. We ran load tests, injecting 200 milliseconds of server-side lag over the top languages and frameworks on the Heroku platform. Here are those results.
| Language/Framework | Router | Web dynos | Server-side lag | Throughput | P50 Response Time | P95 Response Time | P99 Response Time |
|---|---|---|---|---|---|---|---|
| Puma | Legacy | 2 Standard-1X | 200 ms | 30 rps | 215 ms | 287 ms | 335 ms |
| Puma with keepalives | Router 2.0 | 2 Standard-1X | 200 ms | 23 rps | 447 ms | 3,455 ms | 5,375 ms |
| Puma without keepalives | Router 2.0 | 2 Standard-1X | 200 ms | 30 rps | 215 ms | 271 ms | 335 ms |
| NodeJS | Legacy | 2 Standard-1X | 200 ms | 30 rps | 207 ms | 207 ms | 207 ms |
| NodeJS | Router 2.0 | 2 Standard-1X | 200 ms | 30 rps | 207 ms | 207 ms | 207 ms |
| Python | Legacy | 4 Standard-1X | 200 ms | 30 rps | 223 ms | 607 ms | 799 ms |
| Python | Router 2.0 | 4 Standard-1X | 200 ms | 30 rps | 223 ms | 607 ms | 735 ms |
| PHP | Legacy | 2 Standard-1X | 200 ms | 30 rps | 207 ms | 367 ms | 431 ms |
| PHP | Router 2.0 | 2 Standard-1X | 200 ms | 30 rps | 207 ms | 367 ms | 431 ms |
| Java | Legacy | 2 Standard-1X | 200 ms | 30 rps | 207 ms | 207 ms | 207 ms |
| Java | Router 2.0 | 2 Standard-1X | 200 ms | 30 rps | 207 ms | 207 ms | 207 ms |
| Go | Legacy | 2 Standard-1X | 200 ms | 30 rps | 207 ms | 207 ms | 207 ms |
| Go | Router 2.0 | 2 Standard-1X | 200 ms | 30 rps | 207 ms | 207 ms | 207 ms |
These results indicate the issue is unique to Puma, with Router 2.0 performance comparable to the legacy router in other cases.
Conclusion
We were initially surprised by this keepalive behavior in the Puma server. Funny enough, we believe Heroku’s significance in the Puma/Rails world and the fact that the legacy router does not support keepalives may have been factors in this bug persisting for so long. Reports of it had popped up in the past (see Issue 3443, Issue 2625 and Issue 2331), but none of these prompted a fool-proof fix. Setting enable_keep_alives false does completely eliminate the problem, but this is not the default option. Now, Puma maintainers are taking a closer look at the problem and benchmarking potential fixes in a fork of the project. The intention is to fix the balancing of requests without closing TCP connections to the Puma server.
Our Heroku team is thrilled that we were able to contribute in this way and help move the Puma/Rails community forward. We’re also excited to release Router 2.0 as GA, unlocking new features like HTTP/2 and keepalives to your dynos. We encourage our users to try out this new router! For advice on how to go about that, see Tips & Tricks for Migrating to Router 2.0.
The post Pumas, Routers & Keepalives—Oh my! appeared first on Heroku.
]]>Start with a Staging Application
We recommend exploring the new router’s features and validating your specific use cases in a controlled environment. If you…
The post Tips & Tricks for Migrating to Router 2.0 appeared first on Heroku.
]]>
Start with a Staging Application
We recommend exploring the new router’s features and validating your specific use cases in a controlled environment. If you haven’t already, spin up a staging version of your app that mirrors your production set-up as closely as possible. Heroku provides helpful tools, like pipelines and review apps, for creating separate environments for your app. Once you have an application that you can test with, you can opt-in to Router 2.0 by running:
$ heroku features:enable http-routing-2-dot-0 -a <staging app name>
You may see a temporary rise in response times after migrating to the new router, due to the presence of connections on both routers. Using the Heroku CLI, run heroku ps:restart to restart all web dynos. You can also accomplish this using the Heroku Dashboard, see Restart Dynos for details. This will force the closing of any connections from the legacy router. You can monitor your individual request response times via the service field in your application’s logs or see accumulated response time metrics in the Heroku dashboard.
How to Determine if Your Traffic is Going Through Router 2.0
Once your staging app is live and you have enabled the http-routing-2-dot-0 Heroku Feature, you’ll want to confirm that traffic is actually being routed through Router 2.0. There are two easy ways to determine the router your app is using.
HTTP Headers
You can identify which router your application is using by inspecting the HTTP Headers. The Via header, present in all HTTP responses from Heroku applications, is a code name for the Heroku router handling the request. Use the curl command to display the response headers of a request or your preferred browser’s developer tool.
To see the headers using curl, run:
curl --head https://your-domain.com
In Router 2.0 the Via header value will be one of the following (depending on whether the protocol used is HTTP/2 or HTTP/1.1):
< server: Heroku
< via: 2.0 heroku-router
< Server: Heroku
< Via: 1.1 heroku-router
The Heroku legacy router code name for comparison, is:
< Server: Cowboy
< Via: 1.1 vegur
Note that per the HTTP/2 spec, RFC 7540 Section 8.1.2, headers are converted to lowercase prior to their encoding in HTTP/2.
To read more about Heroku Headers, see this article.
Logs
You will also see some subtle differences in your application’s system logs after migrating to Router 2.0. To fetch your app’s most recent system logs, use the heroku logs --source heroku command:
2024-10-03T08:20:09.580640+00:00 heroku[router]: at=info method=GET path="/"
host=example-app-1234567890ab.heroku.com
request_id=2eab2d12-0b0b-c951-8e08-1e88f44f096b fwd="204.204.204.204"
dyno=web.1 connect=0ms service=0ms status=200 bytes=6742
protocol=http2.0 tls=true tls_version=tls1.3
2024-10-03T08:35:18.147192+00:00 heroku[router]: at=info method=GET path="/"
host=example-app-1234567890ab.heroku.com
request_id=edbea7f4-1c07-a533-93d3-99809b06a2be fwd="204.204.204.204"
dyno=web.1 connect=0ms service=0ms status=200 bytes=6742 protocol=http1.1 tls=false
In this example, the output shows two log lines for requests sent to an app’s custom domain, handled by Router 2.0 over both HTTPS and HTTP protocols. You can compare these to the equivalent router log lines handled by the legacy routing system:
2024-10-03T08:22:25.126581+00:00 heroku[router]: at=info method=GET path="/"
host=example-app-1234567890ab.heroku.com
request_id=1b77c2d3-6542-4c7a-b3db-0170d8c652b6 fwd="204.204.204.204"
dyno=web.1 connect=0ms service=1ms status=200 bytes=6911
protocol=https
2024-10-03T08:33:49.139436+00:00 heroku[router]: at=info method=GET path="/"
host=example-app-1234567890ab.heroku.com
request_id=057d3a4b-2f16-4375-ba74-f6b168b2fe3d fwd="204.204.204.204"
dyno=web.1 connect=1ms service=1ms status=200 bytes=6911 protocol=http
The key differences in the router logs are:
- In Router 2.0, the protocol field will display values like
http2.0orhttp1.1, unlike the legacy router which identifies the protocol withhttpsorhttp. - In Router 2.0, you will see new fields
tlsandtls_version(the latter will only be present if a request is sent over a TLS connection).
Here are some alternative ways to view your application's logs.
HTTP/2 is Now the Default
One of the most exciting changes in Router 2.0 is that HTTP/2 is now enabled by default. This new version of the protocol brings improvements in performance, especially for apps handling concurrent requests, as it allows multiplexing over a single connection and prioritizes resources efficiently.
Here are some considerations when using HTTP/2 on Router 2.0:
- HTTP/2 terminates at the Heroku router and we forward HTTP/1.1 from the router to your app.
- Router 2.0 supports HTTP/2 on custom domains, but not on the built-in
<app-name-cff7f1443a49>.herokuapp.com>default domain. - A valid TLS certificate is required for HTTP/2. We recommend using Heroku Automated Certificate Management.
You can verify your app is receiving HTTP/2 requests by referencing the protocol value in your application’s logs or looking at the HTTP response headers for your request.
That said, not all applications are ready for HTTP/2 out-of-the-box. If you notice any issues during testing or if the older protocol is simply more suitable for your needs, you can disable HTTP/2 in Router 2.0, reverting to HTTP/1.1. Run the following command:
heroku labs:enable http-disable-http2 -a <app name>
Keepalives Always On
Another key enhancement in Router 2.0 is the improved handling of keepalives, setting it apart from our legacy router. Router 2.0 enables keepalives for all connections between itself and web dynos by default, unlike the legacy router which opens a new connection for every request to a web dyno and closes it upon receiving the response. Allowing keepalives can help optimize connection reuse and reduce the overhead of opening new TCP connections. This in turn lowers request latencies and allows higher throughput.
Unfortunately, this optimization is not 100% compatible with every app. Specifically, recent Puma versions have a connection-handling bug that results in significantly longer tail request latencies if keepalives are enabled. Thanks to one of our customers, we learned this during the Router 2.0 beta period. For more details, see the blog post on this topic. Their early adoption of our new router and timely feedback helped us pinpoint the issue and after extensive investigation, identify the problem with Puma and keepalives.
Just like with HTTP/2 we realize one size does not fit all, thus we have introduced a new labs feature that allows you to opt-out of keepalives. To disable keepalives in Router 2.0, you can run the following command:
heroku labs:enable http-disable-keepalive-to-dyno -a <app name>
Conclusion
Migrating to Router 2.0 represents a critical step in leveraging Heroku’s latest infrastructure improvements. The transition offers exciting new features like HTTP/2 support and enhanced connection handling. To facilitate a seamless transition we recommend you start testing the new router before we begin the Router 2.0 rollout to all customers in the coming months. By following these tips and confirming your app’s routing needs are met on Router 2.0, you will be well-prepared to take full advantage of the new router’s benefits.
Stay tuned for more updates as we continue to improve Router 2.0’s capabilities and gather feedback from the developer community!
The post Tips & Tricks for Migrating to Router 2.0 appeared first on Heroku.
]]>This includes where you turn for your PostgreSQL database .
If you’re considering migrating your Postgres database to a different cloud provider, such as Heroku, the process might seem daunting.…
The post Planning Your PostgreSQL Migration: Best Practices and Key Considerations appeared first on Heroku.
]]>This includes where you turn for your PostgreSQL database.
If you’re considering migrating your Postgres database to a different cloud provider, such as Heroku, the process might seem daunting. You’re concerned about the risk of data loss or the impact of extended downtime. Are the benefits worth the effort and the risk?
With the right strategy and a solid plan in place, migrating your Postgres database is absolutely manageable. In this post, we’ll walk you through the key issues and best practices to ensure a successful Postgres migration. By the end of this guide, you’ll be well equipped to make the move that best serves your organization.
Pre-migration assessment
Naturally, you need to know your starting point before you can plan your route to a destination. For a database migration, this means evaluating your current Postgres setup. Performing a pre-migration assessment will help you identify any potential challenges, setting you up for a smooth transition.
Start by reviewing the core aspects of your database.
Database version
Ensure the target cloud provider supports your current Postgres version. When you’re connected via the psql CLI client, the following commands will help you get your database version, with varying levels of detail:
psql=> SELECT version();

PostgreSQL 12.19 on aarch64-unknown-linux-gnu, compiled by gcc (GCC) 7.3.1 20180712 (Red Hat 7.3.1-6), 64-bit

psql=> SHOW server_version;

12.19
Extensions
Check for any Postgres extensions installed on your current database which are critical to your applications. Some extensions might not be available on your new platform, so be sure to verify this compatibility upfront.
psql=> dx


List of installed extensions
-[ RECORD 1 ]--------------------------------------------------------------
Name        | fuzzystrmatch
Version     | 1.1
Schema      | public
Description | determine similarities and distance between strings
-[ RECORD 2 ]--------------------------------------------------------------
Name        | plpgsql
Version     | 1.0
Schema      | pg_catalog
Description | PL/pgSQL procedural language
-[ RECORD 3 ]--------------------------------------------------------------
Name        | postgis
Version     | 3.0.0
Schema      | public
Description | PostGIS geometry, geography, and raster spatial types and…
Configurations
Determine and document any custom configurations for your database instance. This may include memory settings, timeouts, and query optimizations. Depending on the infrastructure and performance capabilities of your destination cloud provider, you may need to adjust these configurations.
You might be able to track down the files for your initial Postgres configuration (such as pg_hba.conf and postgresql.conf). However, in case you don’t have access to those files, or your configuration settings have changed, then you can capture all of your current settings into a file which you can review. Run the following command in your terminal:
$ psql  # Include any connection and credentials flags
    -c "copy (select * from pg_settings) to '/tmp/psql_settings.csv' with (format csv, header true);"
This will create a file at /tmp/psql_settings.csv with the full list of configurations you can review.
Schema and data compatibility
Review the schema, data types, and indexes in your current database. Ensure they’re fully compatible with the Postgres version and configurations on the target cloud provider. The feature matrix in the Postgres documentation provides a quick reference to see what is or isn’t supported for any given version.
Performance benchmark
Measure the current performance of your PostgreSQL database. When you establish performance benchmarks, you can compare pre- and post-migration metrics. This will help you (and any other migration stakeholders) understand how the new environment meets or exceeds your business requirements.
When making your performance comparison, focus on key metrics like query performance, I/O throughput, and response times.
Identify dependencies
Create a detailed catalog of the integrations, applications, and services that rely on your database. Your applications may use ORM tools, or you have microservices or APIs that query your database. Don’t forget about any third-party services that may access the database, too. You’ll need this comprehensive list when it’s time to cutover all connections to your new provider’s database. This will help you minimize disruptions and test all your connections.
Migration strategy
When deciding on an actual database migration strategy, you have multiple options to choose from. The one you choose primarily depends on the size of your database and how much downtime you’re willing to endure. Let’s briefly highlight the main strategies.
#1: Dump and restore
This method is the simplest and most straightforward. You create a full backup of your Postgres database using the pg_dump utility. Then, you restore the backup on your target cloud provider using pg_restore. For most migrations, dump and restore is the preferred solution. However, keep in mind the following caveats:
- This is best suited for smaller databases. One recommendation from this AWS guide is not to use this strategy if your database exceeds 100 GB in size. To determine the true size of your database, use the
VACUUM ANALYZEcommands in Postgres. - This strategy requires some system downtime. It takes time to dump, transfer, restore, and test the data. Any database updates occurring during that time would be missed in the cutover, leaving your database out of sync. Plan for a generous amount of downtime — at least several hours — for this entire migration process.
#2: Logical replication
Logical replication replicates changes from the source instance to the target. The source instance is set up to publish any changes, while the target instance listens for changes. As changes are made to the source database, they are replicated in real time on the destination database. Eventually, both databases become synchronized and stay that way until you’re ready to cutover.
This approach allows you to migrate data with little to no downtime. However, the setup and management of replication may be complex. Also, certain updates, such as schema modifications are not published. This means you’ll need some manual intervention during the migration to carry over these changes.
#3: Physical replication
Adopting a physical replication strategy means copying the actual block-level files that make up your database and then transferring them to the target database machine. This is a good option for when you need the consistency of an exact replication of data and system steps.
For this strategy to work, your source and target Postgres versions must be identical. In addition, this approach introduces downtime that is similar to the dump and restore approach. So, unless you have a unique situation that requires such a high level of consistency, you may be better off with the dump and restore approach.
#4: Managed migration tools
Finally, you might consider managed migration tools offered by some cloud providers. These tools automate and manage many aspects of the migration process, such as data transfer, replication, and minimization of downtime. These tools may be ideal if you’re looking to simplify the process while ensuring reliability.
Migration tools are not necessarily a silver bullet. Depending on the size of your database and the duration of the migration process, you may incur high costs for the service. In addition, managed tools may have less customizability, requiring you to still do the manual work of migrating over extensions or configurations.
Data transfer and security
When performing your migration, ensuring the secure and efficient transfer of data is essential. This means putting measures in place to protect your data integrity and confidentiality. Those measures include:
- Database backup: Before starting the migration, create a reliable backup of your database. Ensure the backup is encrypted, and store it securely. This backup will be your fail-safe, in case the migration does not go as planned. Even if your plan seems airtight and nothing could possibly go wrong… do not skip this step. Your future self will thank you.
- Data encryption: When transferring data between providers, use encryption to protect sensitive information from interception or tampering. Encrypt your data both at rest and in transit.
- Efficient transfer: Transferring large datasets can be network intensive, requiring a lot of bandwidth and time. However, you can make this process more efficient. Use compression techniques to reduce the size of the data to be transferred. For smaller databases, you might use a secure file transfer method such as SCP or SFTP. For larger ones, you might use a dedicated, high-throughput connection like AWS Direct Connect.
Network and availability connections
Along with database configurations, you’ll need to set up the network with your new cloud provider to ensure smooth connectivity. This includes configuring VPCs, firewall rules, and establishing peering between environments. Ideally, completing and validating these steps before the data migration is important.
To optimize performance, tune key connection settings like max_connections, shared_buffers, and work_mem. Start with the same settings as your source database. Then, after migration, adjust them based on your new infrastructure’s memory and network capabilities.
Lastly, configure failover and high availability in the target environment, potentially setting up replication or clustering to maintain uptime and reliability.
Downtime minimization and rollback planning
Minimizing downtime during a migration is crucial, especially for production databases. Your cutover strategy outlines the steps for switching from the source to target database with as little disruption as possible. Refer to the list you made when identifying dependencies, so you won’t overlook modifying the database connection for any application or service.
How much downtime to plan for depends on the migration strategy that you’ve chosen. Ensure that you’ve properly communicated with your teams and (if applicable) your end users, so that they can prepare for the database and all dependent services to be temporarily unavailable.
And remember: Even with the best plans, things can go wrong. It’s essential to have a clear rollback strategy. This will likely include reverting to a database backup and restoring the original environment. Test your rollback plan in advance as thoroughly as possible. If the time comes to execute, you’ll need to be able to execute it quickly and confidently.
Testing and validation
After the migration, but before you sound the all clear, you should test thoroughly to ensure everything functions as expected. Your tests should include:
- Data integrity checks, such as comparing row counts and using checksums to confirm that all data has transferred correctly and without corruption.
- Performance testing by running queries and monitoring key metrics, such as latency, throughput, and resource utilization. This will help you determine whether the new environment meets performance expectations or whether you’ll need to fine-tune certain settings.
- Application testing ensures any dependent services interact correctly with the new database. Test all your integrations to validate they perform seamlessly even with the new setup.
Post-migration considerations
With your migration complete, you can breathe a sigh of relief. However, there’s still work to do. Close the loop by taking care of the following:
- Optimize your Postgres setup for the new environment. This includes fine-tuning performance settings like indexing or query plans.
- Implement database monitoring, with tools to track performance and errors. Robust monitoring tools will help you catch potential issues and maintain visibility into database health.
- Update your backup and disaster recovery strategies, ensuring that everything is properly configured according to your new provider’s options. Test and review your recovery plans regularly.
Conclusion
Migrating your Postgres database between cloud providers can be a complex process. However, with proper planning and preparation, it’s entirely possible to experience a smooth execution.
By following the best practices and key steps above, you’ll be well on your way toward enjoying the benefits of leveraging Postgres from whatever cloud provider you choose.
To recap quickly, here are the major points to keep in mind:
- Pre-migration assessment: Evaluate your current setup, check for compatibility at your target provider, and identify dependencies for a seamless cutover.
- Migration strategy: Choose the approach that fits your database size and tolerance for downtime. In most cases, this will be the dump and restore strategy.
- Data transfer and security: Ensure you have reliable backups securely stored, and that all your data—from backups to migration data—is encrypted at rest and in transit.
- Network and availability connections: Don’t forget to port over any custom configurations, at both the database level and the network level, to your new environment.
- Testing and validation: Before you can declare the migration as complete, you should perform tests to verify data integrity, performance, and application compatibility.
- Post-migration considerations: After you’re up and running with your new provider, optimize performance, implement monitoring, and update your disaster recovery strategies.
Stay tuned for our upcoming guides, where we'll walk you through the specifics of migrating your Postgres database from various cloud providers to Heroku Postgres.
The post Planning Your PostgreSQL Migration: Best Practices and Key Considerations appeared first on Heroku.
]]>Open sourcing 12-Factor is an important milestone to take the industry forward and codify best practices for the future. As the modern app architecture reflected in the 12-Factors became mainstream, new technologies and ideas emerged, and we needed to bring more voices…
The post Heroku Open Sources the Twelve-Factor App Definition appeared first on Heroku.
]]>Open sourcing 12-Factor is an important milestone to take the industry forward and codify best practices for the future. As the modern app architecture reflected in the 12-Factors became mainstream, new technologies and ideas emerged, and we needed to bring more voices and experiences to the discussion.
Vish Abrams
Chief Architect, Heroku by Salesforce
We’re open sourcing Twelve-Factor because the principles were always meant to serve the broader software community, not just one company. Over time, SaaS went from a growing area of software delivery to the dominant distribution method for software and IaaS has overtaken data centers for infrastructure. The cloud is now the default.
At the same time the technology landscape changed. Containers and Kubernetes have done to the application layer what virtual machines did to servers and have spawned huge ecosystems and communities of their own focused on a new layer of app and infrastructure abstraction.
With these in mind, we looked at how to drive Twelve-Factor forward; to be even more relevant in the decades to come. Collectively we in the industry, end users and vendors, have learned so much from running apps and systems at scale over the past decade and it’s this collective knowledge that we need to codify to help the next wave of app teams be successful, faster, more easily. This movement is bigger than one company and to open it to an industry conversation, we are open sourcing it.
When I wrote Twelve Factor nearly 14 years ago, I never would have guessed these principles would remain relevant for so long, but cloud and backends have changed a lot since 2011! So it makes sense to turn Twelve-Factor into a community-maintained document that can evolve over time.
Adam Wiggins
Heroku Founder, now GM of Platform at The Browser Company
What does this mean for Heroku? We will continue to support Twelve-Factor as part of the community. The Heroku platform has always been an implementation of the Twelve-Factors to make the act of building and deploying apps easier, and this will continue to be the case as the Twelve-Factors evolves; Heroku will evolve.
We invite you to get to know the project vision, meet the maintainers, and participate in the project. Read more about the project and community on the Twelve-Factor blog.
The post Heroku Open Sources the Twelve-Factor App Definition appeared first on Heroku.
]]>The post Building Supercharged Agents with Heroku and Agentforce appeared first on Heroku.
]]>
Salesforce recently launched a new AI-driven technology, Agentforce, along with an array of prebuilt agents tailored to each role within Customer 360, from service to sales and various industries. Agentforce relies on discrete actions described to the AI engine, allowing it to interpret user questions and execute one or more actions (effectively coded functions) to deliver an answer.
However, some use cases require actions that are more customized to a specific business or workflow. In these situations, custom actions can be built using both code and low-code solutions, enabling developers to extend the range of actions available to Agentforce. Developers can utilize Apex or Flow, and if the necessary data resides within Salesforce, and the complexity and computational needs are minimal, both options are worth exploring first. However, if this is not the case, a Heroku custom action written in languages other than Apex can be added to Agentforce agents, as will be demonstrated in this blog post.
Introducing UltraConstruction, an Agentforce User
Let's take a look at a use case first. UltraConstruction, a 60-year-old company, uses Salesforce Sales and Service Cloud agents to handle customer inquiries. However, their older, unstructured invoices are stored in cloud archives, creating access challenges for their AI agents and leading to delays and customer frustration.

UltraConstruction’s Agentforce builders and developers have discovered that older invoice information is stored in cloud file archives in various unstructured formats, such as Microsoft Word, PDFs, and images. UltraConstruction does not need this information imported but requires it to be accessible by their agents.

UltraConstruction’s developers know that Java has a rich ecosystem of libraries to handle such formats, and that Heroku offers the vertical scalability needed to process and analyze the extracted data in real time. With the additional help of AI, they can make the action more flexible in terms of the queries it can handle—so they get coding! The custom Agentforce action they develop on Heroku accesses information without moving that data, and answers not only the above query but practically any other query that sales or service employees might encounter.

An Agentforce and Heroku Integration Blueprint
UltraConstruction’s use case can occur regardless of the type, age, location, size, or structure of the data. Even for data already residing in Salesforce, more intensive computational tasks such as analytics, transformations, or ad-hoc queries are possible using Heroku and its array of languages and elastic compute managed services. Before we dive into the UltraConstruction Agentforce action, let's review the overall approach to using Heroku with Agentforce.
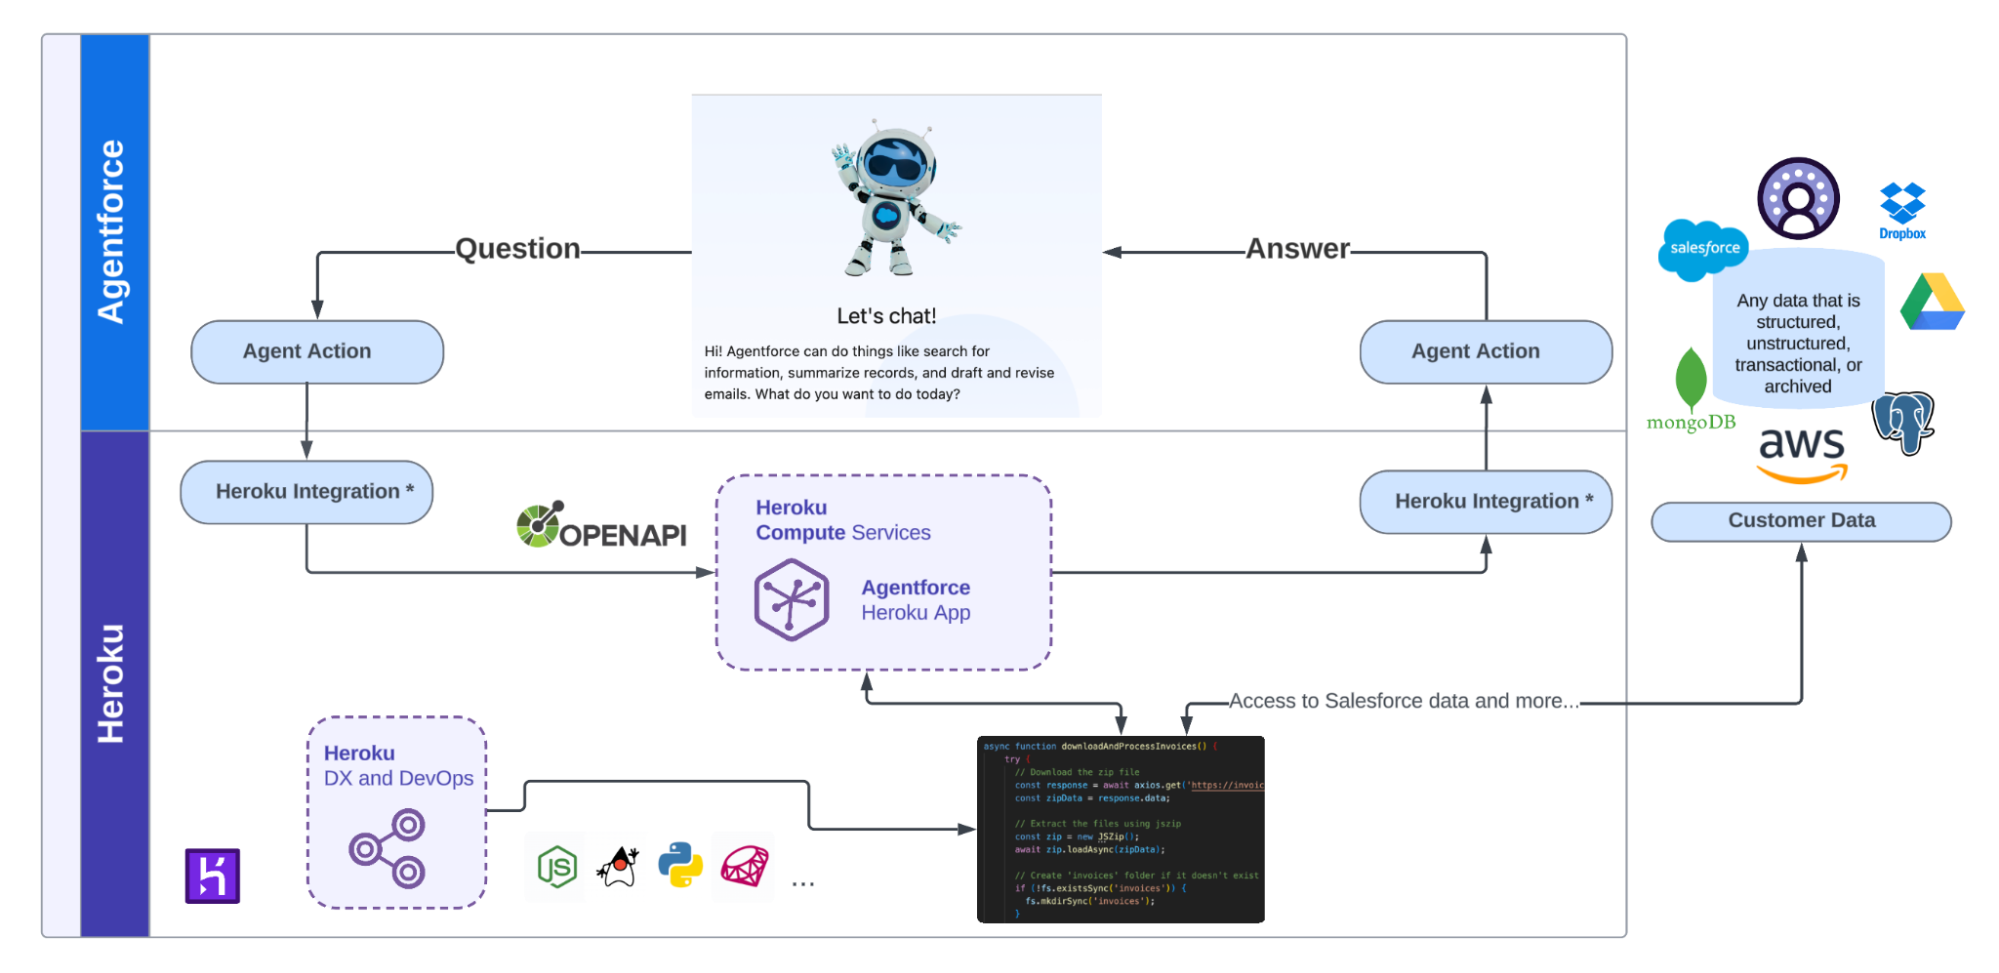
* Heroku Integration is currently available only in pilot mode and is not intended for production use. For more information, including alternative steps for deploying in production, please refer to this tutorial.
On the far right of the diagram above, we can see customer data depicted in various shapes, sizes, and locations, all of which can be accessed by Heroku-managed code on behalf of the agent. In the top half of the diagram, Agentforce manages which actions to use. Heroku-powered actions are exposed via External Services and later imported as an Agent Action via Agent Builder.
In the bottom half of the diagram, since External Services are used, the only requirement for the Heroku app is to support the OpenAPI standard to describe the app's API inputs and outputs, specifically the request and response of the action. Finally, keep in mind that Heroku applications can call out to other services, leverage Heroku add-ons, and utilize many industry programming languages with libraries that significantly speed up the development process.
A Sample Agentforce Heroku Action
Now that you know the use case and the general approach, in the following video and GitHub repository README file, you will be able to try this out for yourself! The action has been built to simulate the scenario that UltraConstruction found themselves in, with some aspects simplified to make the sample easier to understand and deploy. The following diagram highlights how the above blueprint was taken and expanded upon to build the required action.
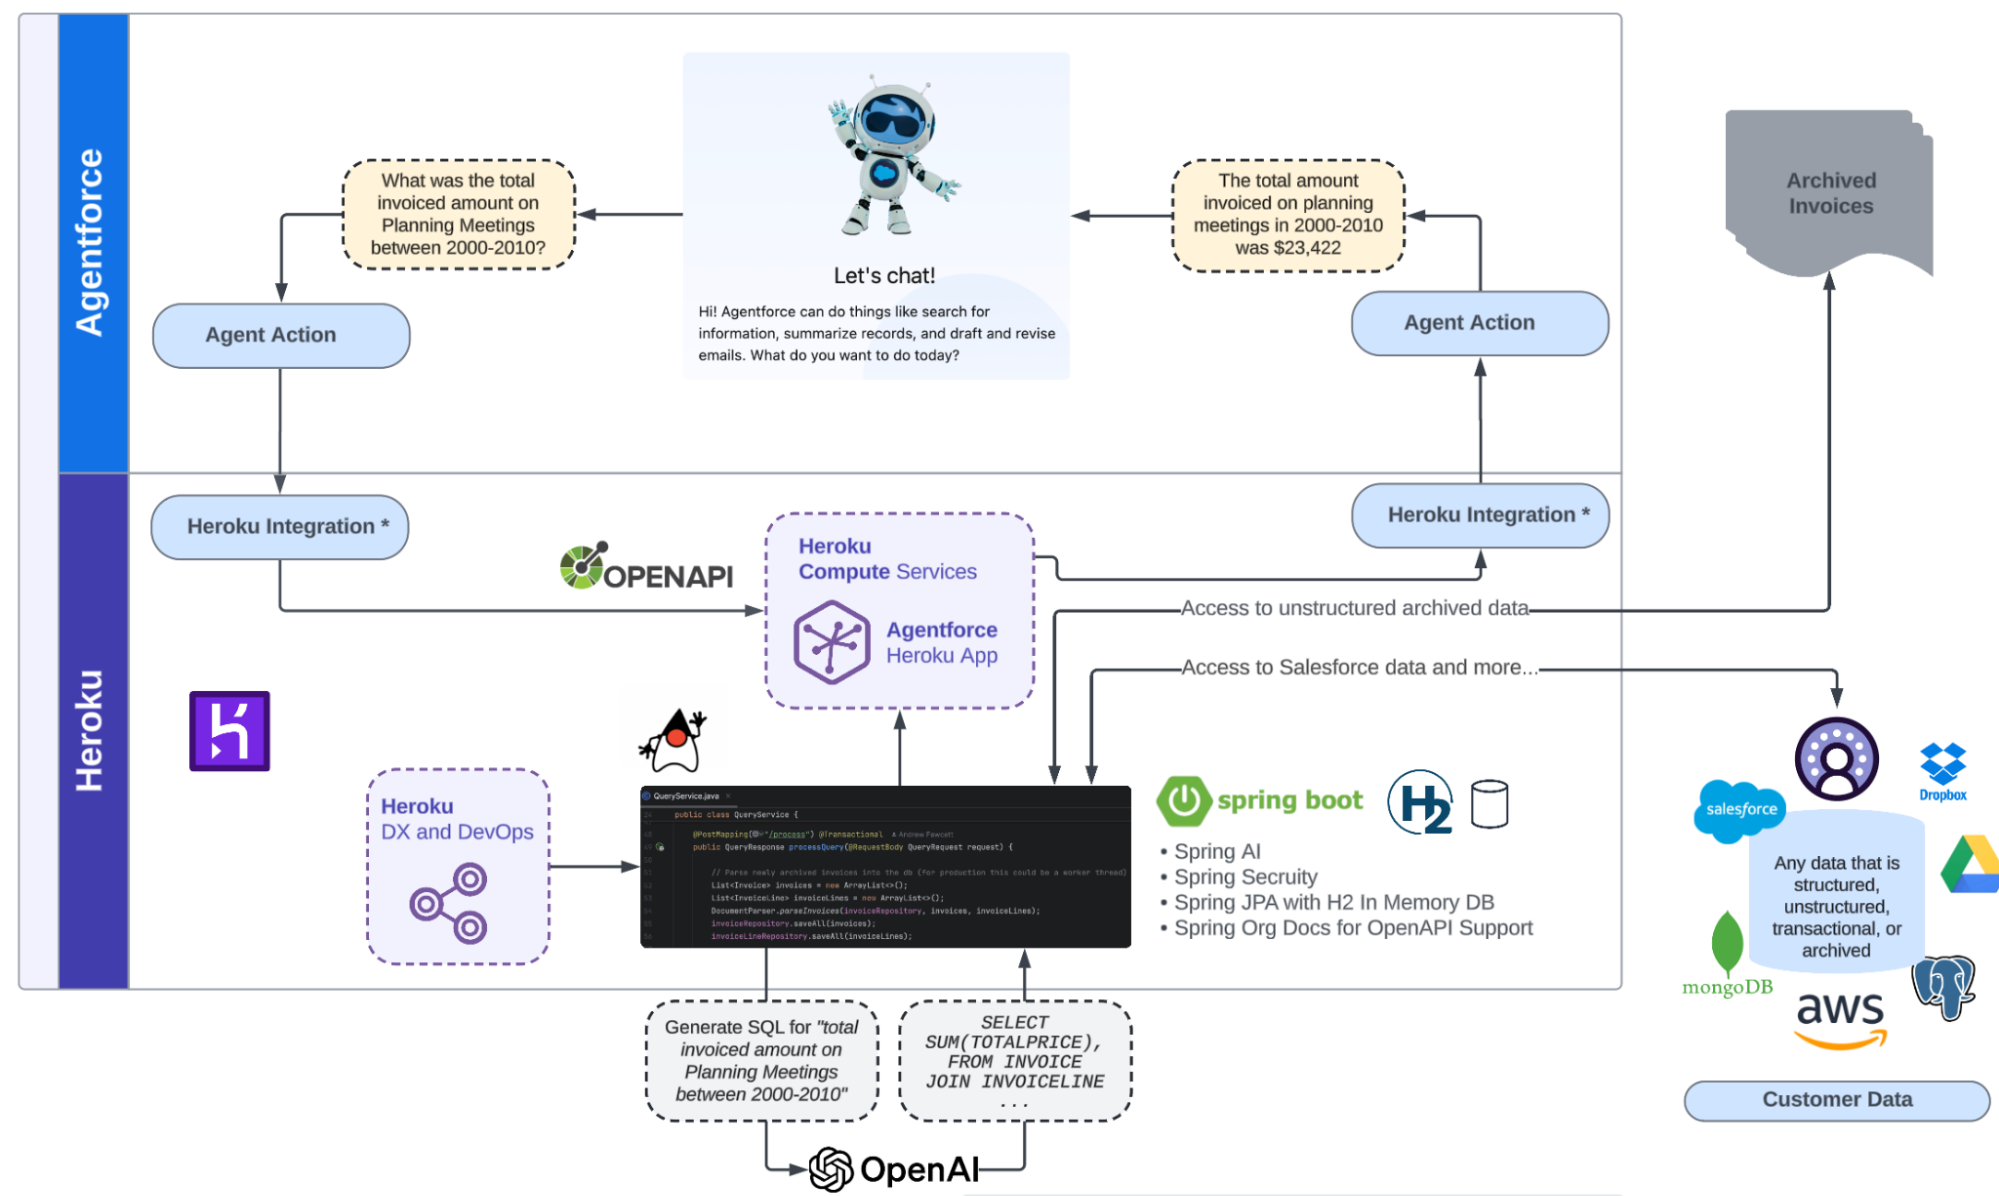
* Heroku Integration is currently available only in pilot mode and is not intended for production use. For more information, including alternative steps for deploying in production, please refer to this tutorial.
The primary changes to note are:
- Java, along with Spring Boot
The Spring framework offers a wide range of tools that make managing data, security, and calling AI LLMs (Large Language Models) very simple with minimal code. It supports both web and API-based applications. - H2 is a highly optimized in-memory database
Stores data from processed invoice documents in a relational form, ready for querying. - springdoc.org is used to generate an OpenAPI schema
Java is a strongly typed language, making it an excellent choice for building and defining APIs. This library requires minimal configuration for compliant OpenAPI APIs, which are required by External Services. - Spring AI has been used to simplify access to industry LLMs
Spring AI is easy to configure and often requires minimal coding—sometimes just one line of code—to tap into powerful LLMs, such as those provided by OpenAI and others. In this case, it is responsible for taking the natural language query entered into the Agentforce agent and converting it into SQL, which is run against the H2 database. The result of this query is then returned to Agentforce and integrated into a natural language response for the user.
If you're interested in viewing the code and a demonstration, you can watch the video below. When you're ready to deploy it yourself, review the deployment steps in the README.
Conclusion
Code is a powerful tool for integration, but keep in mind that Heroku also provides out-of-the-box integrations that bring Salesforce data closer to your application through Heroku Postgres and our Heroku Connect product. We also support integrations with Data Cloud. Heroku also offers pgvector as an extension to its managed Postgres offering, providing a world class vector database to support your retrieval augmented generation and semantic search needs. You can see it in action here. While this blog's customer scenario didn’t require these capabilities, other agent use cases may well benefit from these features, further boosting your agent actions! Last but not least, we at Heroku consider feedback a gift, so if you have broader ideas or feedback, please connect with us via the Heroku GitHub roadmap.
Updates
Since publishing this blog, we have released additional content we wanted to share.
- Introduction to the Heroku Integration Pilot for Developers. This video helps developers discover our new Heroku Integration feature, which brings Heroku applications directly into Salesforce orgs to extend Apex, Flow, Agentforce, and many other experiences with Heroku's elastic compute services. It also provides a new SDK experience for developers to access Salesforce data. This feature is currently in pilot and isn't generally available at this time; developers can request access through the signup forms included in the video description.
-
This step by step tutorial, available in Java and Python, will guide you through configuring an Agentforce Action deployed on Heroku within your Salesforce org. By the end, you will be able to ask Agentforce to generate your own badge, as shown below!

-
An additional demonstration video and sample code, diving deeper into how Heroku enhances Agentforce agents' capabilities. In this expanded version of the popular Coral Cloud Resort demo, vacationing guests can use Agentforce to browse and book unique experiences. With Heroku, the agent can even generate personalized adventure collages for each guest, showcasing how custom code on Heroku enables dynamic digital media creation directly within the Agentforce platform.

The post Building Supercharged Agents with Heroku and Agentforce appeared first on Heroku.
]]>Heroku gives you more than just a flexible and developer-friendly platform to run your cloud applications. You also get access to a suite of built-in observability features. Heroku's core application metrics, alerts, and language-specific runtime metrics offer a comprehensive view…
The post Best Practices for Optimizing Your Enterprise Cloud Applications with New Relic appeared first on Heroku.
]]>Heroku gives you more than just a flexible and developer-friendly platform to run your cloud applications. You also get access to a suite of built-in observability features. Heroku’s core application metrics, alerts, and language-specific runtime metrics offer a comprehensive view of your application’s performance across the entirety of your stack. With these features, you can monitor and respond to issues with speed.
In this article, we’ll look at these key observability features from Heroku. For specific use cases with more complexity, your enterprise might lean on supplemental features and more granular data from the New Relic add-on. We’ll explore those possibilities as well.
At the end of the day, robust observability is a must-have for your enterprise cloud applications. Let’s dive into how Heroku gives you what you need.
Application Metrics
Heroku provides several application-level metrics to help you investigate issues and perform effective root cause analysis. For web dynos (isolated, virtualized containers), Heroku gives you easy access to response time and throughput metrics.
- Response time metrics include the median, 95th percentile, and 99th percentile times, offering a clear picture of how quickly the application responds under typical and extreme conditions.
- Throughput metrics are broken down by HTTP status codes, helping you identify traffic patterns and pinpoint areas where requests may be failing.
Across all dynos types (except eco), Heroku gathers memory usage and dyno load metrics.
- Memory usage metrics include data on total memory, RSS (resident set size), and swap usage. These are vital for understanding how efficiently your application uses memory and whether it’s at risk of exceeding memory quotas and triggering errors.
- Dyno load measures the load on the container’s CPU, providing a view into how many processes are competing for time — a signal of whether your application is overburdened or not.
These metrics are crucial for root cause analysis. As you examine trends and spikes in these metrics, you can identify bottlenecks and inefficiencies, preemptively addressing potential failures before they escalate. Whether you’re seeing a surge of slow response times or an anomalous increase in memory usage, these metrics guide developers in tracing the problem back to its source. Equipped with these metrics, your enterprise can ensure faster and more effective issue resolution.
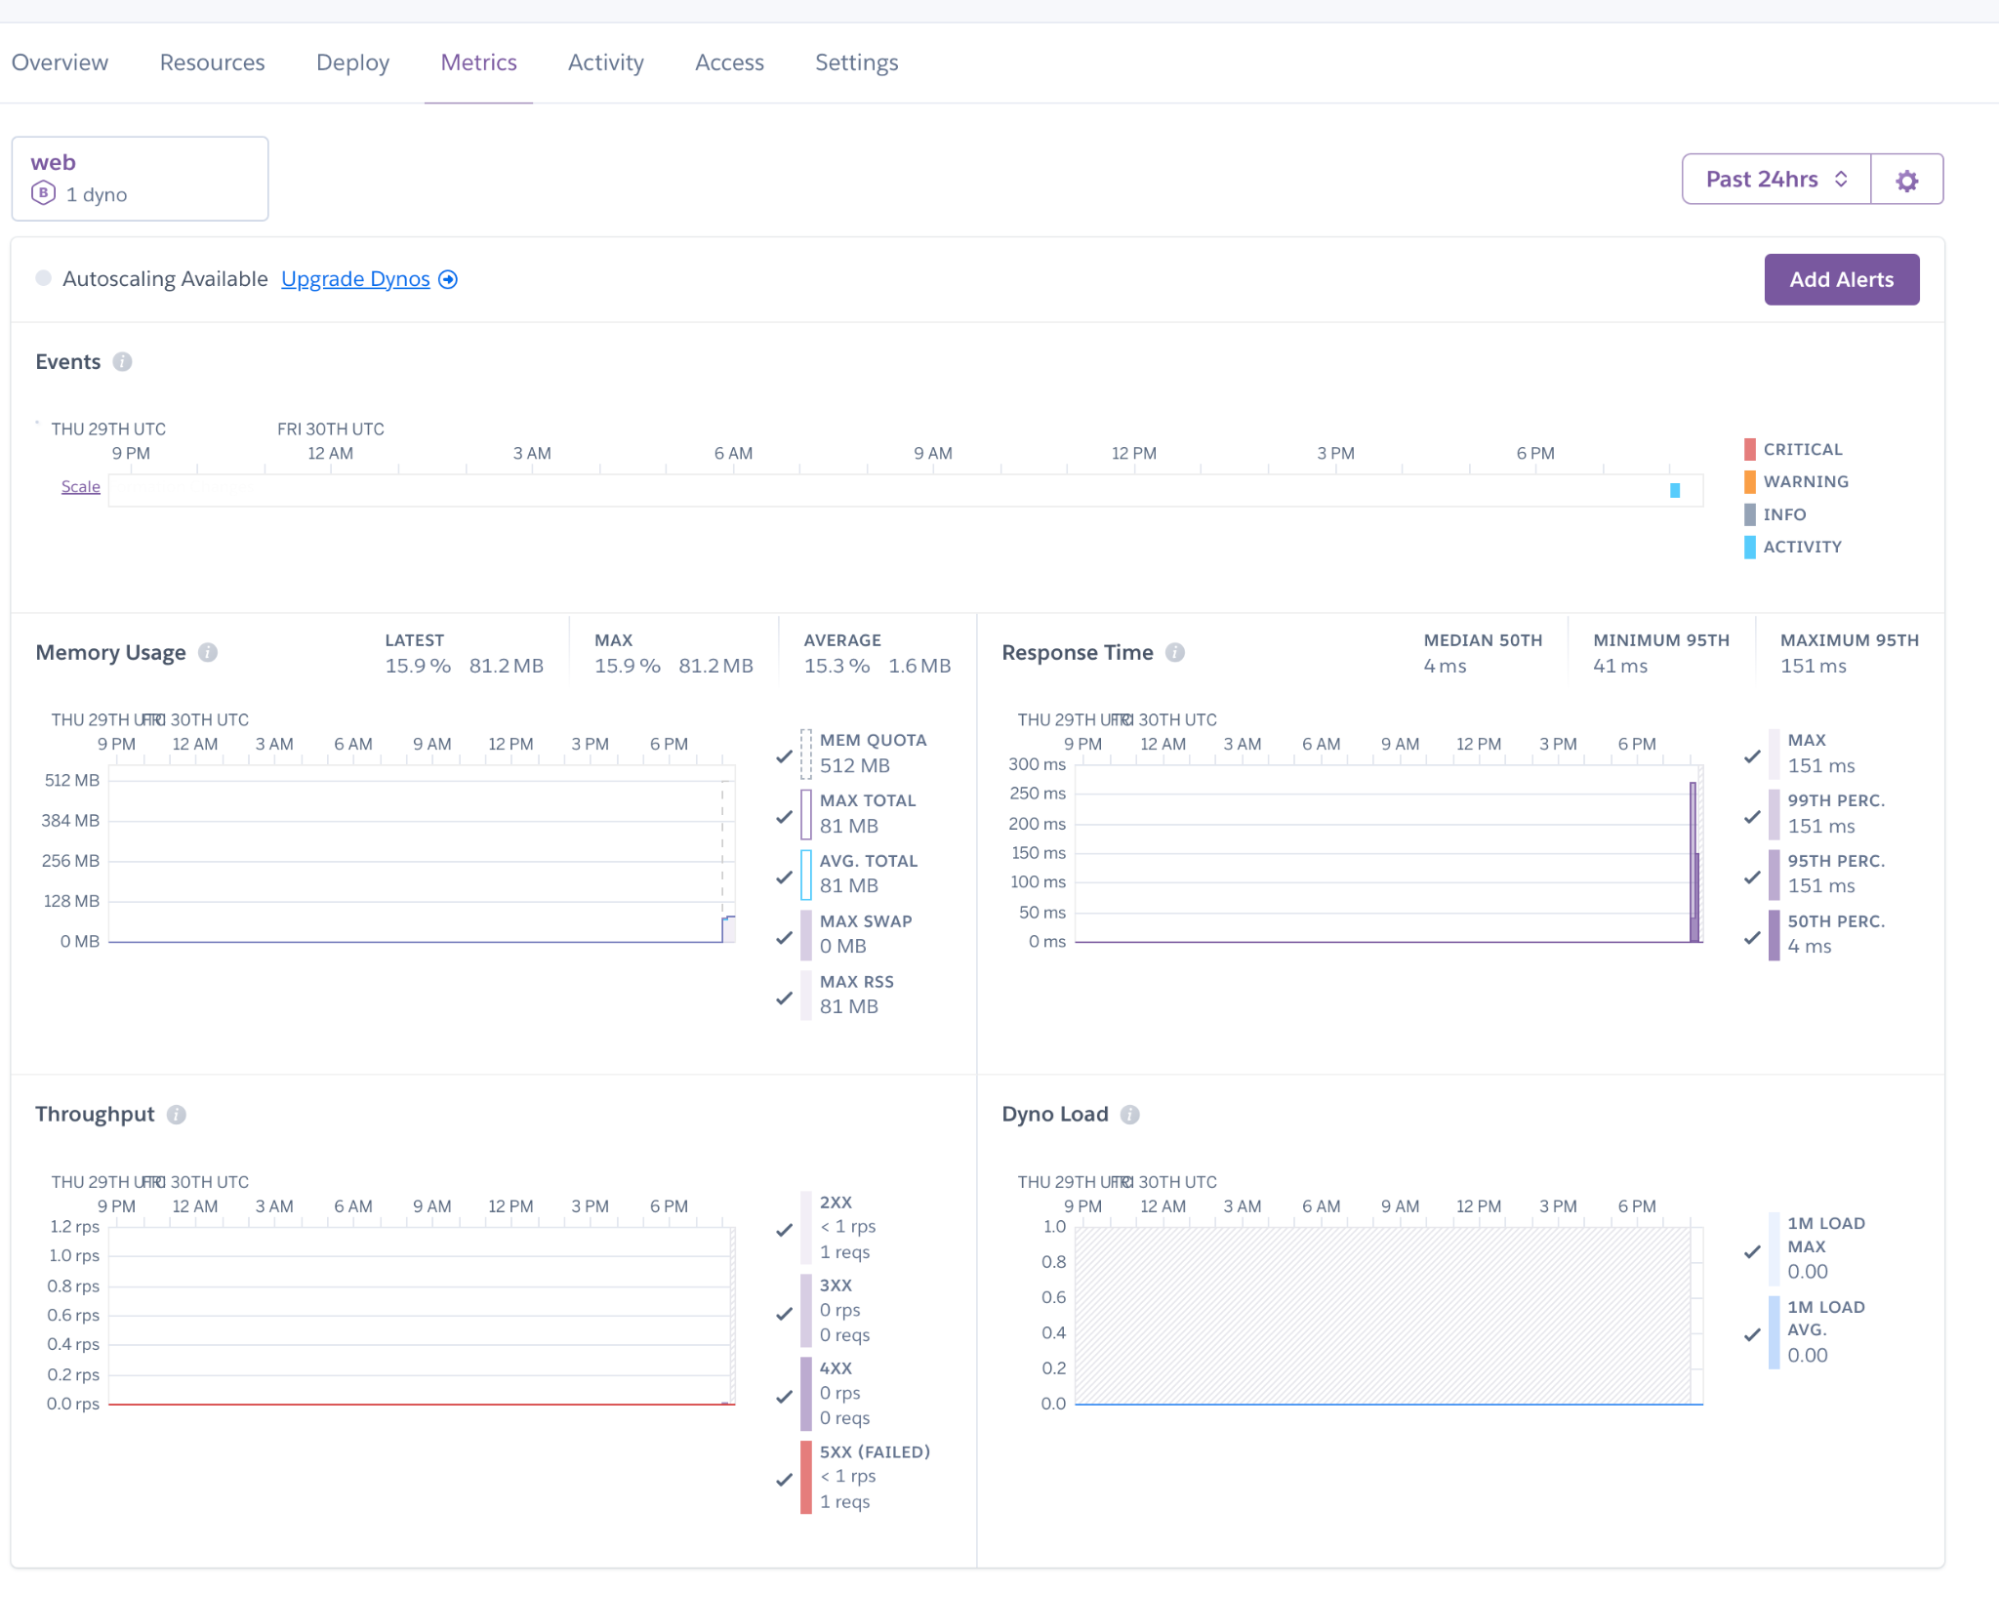
Threshold Alerting
Threshold alerting allows you to set specific thresholds for critical application metrics. When your application exceeds these thresholds, alerts are automatically triggered, and you’re notified of potential issues before they escalate into major problems. With alerts, you can take a proactive approach to maintaining application performance and reliability.
This is particularly useful for keeping an eye on response time, memory usage, and CPU load. By setting appropriate thresholds, you ensure that your application operates within its optimal parameters to prevent resource exhaustion and maintain performance.
Threshold alerting is available exclusively for Heroku’s professional-tier dynos (Standard-1X, Standard-2X, and all Performance dynos).

Language Runtime Metrics
Heroku provides detailed insights into memory usage by offering language-specific runtime metrics for applications running on JVM, Go, Node.js, or Ruby. Metrics include:
- JVM applications: Heap memory usage and garbage collection times.
- Go applications: Memory stack, coroutines, and garbage collection statistics.
- Node.js and Ruby applications: Heap and non-heap memory usage breakdowns.
These insights are crucial for developers in identifying memory leaks, optimizing performance, and ensuring efficient resource utilization. Understanding how memory is consumed allows developers to fine-tune their applications and avoid memory-related crashes. By tapping into these metrics, you can maintain smoother, more reliable performance.
These metrics are available on all dynos (except eco), using the supported languages.
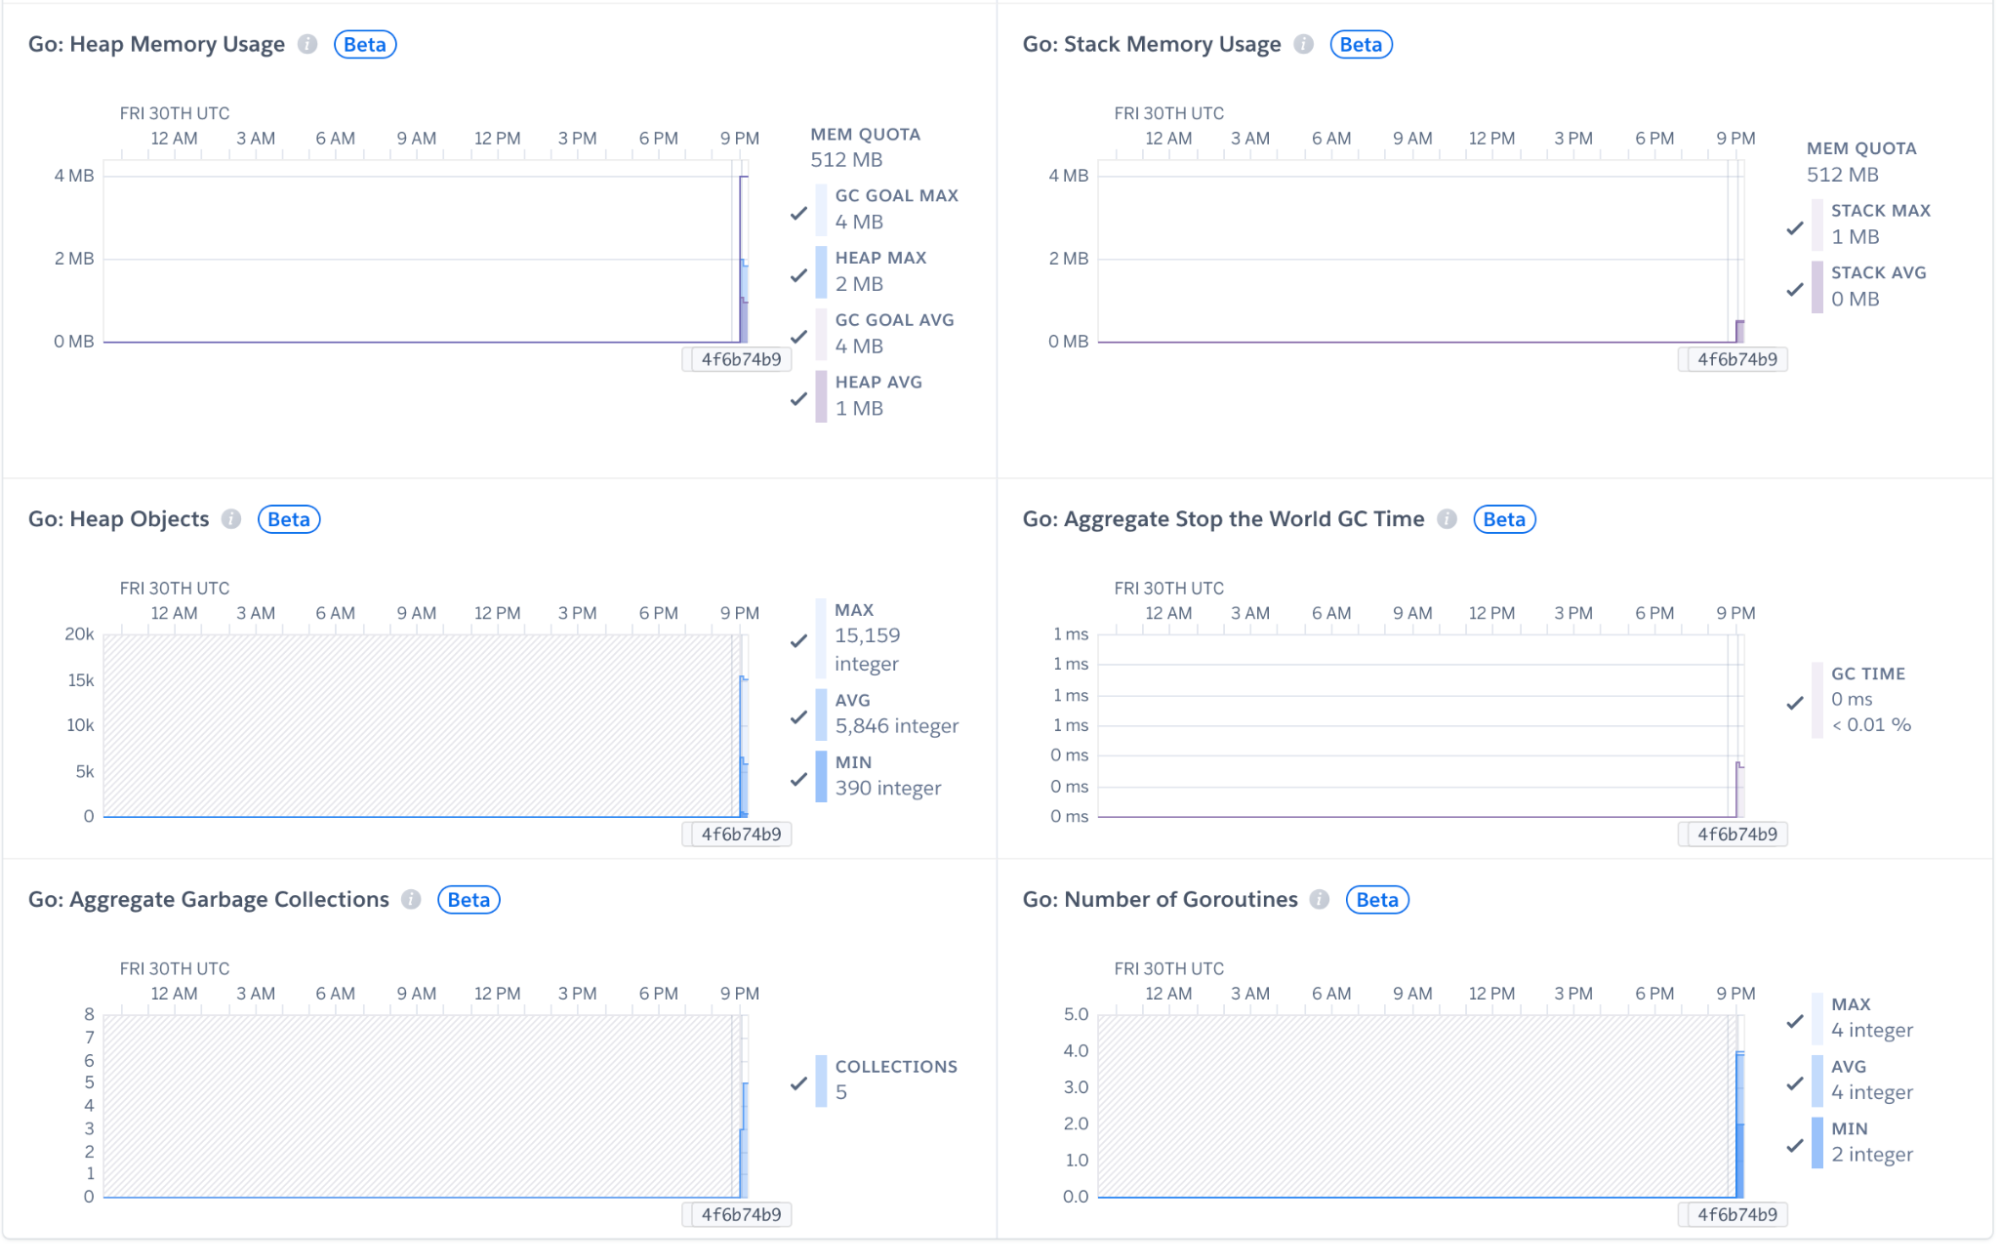
To utilize these features, first enable them in your Heroku account. Then, import the appropriate library within your applications’ build and redeploy.
Heroku and New Relic for the Win
In most cases, the above observability features give you enough information to troubleshoot and optimize your cloud applications. However, in more complex situations, you may want an additional boost through a dedicated application performance monitoring (APM) solution such as New Relic. Heroku offers the New Relic APM add-on, which lets you track detailed performance metrics, monitor application health, and diagnose issues with real-time data and insights.
Key features from New Relic include:
- Code-level diagnostics: Allows developers to identify problematic areas in their code that may be causing performance bottlenecks. This helps in optimizing the application and ensuring lower latency user experiences.
- Transaction tracing: Provides visibility into the life cycle of each transaction within the application. Trace requests from start to finish, pinpointing delays or errors that may occur during specific processes.
- Customizable instrumentation: Enables developers to tailor the monitoring and data collection to their specific needs, providing more granular insights and control over application performance
Features such as these enable more effective troubleshooting and optimization, helping you ensure that your applications run efficiently even under heavy load.
The New Relic APM add-on integrates seamlessly with your application, automatically capturing detailed performance data. With the add-on installed, you can:
- Regularly review transaction traces to identify slow-performing transactions.
- Use error analytics to monitor and address issues in real time.
- Leverage detailed diagnostics to continuously improve the application’s performance.
Connecting your application to New Relic agents is straightforward. You simply install a New Relic library in your codebase and redeploy. The APM solution’s advanced features also allow for more fine-grained control of the data you’re sending. In addition to monitoring application state and metrics, you can also use it to monitor logs and infrastructure.
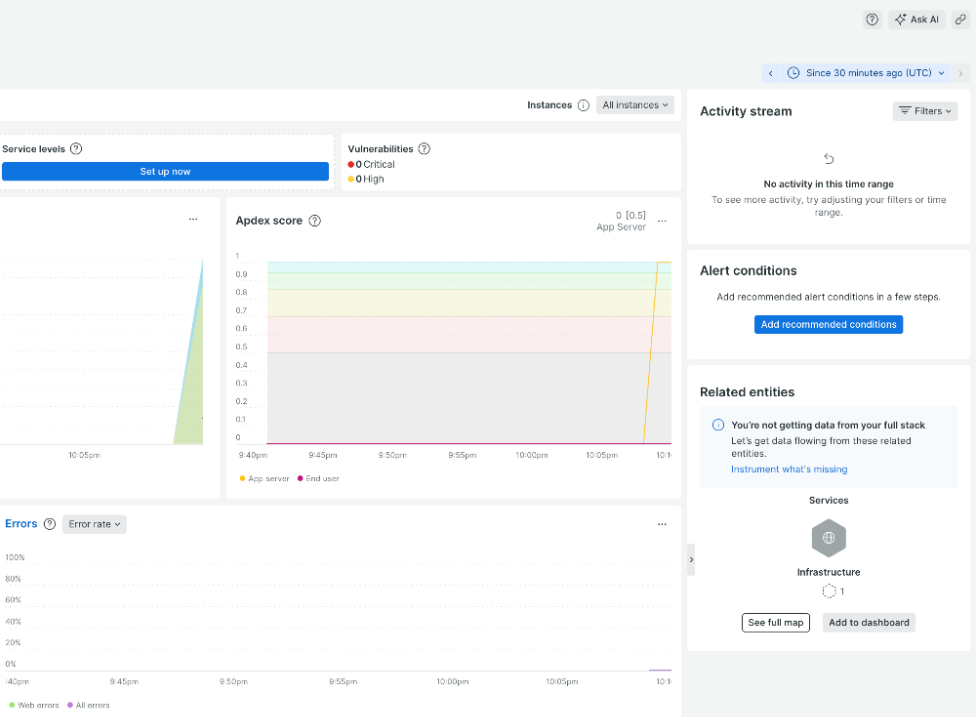

Conclusion
In this blog, we’ve explored the advanced observability features from Heroku along with the additional power offered by the New Relic APM add-on. Heroku’s observability features alone provide the metrics and alerting capabilities that can go a long way toward safeguarding your deployments and customers’ experience. New Relic further enhances observability with its APM capabilities, such as code-level diagnostics and transaction tracing.
Staying proactive with cloud application observability is key to maintaining enterprise application efficiency. Robust observability helps you ensure that your applications are running smoothly, and it also enables you to handle unexpected challenges. With a strong observability solution, you gain insights that help you sustain application performance and deliver a superior user experience.
To learn more about enterprise observability, read more about the features Heroku Enterprise has to offer, or contact us to help you get started.
The post Best Practices for Optimizing Your Enterprise Cloud Applications with New Relic appeared first on Heroku.
]]>The post Electron on Heroku appeared first on Heroku.
]]>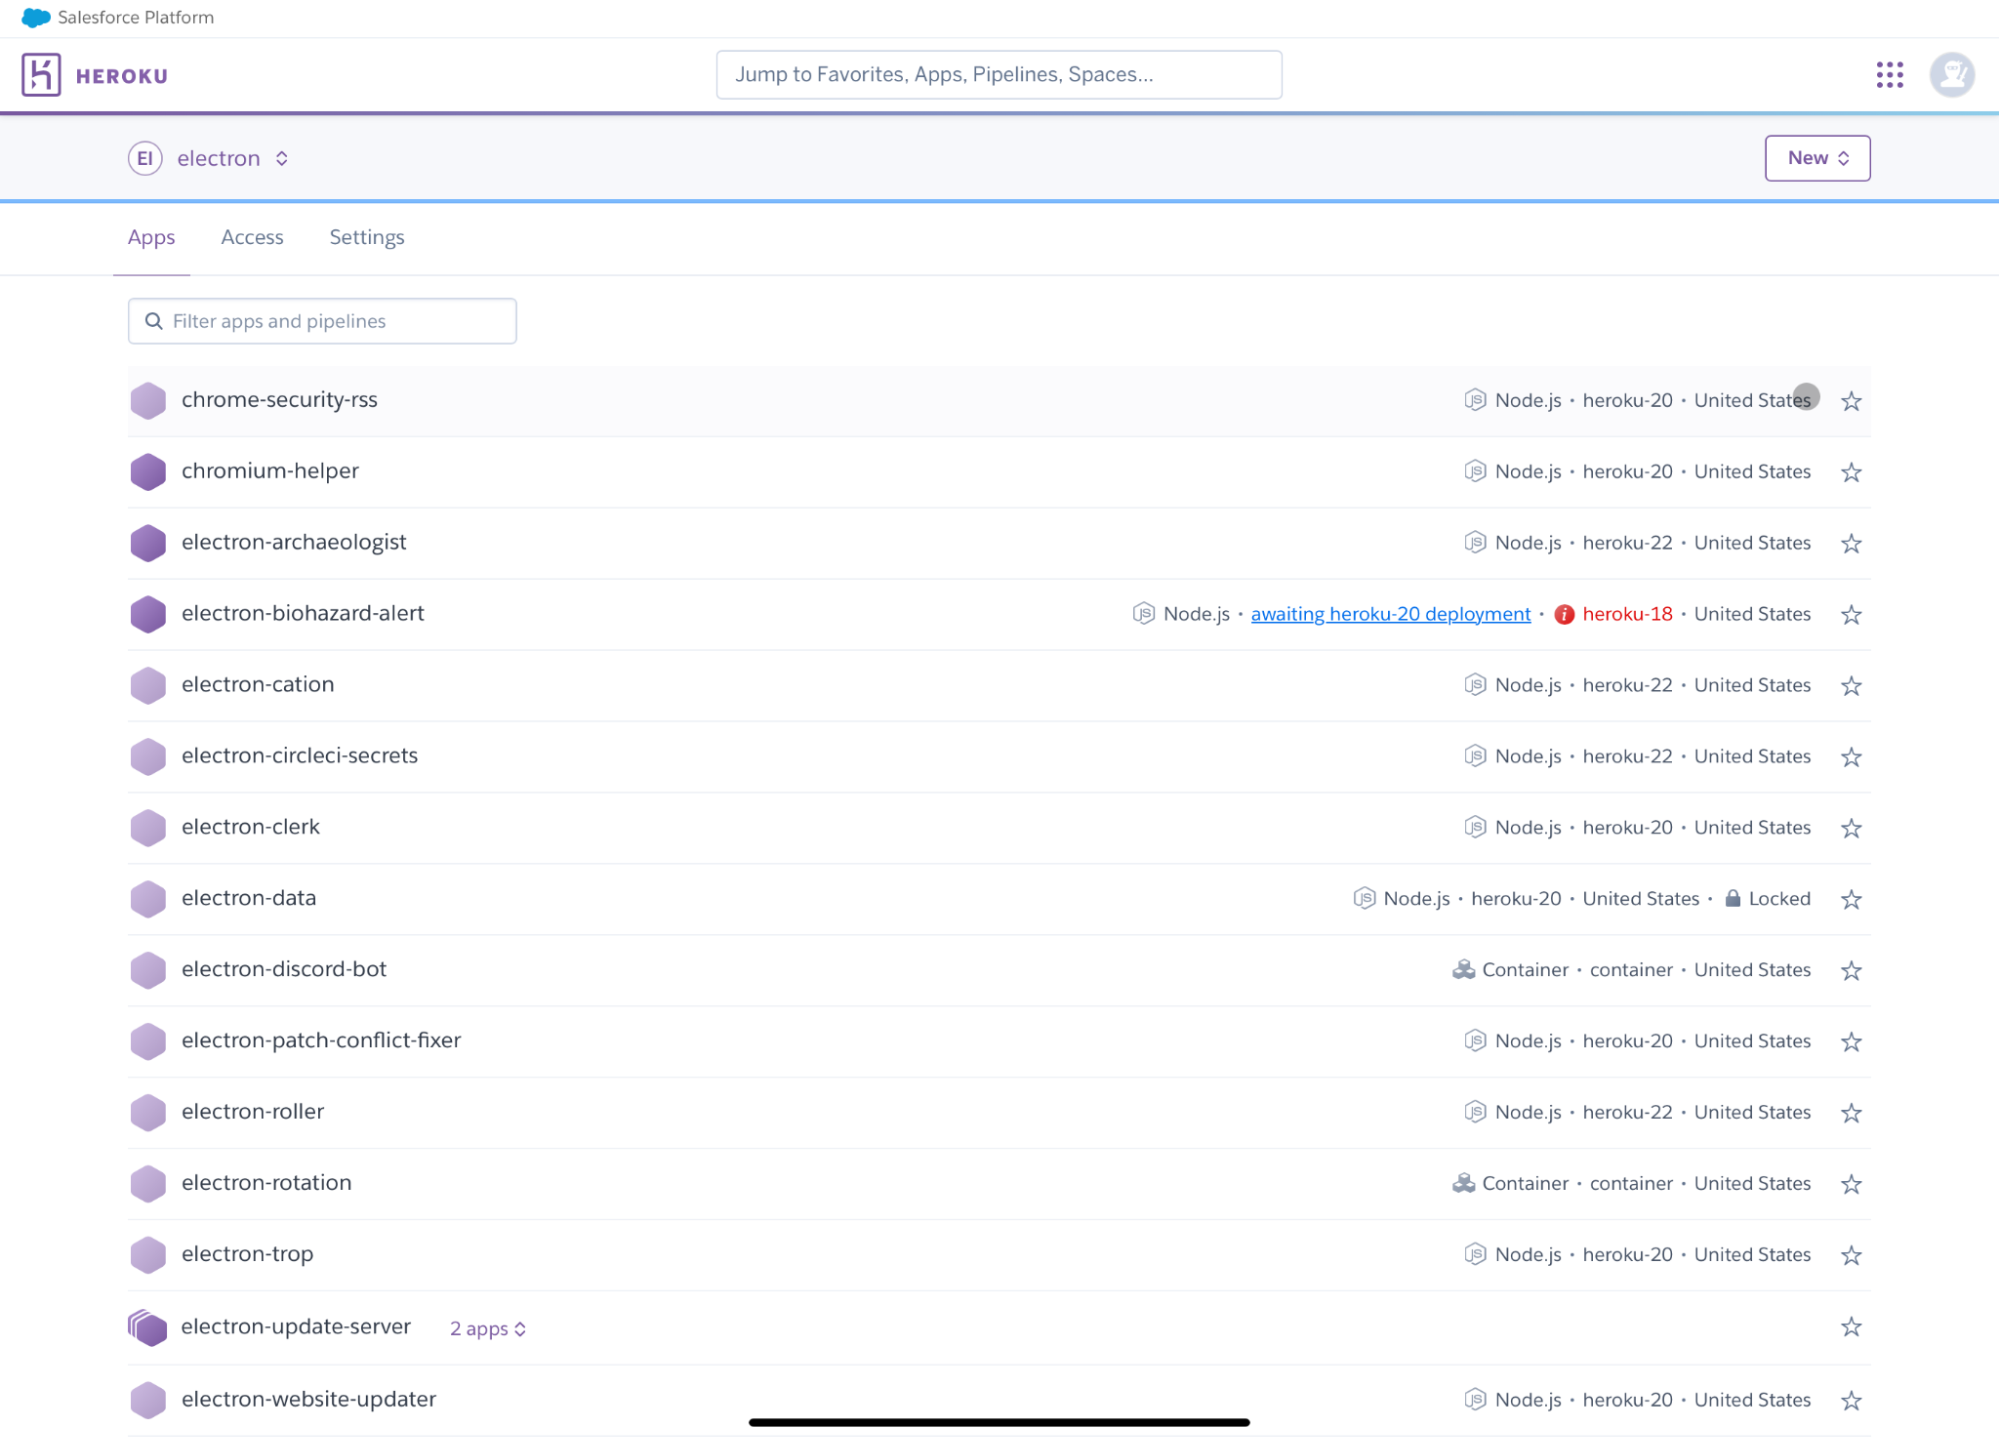
A sip from the fire hose: Electron’s update service
Updating desktop software is tricky: Unlike websites, which you can update simply by pushing new code to your server — or mobile apps, which you can update using the app stores, desktop apps usually need to update themselves. This process requires a cloud service that serves information about the latest versions as well as the actual binaries themselves.
To make that easier, Electron offers a free update service powered by Heroku and GitHub Releases. You can add it to your app by visiting update.electronjs.org. The underlying Heroku service is a humble little Node.js app, hosted inside a single web Dyno, but serves consistently more than 100 requests per second in less than 1ms response time, using less than 100MB of memory. In other words, we’re serving at peak almost half a million requests per hour with nothing but the default Procfile.
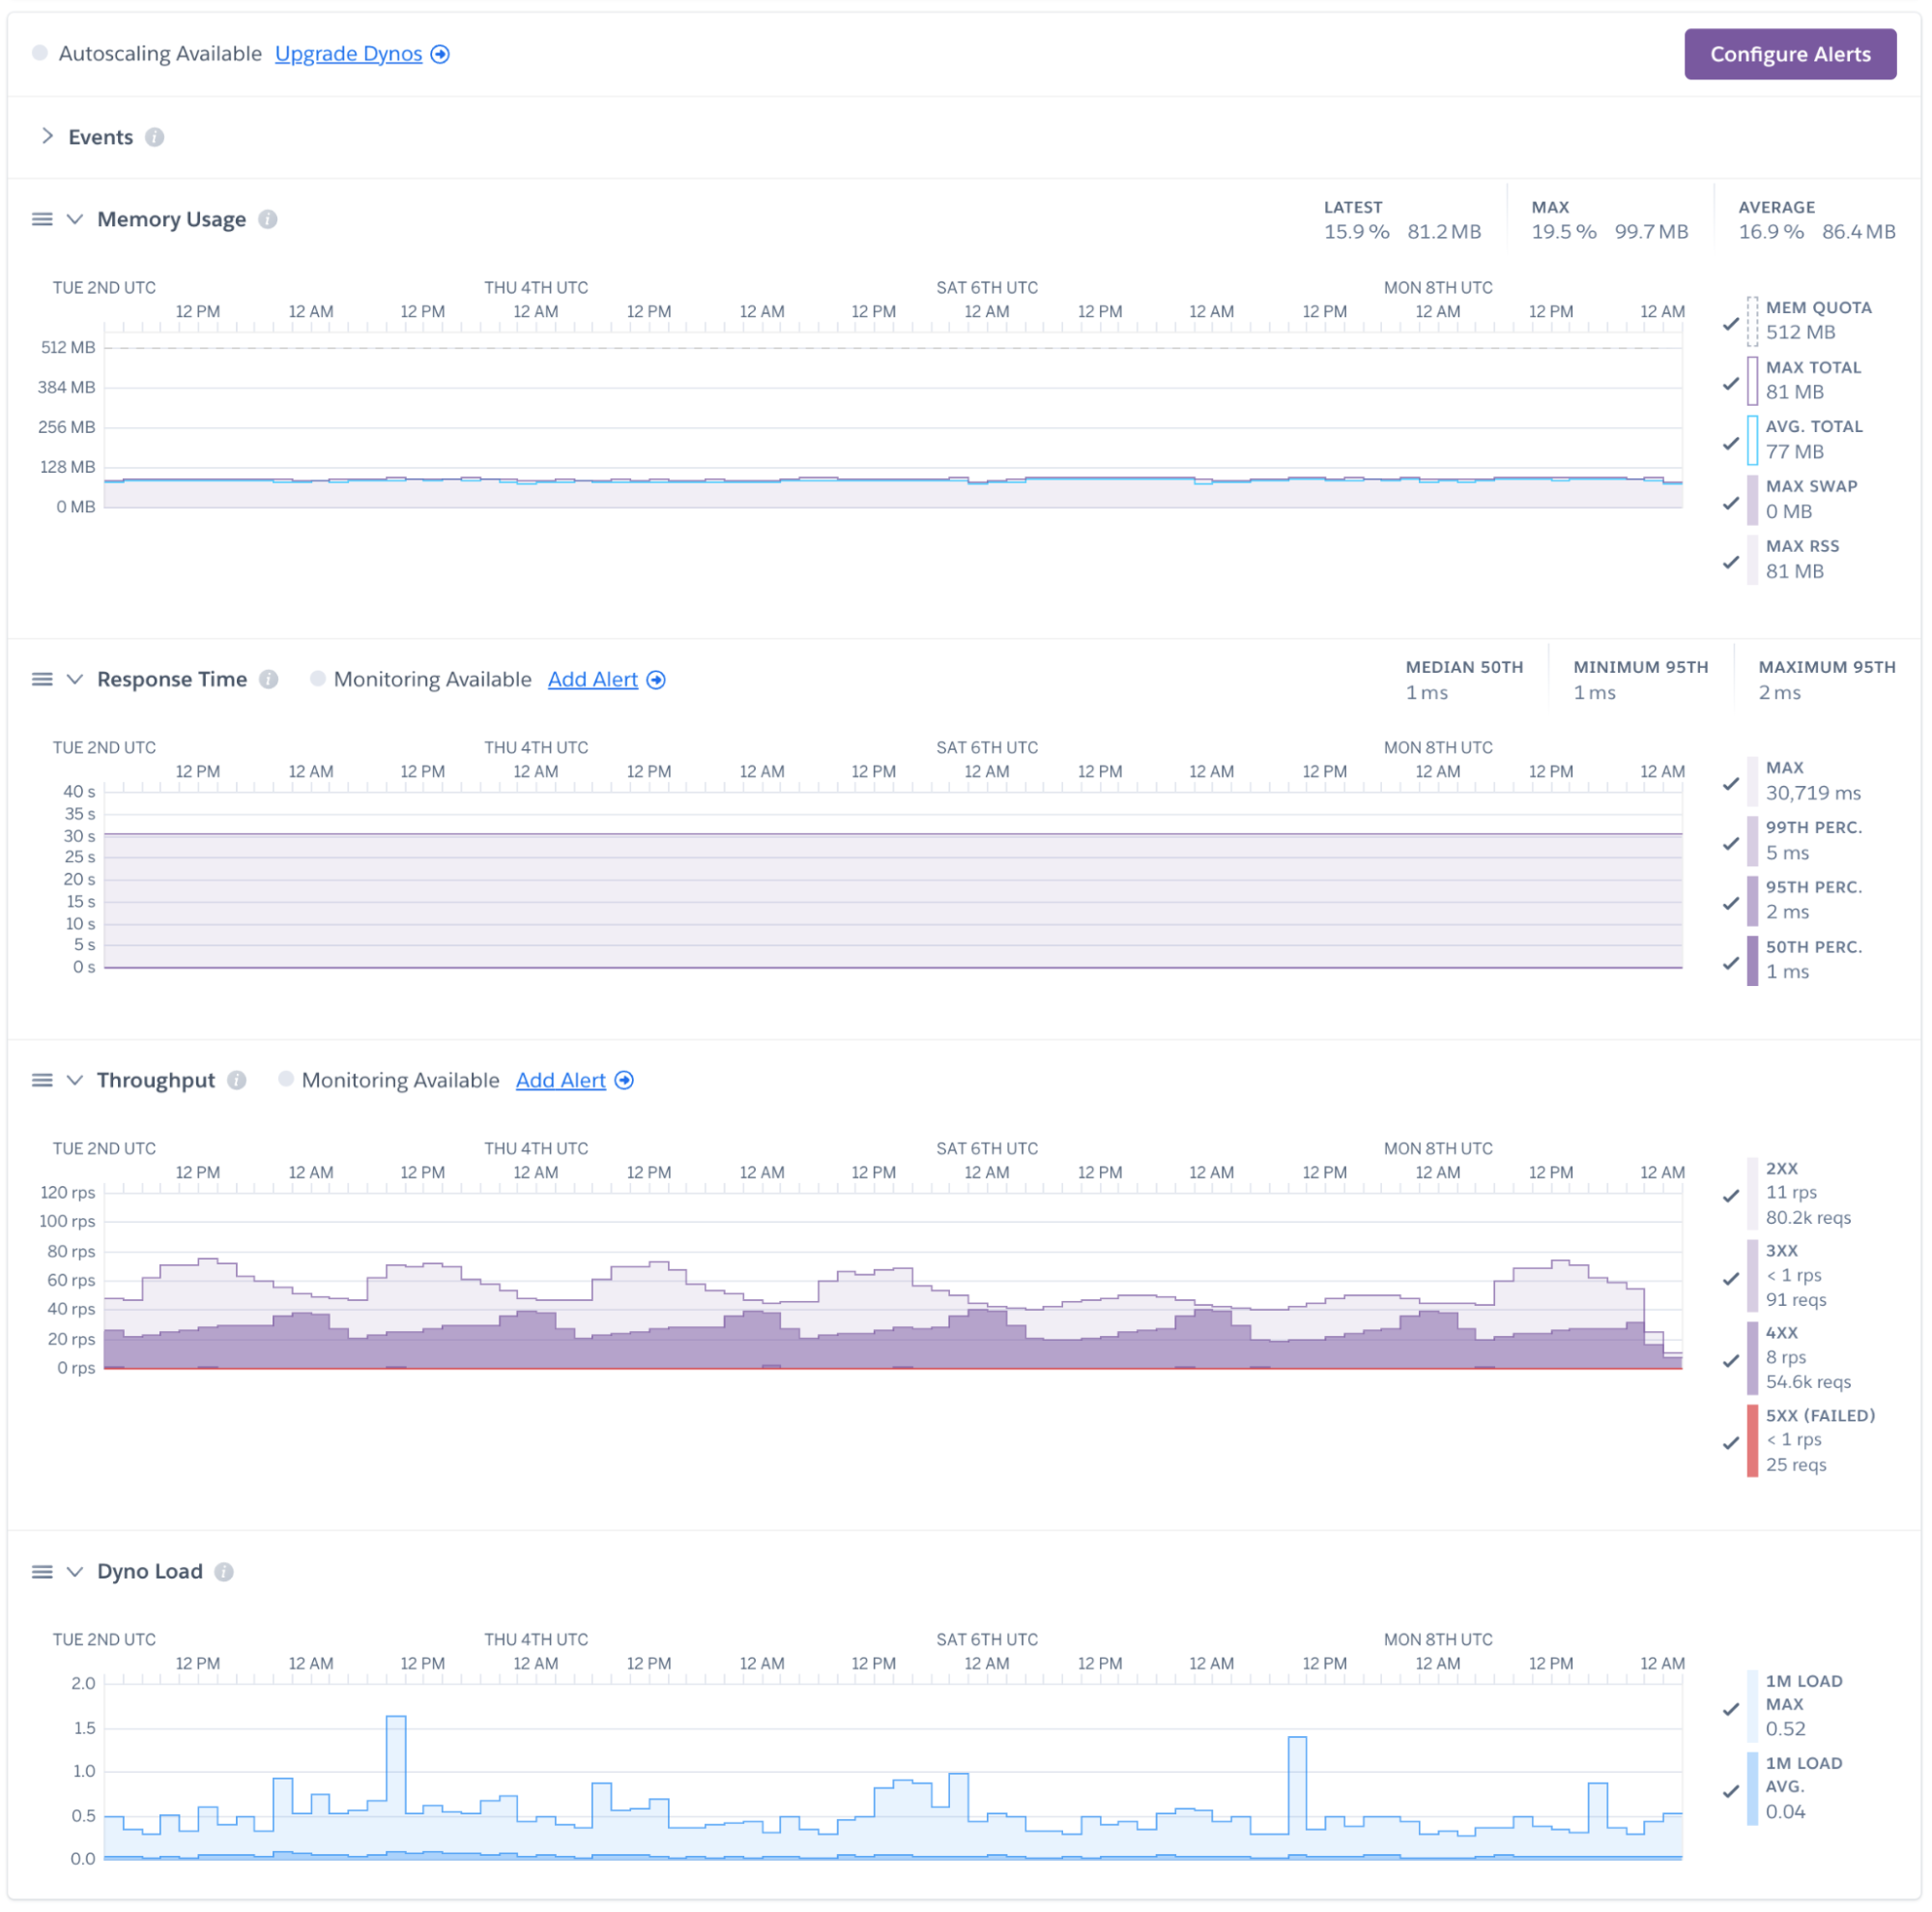
We’re using a simple staging/production pipeline and Heroku Data for Redis as a lightweight data store. In other words, we’re benefiting from sensible defaults — the fact that Heroku doesn’t have us setup or manage keeping this service online means that we didn’t really have to look at it in 2024. It works, allowing us to focus on the things that don’t.
Making Slack a little better for us
Like most open source projects, Electron needs to be constantly mindful of its most limited resource: The time of its maintainers. To make our work easier, we’re making heavy use of bots and automation wherever possible. Those bots run on Heroku, since we ideally want to set them up and never think about them again.
Take the slack-chromium-helper as an example: If you send a URL to a Chromium Developer Resource in Slack, this bot will fetch the content of that resource and automatically unfurl it.

To build this bot, we used Slack’s own @slack/bolt framework. On the Heroku side, no custom configuration is necessary: We’re using a basic web dyno, which automatically runs npm install, npm build, and npm start. The attached data store is Heroku Postgres on the “essential” plan. In other words, we’re getting a persistent, fully-managed data store for cents.
Here too, the main feature of Heroku to us is that it “just works”: We can use the tools we’re familiar with, write an automation that saves us time when working in Slack, and don’t have to worry about long-term maintenance. We’re thankful that we never have to think about upgrading a server operating system.
GitHub, Automated
Many PRs opened against electron/electron are actually made by our bots — the most important one being electron/roller, which automatically attempts to update our major dependencies, Node.js and Chromium. So far, our bot has opened more than 400 PRs — like this one, bumping our Node.js version to v20.15, updating the release notes, and adding labels to power subsequent automation.
The bot is, once again, powered by a Node.js app running on a Heroku web dyno. It uses the popular GitHub Probot framework to automatically respond to closed pull requests and new issues comments. To make sure that it automatically attempts to perform updates, we’re using Heroku Scheduler, which calls scripts on our app daily.
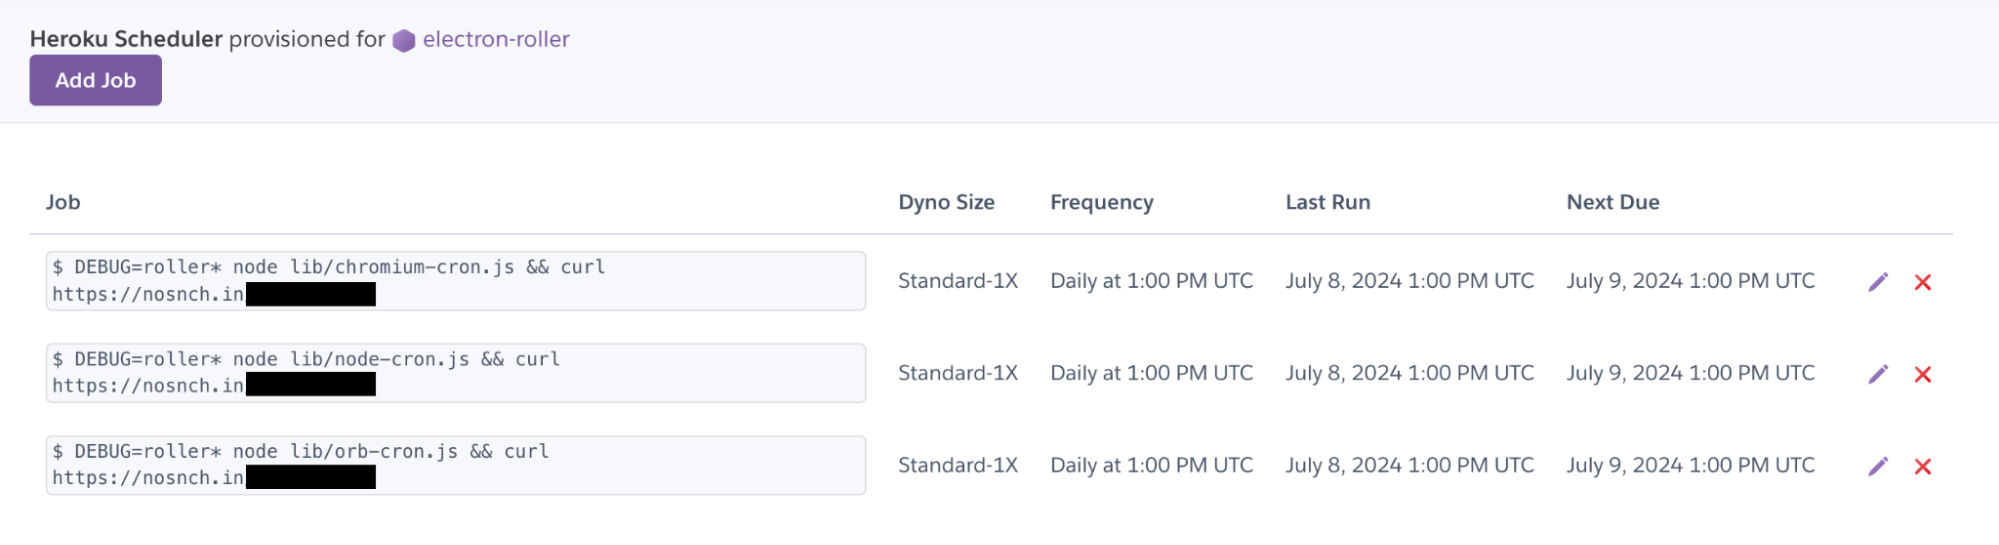
Platform as a Service
If you’d ask the Electron maintainers about Heroku, we’d tell you that we don’t think about it that much. We organize our work by focusing on the features that need to be built the most, the bugs that need to be fixed first, and the tooling changes we need to make to make the lives of Electron app developers as easy as possible.
For us, Heroku just works. We can quickly spin up web services, bots, and automations using the tools we like the most — in our case, Node.js apps, developed on GitHub, paired with straightforward data stores. Thanks to easy SSO integration, the entire group has the access they need without giving anyone too much power.
That is what we like the most about Heroku: How it works. We like it as much as we like electricity coming out of our sockets: Essential to the work that we do, yet never a headache or a problem that needs to be solved.
We’d like to thank Heroku and Salesforce for being such strong supporters of open source technologies, their contributions to the ecosystem, and in the case of Electron, their direct contribution towards delightful desktop software.
The post Electron on Heroku appeared first on Heroku.
]]>We are thrilled to announce that Heroku Automated Certificate Management (ACM) now supports wildcard domains for the Common Runtime!
Heroku ACM’s support for wildcard domains streamlines your cloud management by allowing Heroku’s Certificate management to cover all your desired subdomains with only one command, reducing networking setup overhead and providing more flexibility while enhancing the overall security of your applications.
This highly-requested feature request is here, and in this blog post, we'll dive into what wildcard domains are, why you should use them, and the new possibilities this support brings to Heroku ACM.
The post Simplify Your Cloud Security: Heroku ACM Now Supports Wildcard Domains appeared first on Heroku.
]]>
We are thrilled to announce that Heroku Automated Certificate Management (ACM) now supports wildcard domains for the Common Runtime!
Heroku ACM’s support for wildcard domains streamlines your cloud management by allowing Heroku’s Certificate management to cover all your desired subdomains with only one command, reducing networking setup overhead and providing more flexibility while enhancing the overall security of your applications.
This highly-requested feature request is here, and in this blog post, we'll dive into what wildcard domains are, why you should use them, and the new possibilities this support brings to Heroku ACM.
What’s a Wildcard Domain and Why Should I Use It?
A wildcard domain is a domain that includes a wildcard character (an asterisk, *) in place of a subdomain. For example, *.example.com is a wildcard domain that can cover www.example.com, blog.example.com, shop.example.com, and any other subdomain of example.com.
Using wildcard domains offers several benefits:
-
Simplified Management: Instead of managing individual certificates for each subdomain, a single wildcard certificate can cover all subdomains, reducing administrative overhead.
-
Cost Efficiency: Wildcard certificates can be more cost-effective than purchasing individual certificates for each subdomain.
-
Flexibility: Wildcard domains provide the flexibility to add new subdomains without issuing a new certificate each time.
What Can I Now Do with Heroku ACM Since It’s Supported?
With the new support for wildcard domains in Heroku ACM, you can now:
-
Easily Secure Multiple Subdomains: Automatically secure all your subdomains with a single wildcard certificate. This is particularly useful for applications that dynamically generate subdomains.
-
Streamline Certificate Management: Reduce the complexity of managing multiple certificates. Heroku ACM will handle the issuance, renewal, and management of your wildcard certificates, just as it does with regular certificates.
-
Enhance Security: Ensure that all your subdomains are consistently protected with HTTPS, improving the overall security posture of your applications.
How to use your Wildcard Domain with Heroku ACM
Previously, you would've seen an error messaging when trying to add a wildcard domain with Heroku ACM enabled, or when trying to enable Heroku ACM when your app was associated to a wildcard domain.
Now, you can follow the typical steps to add a custom domain to your Heroku app using the following command:
$ heroku domains:add *.example.com -a example-app
Once the domain is added, you can enable Heroku ACM using the following command:
$ heroku certs:auto:enable
And just like that, you can utilize your wildcard domain and still all of your certificates managed by Heroku!
Wildcard Domain Support for Private Spaces
At the time of this post, Wildcard Domain support in Heroku ACM is only available for our Common Runtime Customers.
Support for Wildcard Domains for Private Spaces will be coming soon as part of our focus on improving the entire Private Spaces platform. You can find more details about that project on our GitHub Public Roadmap.
Conclusion
The addition of wildcard domain support to Heroku ACM significantly enhances our platform's networking capabilities. Heroku is committed to making it easier to manage and secure your application's incoming and outgoing networking connections. This change, along with our recent addition of HTTP/2 and our new router are all related to the investment Heroku is making to modernize our feature offerings.
This change was driven by feedback from the Heroku Public GitHub roadmap. We encourage you to keep an eye on our where you can see the features we are working on and provide your input. Your feedback is invaluable and helps shape the future of Heroku.
The post Simplify Your Cloud Security: Heroku ACM Now Supports Wildcard Domains appeared first on Heroku.
]]>Ideally, end-to-end tests in your browser are automated and integrated into your CI pipeline. Every time you commit a code change, your tests will run. Passing tests gives you the confidence that the application — as your end users experience it —…
The post Testing a React App in Chrome with Heroku CI appeared first on Heroku.
]]>Ideally, end-to-end tests in your browser are automated and integrated into your CI pipeline. Every time you commit a code change, your tests will run. Passing tests gives you the confidence that the application — as your end users experience it — behaves as expected.
With Heroku CI, you can run end-to-end tests with headless Chrome. The Chrome for Testing Heroku Buildpack installs Google Chrome Browser (chrome) and chromedriver in a Heroku app. You can learn more about this Heroku Buildpack in a recent post.
In this article, we’ll walk through the simple steps for using this Heroku Buildpack to perform basic end-to-end testing for a React application in Heroku CI.
Brief Introduction to our React App
Since this is a simple walkthrough, we’ve built a very simple React application, consisting of a single page with a link and a form. The form has a text input and a submit button. When the user enters their name in the text input and submits the form, the page displays a simple greeting with the name included.
It looks like this:
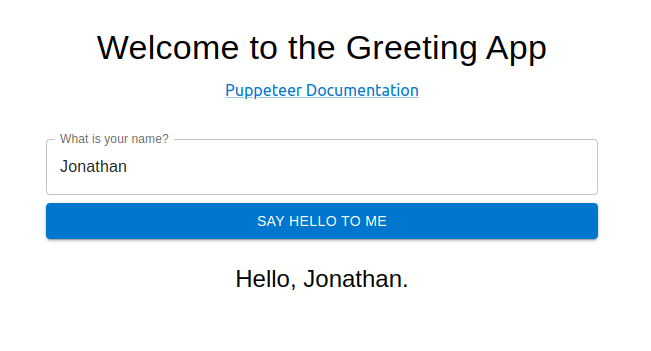

Super simple, right? What we want to focus on, however, are end-to-end tests that validate the end-user experience for the application. To test our application, we use Jest (a popular JavaScript testing framework) and Puppeteer (a library for running headless browser testing in either Chrome or Firefox).
If you want to download the simple source code and tests for this application, you can check out this GitHub repository.
The code for this simple page is in src/App.js:
import React, { useState } from 'react';
import { Container, Box, TextField, Button, Typography, Link } from '@mui/material';
function App() {
  const [name, setName] = useState('');
  const [greeting, setGreeting] = useState('');
  const handleSubmit = (e) => {
    e.preventDefault();
    setGreeting(`Nice to meet you, ${name}!`);
  };
  return (
    <Container maxWidth="sm" style={{ marginTop: '50px' }}>
      <Box textAlign="center">
        <Typography variant="h4" gutterBottom>
          Welcome to the Greeting App
        </Typography>
        <Link href="https://pptr.dev/" rel="noopener">
          Puppeteer Documentation
        </Link>
        <Box component="form" onSubmit={handleSubmit} mt={3}>
          <TextField
            name="name"
            label="What is your name?"
            variant="outlined"
            fullWidth
            value={name}
            onChange={(e) => setName(e.target.value)}
            margin="normal"
          />
          <Button variant="contained" color="primary" type="submit" fullWidth>
            Say hello to me
          </Button>
        </Box>
        {greeting && (
          <Typography id="greeting" variant="h5" mt={3}>
            {greeting}
          </Typography>
        )}
      </Box>
    </Container>
  );
}
export default App;
Running In-Browser End-to-End Tests Locally
Our simple set of tests is in a file called src/tests/puppeteer.test.js. The file contents look like this:
const ROOT_URL = 'https://localhost:8080';
describe('Page tests', () => {
  const inputSelector = 'input[name="name"]';
  const submitButtonSelector = 'button[type="submit"]';
  const greetingSelector = 'h5#greeting';
  const name = 'John Doe';
  beforeEach(async () => {
    await page.goto(ROOT_URL);
  });
  describe('Puppeteer link', () => {
    it('should navigate to Puppeteer documentation page', async () => {
      await page.click('a[href="https://pptr.dev/"]');
      await expect(page.title()).resolves.toMatch('Puppeteer | Puppeteer');
    });
  });
  describe('Text input', () => {
    it('should display the entered text in the text input', async () => {
      await page.type(inputSelector, name);
      // Verify the input value
      const inputValue = await page.$eval(inputSelector, el => el.value);
      expect(inputValue).toBe(name);
    });
  });
  describe('Form submission', () => {
    it('should display the "Hello, X" message after form submission', async () => {
      const expectedGreeting = `Hello, ${name}.`;
      await page.type(inputSelector, name);
      await page.click(submitButtonSelector);
      await page.waitForSelector(greetingSelector);
      const greetingText = await page.$eval(greetingSelector, el => el.textContent);
      expect(greetingText).toBe(expectedGreeting);
    });
  });
});
Let’s highlight a few things from our testing code above:
- We’ve told Puppeteer to expect an instance of the React application to be up and running at `https://localhost:8080`. For each test in our suite, we direct the Puppeteer `page` to visit that URL.
- We test the link at the top of our page, ensuring that a link click redirects the browser to the correct external page (in this case, the Puppeteer Documentation page).
- We test the text input, verifying that a value entered into the field is retained as the input value.
- We test the form submission, verifying that the correct greeting is displayed after the user submits the form with a value in the text input.
The tests are simple, but they are enough to demonstrate how headless in-browser testing ought to work.
### Minor modifications to `package.json`
We bootstrapped this app by using [Create React App](https://create-react-app.dev/). However, we made some modifications to our `package.json` file just to make our development and testing process smoother. First, we modified the `start` script to look like this:
```language-bash
"start": "PORT=8080 BROWSER=none react-scripts start"
Notice that we specified the port that we want our React application to run on (8080) We also set BROWSER=none, to prevent the opening of a browser with our application every time we run this script. We won’t need this, especially as we move to headless testing in a CI pipeline.
We also have our test script, which simply runs jest:
"test": "jest"
Start up the server and run tests
Let’s spin up our server and run our tests. In one terminal, we start the server:
~/project$ npm run start
Compiled successfully!
You can now view project in the browser.
  Local:            https://localhost:8080
  On Your Network:  https://192.168.86.203:8080
Note that the development build is not optimized.
To create a production build, use npm run build.
webpack compiled successfully
With our React application running and available at https://localhost:8080, we run our end-to-end tests in a separate terminal:
~/project$ npm run test
 FAIL  src/tests/puppeteer.test.js
  Page tests
    Puppeteer link
      ✓ should navigate to Puppeteer documentation page (473 ms)
    Text input
      ✓ should display the entered text in the text input (268 ms)
    Form submission
      ✕ should display the "Hello, X" message after form submission (139 ms)
  ● Page tests › Form submission › should display the "Hello, X" message after form submission
    expect(received).toBe(expected) // Object.is equality
    Expected: "Hello, John Doe."
    Received: "Nice to meet you, John Doe!"
      36 |       await page.waitForSelector(greetingSelector);
      37 |       const greetingText = await page.$eval(greetingSelector, el => el.textContent);
    > 38 |       expect(greetingText).toBe(expectedGreeting);
         |                            ^
      39 |     });
      40 |   });
      41 | });
      at Object.toBe (src/tests/puppeteer.test.js:38:28)
Test Suites: 1 failed, 1 total
Tests:       1 failed, 2 passed, 3 total
Snapshots:   0 total
Time:        1.385 s, estimated 2 s
Ran all test suites.
And… we have a failing test. It looks like our greeting message is wrong. We fix our code in App.js and then run our tests again.
~/project$ npm run test
> project@0.1.0 test
> jest
 PASS  src/tests/puppeteer.test.js
  Page tests
    Puppeteer link
      ✓ should navigate to Puppeteer documentation page (567 ms)
    Text input
      ✓ should display the entered text in the text input (260 ms)
    Form submission
      ✓ should display the "Hello, X" message after form submission (153 ms)
Test Suites: 1 passed, 1 total
Tests:       3 passed, 3 total
Snapshots:   0 total
Time:        1.425 s, estimated 2 s
Ran all test suites.
Combine server startup and test execution
We’ve fixed our code, and our tests are passing. However, starting up the server and running tests should be a single process, especially as we intend to run this in a CI pipeline. To serialize these two steps, we’ll use the start-server-and-test package. With this package, we can use a single script command to start our server, wait for the URL to be ready, and then run our tests. Then, when the test run finishes, it stops the server.
We install the package and then add a new line to the scripts in our package.json file:
"test:ci": "start-server-and-test start https://localhost:8080 test"
Now, running npm run test:ci invokes the start-server-and-test package to first start up the server by running the start script, waiting for https://localhost:8080 to be available, and then running the test script.
Here is what it looks like to run this command in a single terminal window:
~/project$ npm run test:ci
> project@0.1.0 test:ci
> start-server-and-test start https://localhost:8080 test
1: starting server using command "npm run start"
and when url "[ 'https://localhost:8080' ]" is responding with HTTP status code 200 running tests using command "npm run test"
> project@0.1.0 start
> PORT=8080 BROWSER=none react-scripts start
Starting the development server...
Compiled successfully!
You can now view project in the browser.
 Local:            https://localhost:8080
 On Your Network:  https://172.16.35.18:8080
Note that the development build is not optimized.
To create a production build, use npm run build.
webpack compiled successfully
> project@0.1.0 test
> jest
 PASS  src/tests/puppeteer.test.js
 Page tests
   Puppeteer link
     ✓ should navigate to Puppeteer documentation page (1461 ms)
   Text input
     ✓ should display the entered text in the text input (725 ms)
   Form submission
     ✓ should display the "Hello, X" message after form submission (441 ms)
Test Suites: 1 passed, 1 total
Tests:       3 passed, 3 total
Snapshots:   0 total
Time:        4.66 s
Ran all test suites.
Now, our streamlined testing process runs with a single command. We’re ready to try our headless browser testing with Heroku CI.
Running Our Tests in Heroku CI
Getting our testing process up and running in Heroku CI requires only a few simple steps.
Add app.json file
We need to add a file to our code repository. The file, app.json, is in our project root folder. It looks like this:
{
  "environments": {
    "test": {
      "buildpacks": [
        { "url": "heroku-community/chrome-for-testing" },
        { "url": "heroku/nodejs" }
      ],
      "scripts": {
        "test": "npm run test:ci"
      }
    }
  }
}
In this file, we specify the buildpacks that we will need for our project. We make sure to add the Chrome for Testing buildpack and the Node.js buildpack. Then, we specify what we want Heroku’s execution of a test script command to do. In our case, we want Heroku to run the test:ci script we’ve defined in our package.json file.
Create a Heroku pipeline
In the Heroku dashboard, we click New ⇾ Create new pipeline.

We give our pipeline a name, and then we search for and select the GitHub repository that will be associated with our pipeline. You can fork our demo repo, and then use your fork for your pipeline.
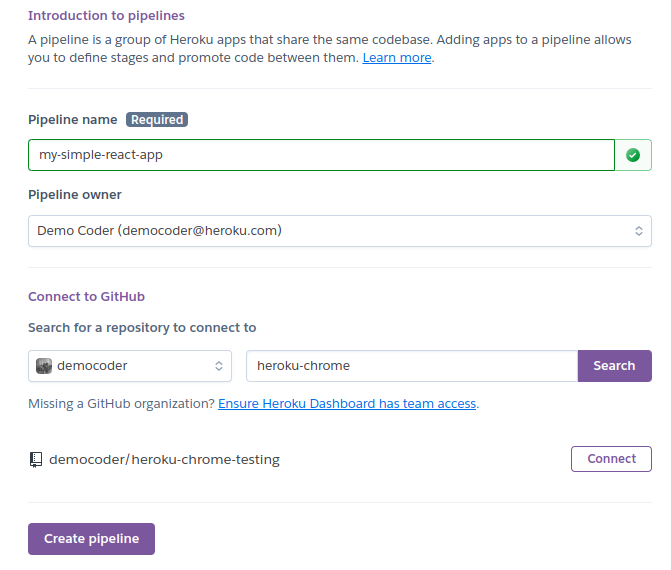
After finding our GitHub repo, we click Connect and then Create pipeline.
Add an app to the pipeline
Next, we need to add an app to our pipeline. We’ll add it to the Staging phase of our pipeline.

We click Create new app…

This app will use the GitHub repo that we’ve already connected to our pipeline. We choose a name and region for our app and then click Create app.

With our Heroku app added to our pipeline, we’re ready to work with Heroku CI.
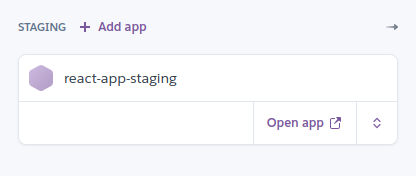
Enable Heroku CI
In our pipeline page navigation, we click Tests.

Then, we click Enable Heroku CI.
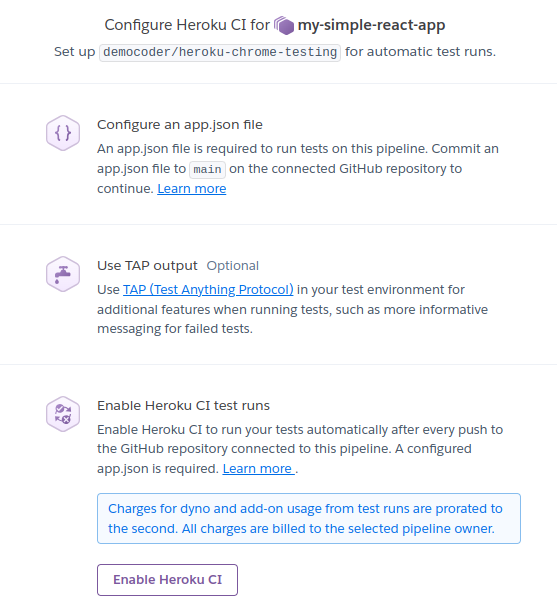
Just like that, Heroku CI is up and running.
- We’ve created our Heroku pipeline.
- We’ve connected our GitHub repo.
- We’ve created our Heroku app.
- We’ve enabled Heroku CI.
- We have an `app.json` file that specifies our need for the Chrome for Testing and Node.js buildpacks, and tells Heroku what to do when executing the `test` script.
That’s everything. It’s time to run some tests!
Run tests (manual trigger)
On the Tests page for our Heroku pipeline, we click the New Test ⇾ Start Test Run to manually trigger a run of our test suite.
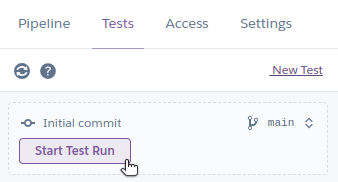
As Heroku displays the output for this test run, we see immediately that it has detected our need for the Chrome for Testing buildpack and begins installing Chrome and all its dependencies.

After Heroku installs our application dependencies and builds the project, it executes npm run test:ci. This runs start-server-and-test to spin up our React application and then run our Jest/Puppeteer tests.
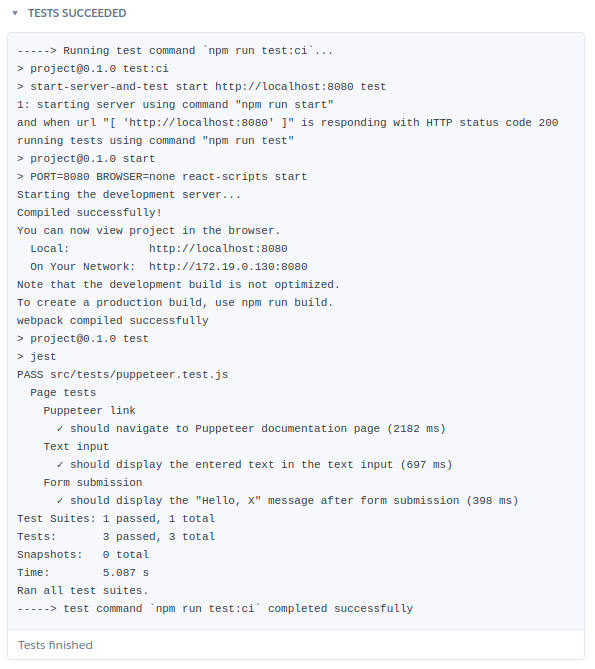
Success! Our end-to-end tests run, using headless Chrome via the Chrome for Testing Heroku Buildpack.
By integrating end-to-end tests in our Heroku CI pipeline, any push to our GitHub repo will trigger a run of our test suite. We have immediate feedback in case any end-to-end tests fail, and we can configure our pipeline further to use review apps or promote staging apps to production.
Conclusion
As the end-to-end testing in your web applications grows more complex, you’ll increasingly rely on headless browser testing that runs automatically as a part of your CI pipeline. Manually running tests is neither reliable nor scalable. Every developer on the team needs a singular, central place to run the suite of end-to-end tests. Automating these tests in Heroku CI is the way to go, and your testing capabilities just got a boost with the Chrome for Testing Buildpack.
When you’re ready to start running your apps on Heroku and taking advantage of Heroku CI, sign up today.
The post Testing a React App in Chrome with Heroku CI appeared first on Heroku.
]]>Learn more about Heroku’s latest innovations by adding us to your agenda via the Dreamforce Agenda Builder . Here's where you can find Heroku at Dreamforce 2024.
Heroku Demos in the Trailblazer Forest
Whether you are a full-stack Salesforce Developer or just prefer the CLI the Heroku demo booth is the best place to kick off Dreamforce. Dive into the latest product…
The post Discover Heroku at Dreamforce 2024 appeared first on Heroku.
]]>Learn more about Heroku’s latest innovations by adding us to your agenda via the Dreamforce Agenda Builder. Here’s where you can find Heroku at Dreamforce 2024.
Heroku Demos in the Trailblazer Forest
Whether you are a full-stack Salesforce Developer or just prefer the CLI the Heroku demo booth is the best place to kick off Dreamforce. Dive into the latest product innovations and personalized live demos showcasing Heroku and Data Cloud plus how Heroku can integrate with the MuleSoft Anypoint Flex Gateway. This is also a great opportunity to interact with product managers and get your questions answered.
Interested in AWS+Heroku? Be sure to stop by the Heroku demo at the AWS booth.
Camp Mini Hacks
If you’re a developer looking to challenge yourself, the Camp Mini Hacks are a must-visit. Connect with like-minded developers and tackle code challenges using Heroku and Salesforce technologies: Solve the Mega Hack Challenge, where you’ll integrate an Heroku Application with MuleSoft Anypoint Flex Gateway and Prompt Builder. It’s a hands-on way to learn and showcase your skills.
Breakout Sessions
Heroku’s Breakout Sessions are perfect for those wanting to dive deeper into the platform’s capabilities. Learn how other customers have successfully built and scaled their applications using Heroku. These sessions are informative and provide real-world insights into maximizing the potential of the platform.
Heroku Next-Gen for Cloud Native Workloads
Also available on Salesforce+
- Chris Peterson, Senior Director, Product Management, Salesforce
- Ethan Limchayseng, Director Product Management – Heroku Runtime, Salesforce
- Vivek Viswanathan, Director Product Management, Salesforce
Learn about Heroku’s plan to iterate and expand our platform with our next-gen stack powered by Kubernetes, Heroku-native Data Cloud integration, .NET support, and cutting-edge Postgres offerings.
Maximizing Sales Potential with the Power of Integration
- Alex Solomon, Software Engineering Leader, Cisco Meraki
- MK Korgaonkar, Data Integrations Product Manager, Cisco
Cisco created an integrated sales ecosystem that empowers high-touch sellers across silos to operate as one cohesive team, enabling cross-selling and promoting revenue growth across the organization.
Engaging Customers with Lamborghini’s “Unica” Experience
Also available on Salesforce+
- Lorenzo Cavicchi, Head of IT Commercial & Supporting, Automobili Lamborghini S.p.A.
- David Baliles, Distinguished Technical Architect, Salesforce
- Filippo Tonutti, Next Generation Customer Journey, Automobili Lamborghini
See how Lamborghini’s Unica app, built on Heroku, engages drivers in real time with seamless, digital in-car integration. Discover how collected data enhances Lamborghini’s B2B2C model and ecosystem.
Build a Golden Customer Record Using Heroku
Also available on Salesforce+
- Barry Sheehan, Chief Commercial Officer, Showoff
- Martin Eley, Principal Technical Architect, Salesforce
- Tobias Lilley, Heroku Sales UK&I, Salesforce
Combine records from multiple systems in real time and use Heroku to create a transactional, golden customer record for activation in Data Cloud.
Theater Sessions
Explore how Heroku powers the Next-Gen Platform and the C360. Theater Sessions presentations are part of a joint Mini Theater experience, offering exclusive content that highlights the integration of Heroku with Salesforce’s broader ecosystem.
Secure APIs on Heroku with MuleSoft Flex Gateway
Also available on Salesforce+
- Jonathan Jenkins, Senior Success Architect, Salesforce
- Parvez Mohamed, Director of Product Management, Salesforce
Learn to deploy MuleSoft Flex Gateway on Heroku, connect private and secure API apps, and manage access via AnyPoint controls.
Securely Integrating Heroku Apps with Data Cloud
- Vivek Viswanathan, Director of Product Management, Salesforce
- David Baliles, Distinguished Technical Architect, Salesforce
Learn how to connect Heroku apps with Data Cloud using Flows, Events, and Apex to enhance and extend your data management abilities.
Deliver Innovation with Heroku and Signature Support
Also available on Salesforce+
- Gabriel Avila, Senior Customer Solutions Manager, Salesforce
- Altaf Somani, Head of Software Development, Goosehead Insurance
Learn how Goosehead Insurance improved customer experience with the Heroku PaaS, improving issue identification and resolution by 75% and boosting response time by 55% with the agent enablement app.
Optimize Your Sales Strategy with Heroku, Salesforce, and AI
Also available on Salesforce+
- Xiaolin Xu, Senior Software Engineer, Salesforce
Use the power of vector search to analyze historical sales data and identify trends in customer behavior. Use these insights to make smarter sales forecasts and reduce churn.
Workshops
For a more interactive learning experience, Heroku’s Workshops are the place to be. These hands-on sessions will teach you how to build AI applications and integrate Heroku with Salesforce Data Cloud. It’s a unique opportunity to get practical experience with expert guidance.
Improve Customer Engagement with Heroku and Data Cloud
- Vivek Viswanathan, Director of Product Management, Salesforce
- David Baliles, Distinguished Technical Architect, Salesforce
Learn how to ingest Heroku data into Data Cloud, deploy a web app, and get real-time interactions. By the end, you’ll know how to connect Heroku to Data Cloud to boost your business.
Build Agentic AI Applications with Heroku
- Rand Fitzpatrick, Senior Director, Product Management, Salesforce
- Mauricio Gomes, Principal Engineer, Salesforce
- Marcus Blankenship, Director of AI/ML Engineering, Salesforce
Discover how to use Heroku to enhance your AI with code execution and function use, seamlessly integrated into your Heroku applications.
Roundtable
Gather with like-minded attendees to discuss a particular topic. Opportunity to network and share best practices and common challenges facing the Salesforce community. Each table is moderated by an expert.
Heroku for IT Leaders: Boost Scalability and Cost Efficiency
- Dan Mehlman, Director, Heroku Technical Architecture, Salesforce
- Brandon Schoen, Director, Heroku Professional Services, Salesforce
Discover how you can achieve limitless scalability by using the right tools for the job with Heroku. Save money on DevOps and infrastructure management, allowing you to focus on your product.
Final Thoughts
Dreamforce 2024 is shaping up to be an exciting event, especially for IT leaders and developers using Heroku for their development needs. Make sure to add these sessions to your schedule and experience the best of what Heroku has to offer!
The post Discover Heroku at Dreamforce 2024 appeared first on Heroku.
]]>Originally, the Twelve-Factor manifesto focused on building deployable applications without thinking about deployment, and while its core concepts are still remarkably relevant , the examples are another story. Industry practices have evolved considerably…
The post Updating Twelve-Factor: A Call for Participation appeared first on Heroku.
]]>Originally, the Twelve-Factor manifesto focused on building deployable applications without thinking about deployment, and while its core concepts are still remarkably relevant, the examples are another story. Industry practices have evolved considerably and many of the examples reflect outdated practices. Rather than help illustrate the concepts, these outdated examples make the concepts look obsolete.
It is time to modernize Twelve-Factor for the next decade of technological advancements.
Like art restoration, the majority of the work will first focus on removing accumulated cruft so that the original intent can shine through. For the first step in the restoration, we plan to remove the references to outdated technology and update the examples to reflect modern industry practices. Next, we plan to clearly separate the core concepts from the examples. This will make it easier to evolve the examples in the future without disturbing the timeless philosophy at the core of the manifesto. Just like how microservices are a set of separate services that are loosely coupled together so they can be updated independently, we’re applying this same thinking to Twelve-Factor so the specifications can be separate from examples and reference implementations.
While we originally wrote Twelve-Factor on our own, it’s now time that we define and implement these principles with the community — taking lessons that we’ve all learned from building and operating modern apps and systems and sharing them. Let’s do this together, email to join twelve-factor@googlegroups.com and tag #12factor (X / LinkedIn) or @heroku when you publish blogs with your perspectives and ideas!
We look forward to working together to make the new version of the manifesto awesome!
The post Updating Twelve-Factor: A Call for Participation appeared first on Heroku.
]]>Because today’s companies operate in the cloud, they can reach a global audience with ease. At any given moment, you could have customers from Indiana, Indonesia, and Ireland using your services or purchasing your products. With such a widespread customer base, your business data will inevitably cross borders. What does this mean for data privacy, protection, and compliance?
If your company deals with customers on a global — or at the very least, multi-national — scale, then understanding the concept of data residency is essential. Data residency deals…
The post Data Residency Concerns for Global Applications appeared first on Heroku.
]]>Because today’s companies operate in the cloud, they can reach a global audience with ease. At any given moment, you could have customers from Indiana, Indonesia, and Ireland using your services or purchasing your products. With such a widespread customer base, your business data will inevitably cross borders. What does this mean for data privacy, protection, and compliance?
If your company deals with customers on a global — or at the very least, multi-national — scale, then understanding the concept of data residency is essential. Data residency deals with the laws and regulations that dictate where data must be stored and managed. Compliance with the relevant laws keeps you in good business standing and builds trust with your customers.
In this post, we’ll explore the concept of data residency. We’ll look at the implications of a global customer base on your compliance footprint and efforts. At first glance, achieving compliance with data residency requirements may seem like an insurmountable task. However, leveraging cloud regions from the right cloud provider — such as through Private Dynos from Heroku Enterprise — can help relieve your data residency headaches.
Before we begin, and as a reminder, this blog should not be taken as legal advice, and you should always seek your own counsel on matters of legal and regulatory compliance. Let’s start with a brief primer on the core concept for this post.
What is data residency?
Data residency refers to the legal requirements that dictate where your data may be stored and processed. When it comes to data management — which is how you handle data throughout its lifecycle — taking into account data residency concerns is essential. Ultimately, this comes down to understanding where a user of your application resides, and subsequently where their data must be stored and processed.
When people think of data protection laws, many immediately think of the General Data Protection Regulation (GDPR) and California Consumer Privacy Act (CCPA). GDPR has certain requirements about how organizations handle and process the data of individuals residing within the EU. The CCPA regulates how businesses handle the personal data of California residents.
GDPR and CCPA have stringent rules about how data is processed, but they do not necessarily impose strict requirements on where data resides, as long as that data has been processed in a compliant manner. However, many countries have strict data residency laws regarding certain kinds of data. For example, China’s Personal Information Protection Law requires handlers of certain types of personally identifiable information (PII) of a Chinese citizen be stored within China’s borders.
Tangentially related to the concept of data residency are two other concepts worth noting:
- Data sovereignty deals with a nation’s legal authority and jurisdiction over data, regardless of where it is physically located.
- Digital rights emphasizes the individual’s autonomy and authority over their personal data.
Why does data residency matter for compliance?
Your enterprise may be dealing with data from residents or citizens of specific countries or with specific industries in countries that have strict requirements about where the data must be stored. These are data residency requirements, and businesses that operate internationally must comply with these requirements to avoid running afoul of the law.
Compliance ensures that your data handling aligns with local laws and regulations. It helps you avoid legal penalties, and it builds trust among your global customers.
What happens if you don’t comply? The risks of non-compliance are significant. Non-compliance can have far-reaching consequences for any business, including:
- Hefty fines
- Legal disputes
- Possible loss of a license to operate as a business
- Erosion of customer trust
- Damaged company reputation
If your business has a global customer base, then data residency matters because compliance is a must. Managing your data in compliance is more than just a legal buffer; it’s foundational to business integrity and customer trust.
How cloud regions can help you with data residency compliance
This brings us to the all-important concept of cloud regions. Leveraging cloud regions effectively could be a game-changer for your enterprise’s ability to meet data residency requirements, thereby maintaining compliance.
When a cloud provider gives you the option of cloud regions, you can specify where your data is stored. This helps you to align your data handling practices with regional compliance laws and regulations.
For example, if your customer is an EU resident, you might choose to store their data in an EU-based cloud region. If the sensitive data you process is sourced in India, then it might make sense to store that data in India, to satisfy local jurisdiction and compliance requirements.
When you take advantage of cloud regions, you bring better and more granular control over your data. In addition, you likely boost application performance by using geographical proximity to optimize data access.
Using cloud regions lets you scale operations internationally while maintaining compliance. You can be sure that each segment of your business adheres to the data protection standards of any given local jurisdiction.
Heroku’s Private Dynos for global application data compliance
Heroku Enterprise offers dynos in Private Spaces. These Private Dynos give you enhanced privacy and control, allowing your company to choose from the following cloud regions:
- Dublin, Ireland
- Frankfurt, Germany
- London, United Kingdom
- Montreal, Canada
- Mumbai, India
- Oregon, United States
- Singapore
- Sydney, Australia
- Tokyo, Japan
- Virginia, United States
These options enable globally operating companies to maintain compliance across different jurisdictions.
In addition to cloud regions, Heroku offers Heroku Shield, which provides additional security features necessary for high compliance operations. With Heroku Shield Private Spaces, Heroku maintains compliance certifications for PCI, HIPAA, ISO, and SOC.
As we’ve discussed, understanding and implementing adequate data residency measures is essential to your ability to operate. However, with cloud regions from a reliable and secure cloud provider platform, compliance is achievable.
Taking advantage of Heroku’s various products — whether it’s Private Dynos or Heroku Shield — to address the various laws or regulations that apply to your organization can move you in the direction of maintaining compliance. In addition, by using these features to simplify your data management and data residency concerns, you’ll also level up your operational efficiency.
Are you ready to see how Heroku can streamline your compliance efforts with Private Dynos and Heroku Shield? Contact Heroku to find out more today!
The post Data Residency Concerns for Global Applications appeared first on Heroku.
]]>That’s why they adopt an event-driven architecture (EDA) for their applications.
Long gone are the days of monolithic applications with components tightly coupled…
The post Building an Event-Driven Architecture with Managed Data Services appeared first on Heroku.
]]>That’s why they adopt an event-driven architecture (EDA) for their applications.
Long gone are the days of monolithic applications with components tightly coupled into a single, bloated piece of software. That approach leads to scalability issues, slower development cycles, and complex maintenance. Instead, today’s applications are built on decoupled microservices and components — individual parts of an application that communicate and operate independently, without direct knowledge of each other’s definitions or internal representations. The resulting system is resilient and easier to scale and manage.
This is where EDA comes in. EDA enables efficient communication between these independent services, ensuring real-time data processing and seamless integration. With EDA, organizations leverage this decoupling to achieve the scalability and flexibility they need for their dynamic environments. And central to the tech stack for realizing EDA is Apache Kafka.
In this post, we’ll explore the advantages of using Kafka for EDA applications. Then, we’ll look at how Apache Kafka on Heroku simplifies your task of getting up and running with the reliability and scalability to support global-scale EDA applications. Finally, we’ll offer a few tips to help pave the road as you move forward with implementation.
Kafka’s Advantages for Event-Driven Systems
An EDA is designed to handle real-time data so that applications can respond instantly to changes and events. Boiled down to the basics, we can break down an EDA application to just a few key concepts:
- An event is data — often in the form of a simple message or a structured object — that represents something that has happened in the system. For example: a customer has placed an order, or a warehouse has confirmed inventory numbers for a product, or a medical device has raised a critical alert.
- A topic is a channel where an event is published. For example: orders, or confirmations, or vital signs.
- A producer is a component that publishes an event to a topic. For example: a web server, or a POS system, or a wearable fitness monitor.
- A consumer is a component that subscribes to a topic. It listens for a notification of an event, and then it kicks off some other process in response. For example: an email notification system, or a metrics dashboard, or a fulfillment warehouse.

Decoupling components
An EDA-based application primarily revolves around the main actors in the system: producers and consumers. With decoupling, these components simply focus on their own jobs, knowing nothing about the jobs of others.
For example, the order processing API of an e-commerce site receives a new order from a customer. As a producer in an EDA application, the API simply needs to publish an event with the order data. It has no idea about how the order will be fulfilled or how the customer will be notified. On the other side of things, the fulfillment warehouse is a consumer listening for events related to new orders. It doesn’t know or care about who publishes those events. When a new order event arrives, the warehouse fulfills the order.
By enabling this loose coupling between components, Kafka makes EDA applications incredibly modular. Kafka acts as a central data store for events, allowing producers to publish events and consumers to read them independently. This reduces the complexity of updates and maintenance. It also allows components to be scaled — vertically or horizontally — without impacting the entire system. New components can be tested with ease. With Kafka at the center, producers and consumers operate outside of it but within the EDA, facilitating efficient, real-time data processing.
Real-time data processing
Kafka allows you to process and distribute large streams of data in real time. For applications that depend on up-to-the-second information, this ability is vital. Armed with the most current data, companies can make better decisions faster, improving both their operational efficiency and their customer experiences.
Fault tolerance
For an EDA application to operate properly, the central broker — which handles the receipt of published events by notifying subscribed consumers — must be available and reliable. Kafka is designed for fault tolerance. It replicates data across multiple nodes, running as a cluster of synchronized and coordinated brokers. If one node fails, no data is lost. The system will continue to operate uninterrupted.
Kafka’s built-in redundancy is part of what makes it so widely adopted by enterprises that have embraced the event-driven approach.
Introduction to Apache Kafka on Heroku
Apache Kafka on Heroku is a fully managed Kafka service that developers — both in startups and established global enterprises — look to for ease of management and maintenance. With a fully managed service, developers can focus their time and efforts on application functionality rather than wrangling infrastructure.
Plans and configurations for Apache Kafka on Heroku include multi-tenant basic plans as well as single-tenant private plans with higher capacity and network isolation or integration with Heroku Shield to meet compliance needs.
With Apache Kafka on Heroku, your EDA application will scale as demand fluctuates. Heroku manages Kafka's scalability by automatically adjusting the number of brokers in the cluster, making certain that sufficient capacity is available as data volume increases. This ensures that your applications can handle both seasonal spikes and sustained growth — without any disruption or need for configuration changes.
Then, of course, we have reliability. Plans from the Standard-tier and above start with 3 Kafka brokers for redundancy, extending to as many 8 brokers for applications with more intensive fault tolerance needs. With data replicated across nodes, the impact of any node failure will be mitigated, ensuring your data remains intact and your application continues to run.

Integration Best Practices
When you design your EDA application to be powered by Kafka, a successful integration will ensure its smooth and efficient operation. When setting up Kafka for your event-driven system, keep in mind the following key practices:
- Define your data flow. As you begin your designs, map out clearly how data ought to move between producers and consumers. Remember that a consumer of one event can also act as a producer of another event. Producers can publish to multiple topics, and consumers can subscribe to multiple topics. When you’ve designed your data flows clearly, integrating Kafka will be seamless and bottleneck-free.
- Ensure data consistency and integrity. Take advantage of Kafka’s built-in features, such as transactions, topic and data schema management, and message delivery guarantees. Using all that Kafka has to offer will help you reduce the risk of errors, ensuring that messages remain consistent and reliably delivered across your system.
- Monitor performance and log activity: Use monitoring tools to track key performance metrics, and leverage logging for Kafka’s operations. Robust logging practices and continuous monitoring of your application will provide crucial performance insights and alert you of any system health issues.
Conclusion: Bringing It All Together with Heroku
In this post, we've explored how pivotal Apache Kafka is as a foundation for event-driven architectures. By decoupling components and ensuring fault tolerance, Kafka ensures EDA-based applications are reliable and easily scalable. By looking to Heroku for its managed Apache Kafka service, enterprises can offload the infrastructure concerns to a trusted provider, freeing their developers up to focus on innovation and implementation.
For more information about Apache Kafka on Heroku, view the demo or contact our team of implementation experts today. When you’re ready to get started, sign up for a new account.
The post Building an Event-Driven Architecture with Managed Data Services appeared first on Heroku.
]]>Let's walk through deploying the Anypoint Flex Gateway on Heroku in a few straightforward steps. You'll learn how to connect your private APIs and microservices on the Heroku platform through the Anypoint Flex Gateway and the Anypoint API Manager , without the hassle of managing infrastructure. Get ready to unlock the potential of this potent pairing and, in the future, integrate it with Salesforce.
Salesforce's ecosystem…
The post Mastering API Integration: Salesforce, Heroku, and MuleSoft Anypoint Flex Gateway appeared first on Heroku.
]]>Let’s walk through deploying the Anypoint Flex Gateway on Heroku in a few straightforward steps. You’ll learn how to connect your private APIs and microservices on the Heroku platform through the Anypoint Flex Gateway and the Anypoint API Manager, without the hassle of managing infrastructure. Get ready to unlock the potential of this potent pairing and, in the future, integrate it with Salesforce.
Introduction
Salesforce’s ecosystem provides a seamless, integrated platform for our customers. The most recent MuleSoft Anypoint Flex Gateway release is now compatible with Heroku, offering an improved security profile and reduced latency for APIs hosted on Heroku.
By deploying the Anypoint Flex Gateway inside the same Private Space as your Heroku apps, you create an environment where your Heroku apps with internal routing can be exposed to the public through the Flex Gateway. This adds an extra layer of security and control, only allowing traffic to flow through the Flex Gateway, which can be configured easily from the MuleSoft control plane and scaled with the simplicity of Heroku. The joint integration simplifies operations and scalability and accelerates your time to value for your Salesforce solutions.

What is Anypoint Flex Gateway?
MuleSoft Anypoint Flex Gateway is a lightweight, ultrafast API Gateway that simplifies the process of building, securing, and managing APIs in the cloud. It removes the burden of API protection, enabling organizations to focus on delivering exceptional digital experiences. Built on the Anypoint Platform, Flex Gateway provides comprehensive API management and governance capabilities for APIs exposed in the cloud.
Anypoint Flex Gateway offers robust security features, including authentication, authorization, and encryption, to safeguard sensitive data. It empowers you with granular traffic management, enabling control over API traffic flow and the enforcement of rate limiting policies to maintain service availability. Moreover, Flex Gateway works with API Manager, MuleSoft’s centralized cloud-based API control plane, to deliver valuable analytics and insights into API usage, facilitating data-driven decisions and the optimization of API strategies. Flex Gateway and API Manager are key parts of MuleSoft’s universal API Management capabilities to discover, build, govern, protect, manage and engage with any API.
In conclusion, MuleSoft Anypoint Flex Gateway is an essential resource for organizations seeking to seamlessly integrate and secure their APIs with Heroku and manage them effectively in a Heroku Private Space. Heroku’s fully managed service, combined with robust security, traffic management, and analytics capabilities, empowers businesses to confidently embrace the cloud and deliver exceptional API experiences to their users.
Setting up Flex Gateway on Heroku
To get started with MuleSoft Anypoint Flex Gateway on Heroku, you will need to:
- Create a Heroku account
- Create an Anypoint Platform account
- Install the Heroku CLI
- Install Docker to register the Flex Gateway
Upon completing these steps, you are now ready to begin the setup process.
The process is described as follows:
- Deploy an API in a Heroku Private Space
- Create an API specification in Anypoint Design Center
- Register the Flex Gateway in Runtime Manager
- Deploy the Flex Gateway to Heroku
- Connect the Private API to the Flex Gateway
Now let’s detail each step so you can learn how to implement this pattern for your enterprise applications.
Deploy an API in a Heroku Private Space
Note: To learn how to create a Heroku Private Space please refer to the documentation, for our example we already have a private space called flex-gateway-west.
Let’s take one of our reference applications as our example, which exposes a REST API with OpenAPI support.
Before we deploy the app, we must ensure that it is created as an internal application within the private space.
You can deploy this internal application using the Deploy to Heroku button or the Heroku CLI.

When using the Heroku CLI make sure you set the --internal-routing flag:
heroku create employee-directory-api --space flex-gateway-west --internal-routing
Next, you will proceed to configure the application and any add-ons required. In our example, we need to provision a private database (heroku-postgresql:private-0) and set up an RSA public key for JWT authentication support, but these steps might differ for your application. Consult the reference application’s README for a more detailed guide.
Once you’ve deployed the app, grab the application URL from the settings page in your Heroku Dashboard. You’ll need this for a later step.

Create an API specification in Anypoint Design Center
To link the API with the Flex Gateway, you’ll need to create an API specification in Anypoint Platform using the Design Center and then publish it to Anypoint Exchange.
If your API running in Heroku Private Space has an API specification that uses the OpenAPI 3.0 standard, which is supported by Anypoint Platform, you can use it here. If you don’t, you can use Design Center to create one from scratch. To learn more, see the API Designer documentation.
The User Directory reference application offers both JSON and Yaml API specifications for your convenience. Access them in the openapi folder on GitHub.
In Design Center, let’s click on Create > Import from file, and select either the Yaml or JSON file, and then click on Import.

Once you’ve imported your file, check Design Center to see that your spec file is error-free. You can even use the mocking service to test the API and make sure everything looks good. If there are no problems and it’s the right file, go ahead and click on Publish.
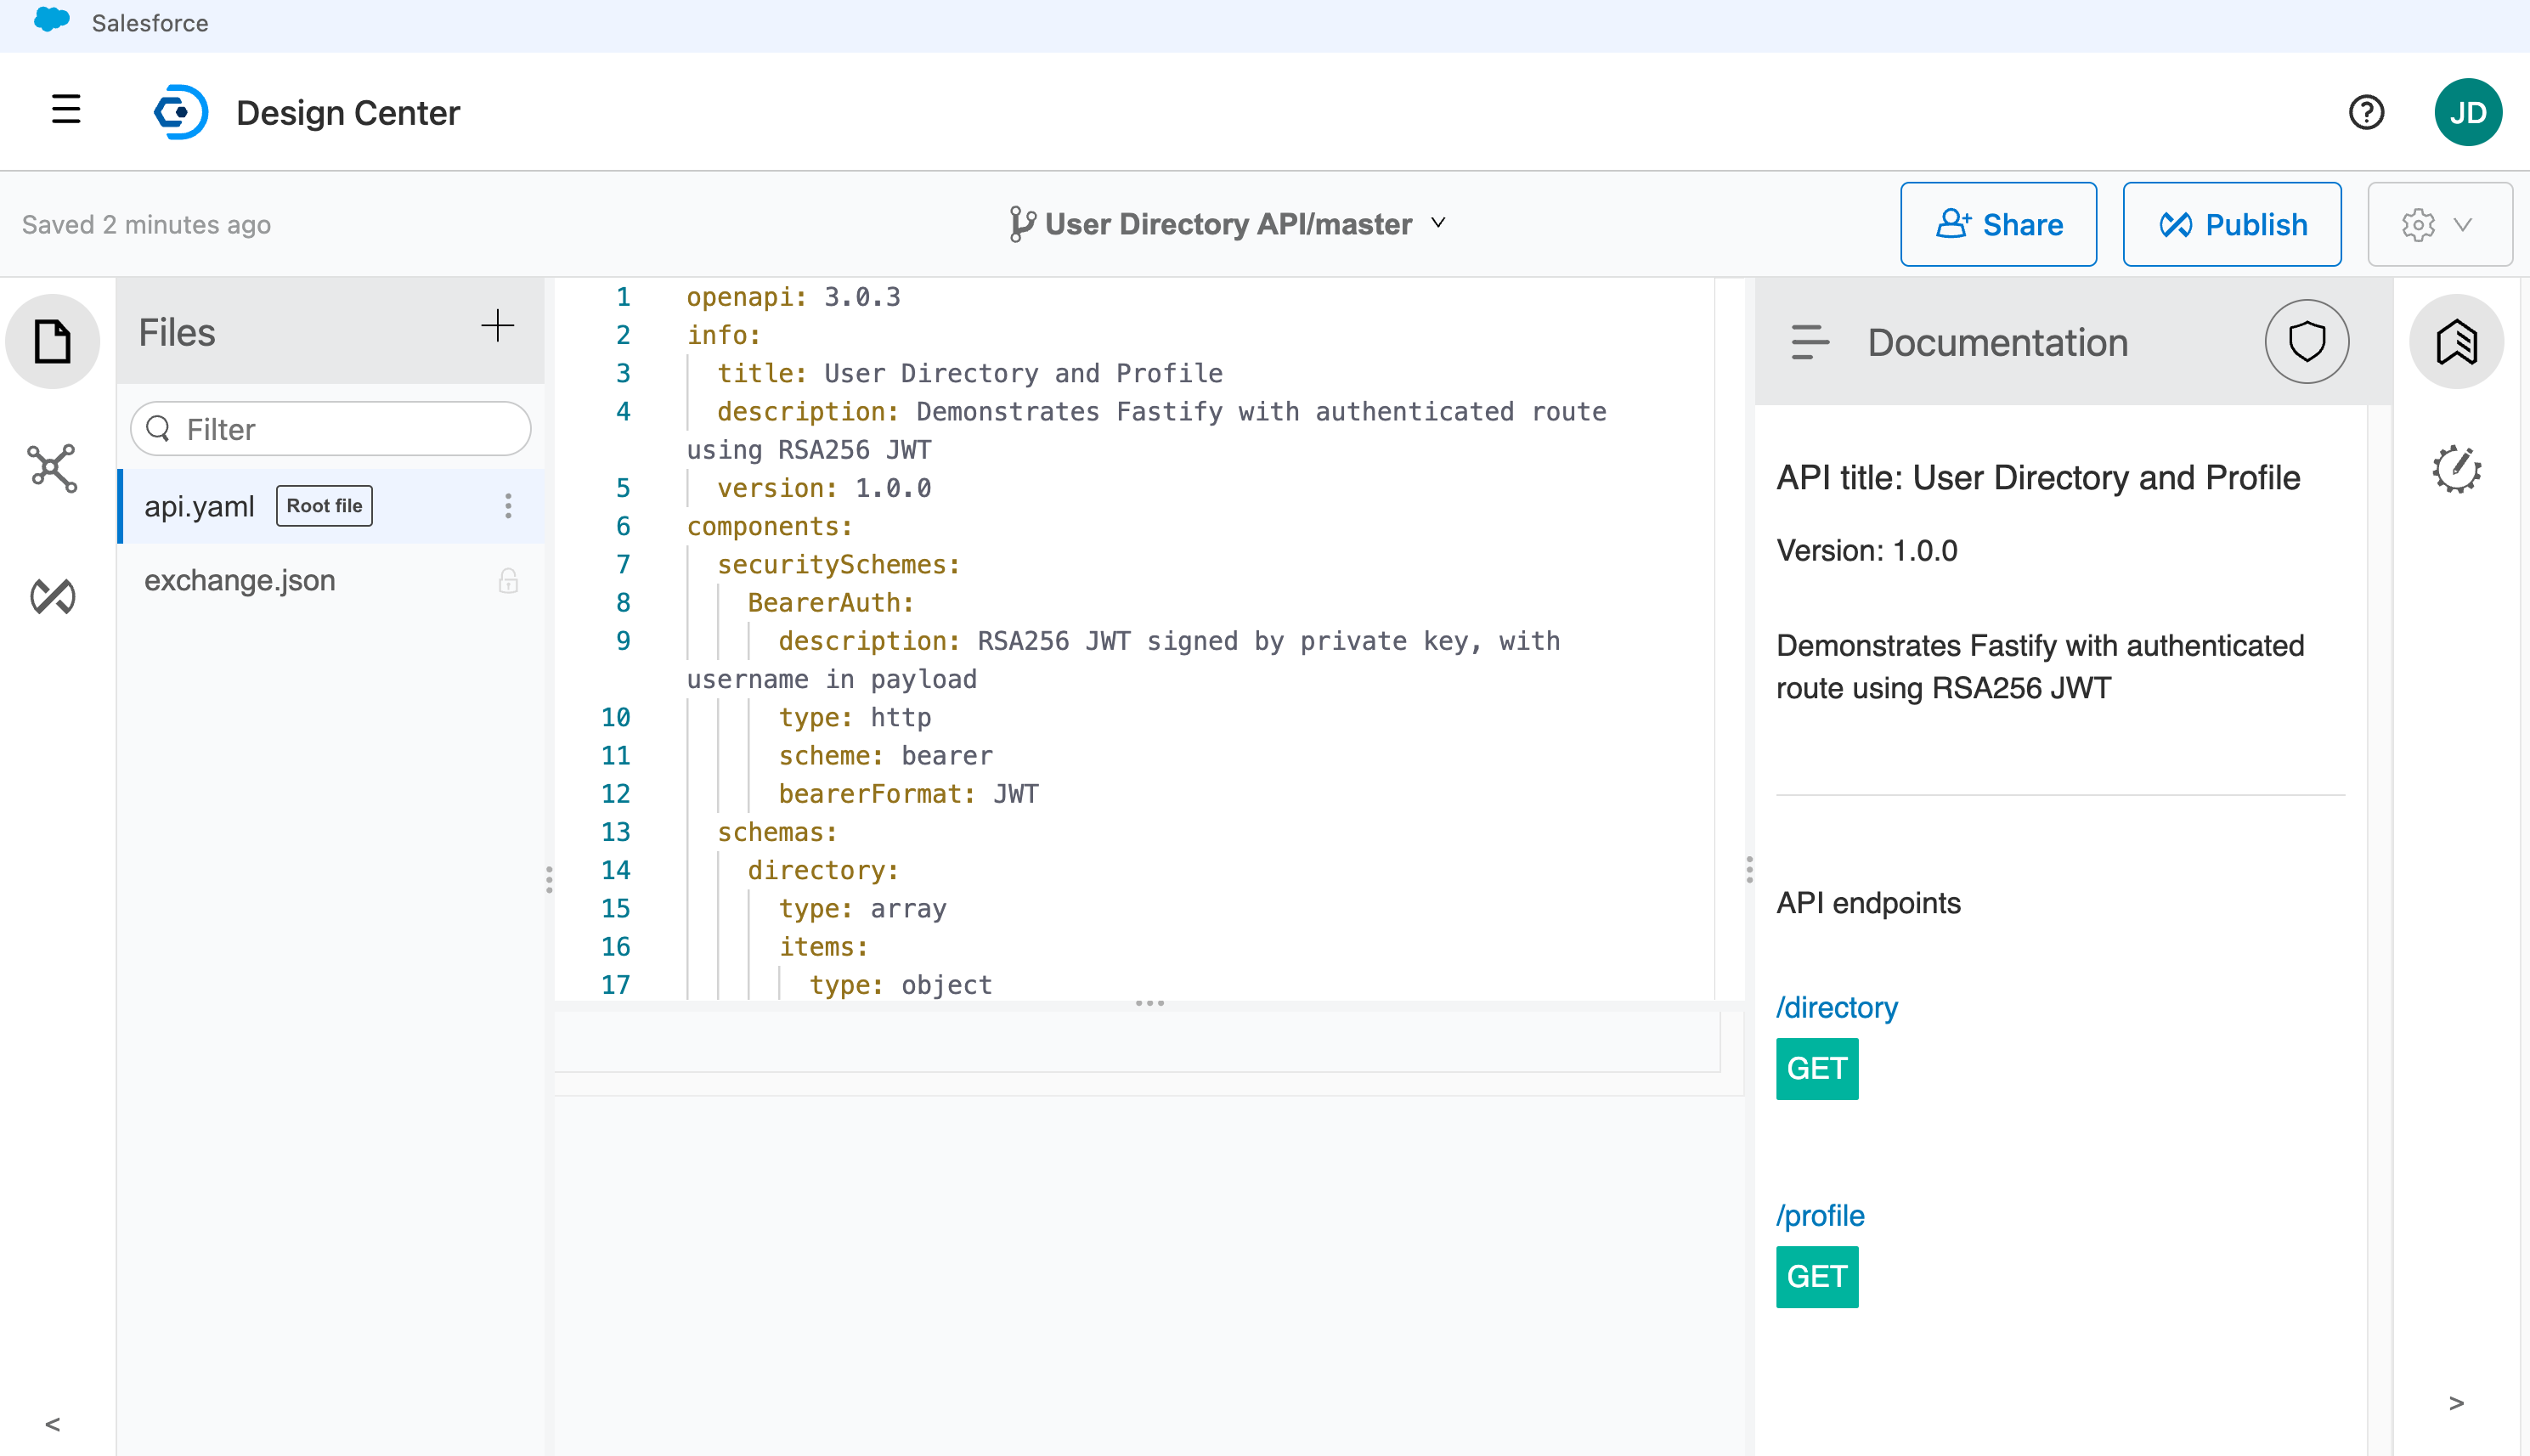
Add the finishing touches to your metadata, like API version and LifeCycle State, then click on Publish to Exchange.
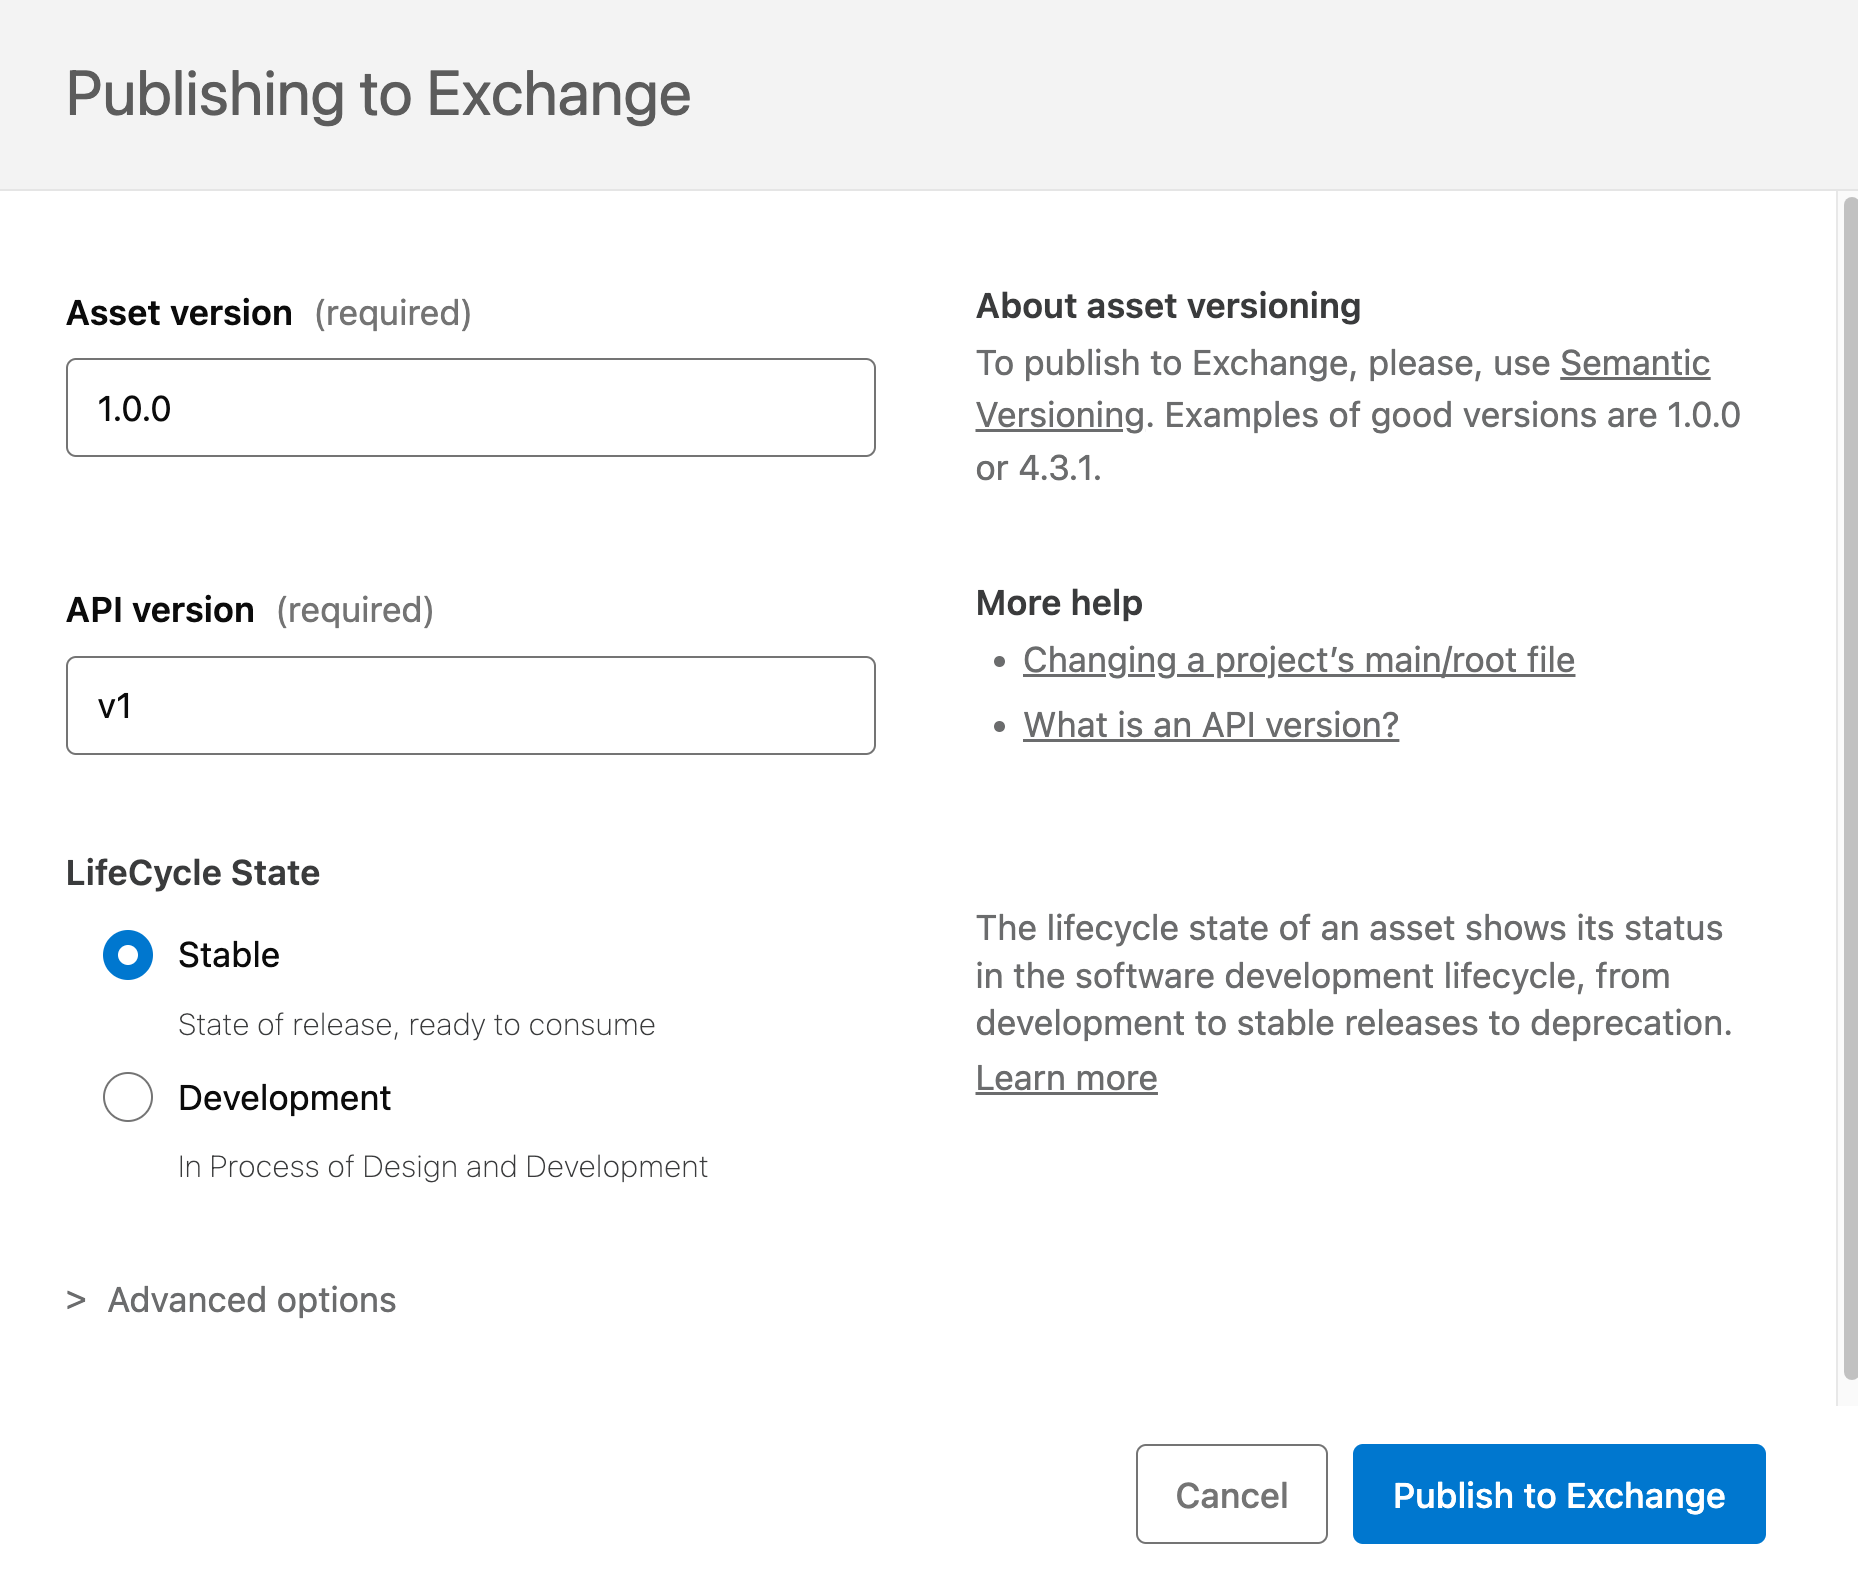
Now, with your API specification in hand, let’s move on to registering and deploying the Anypoint Flex Gateway to Heroku.
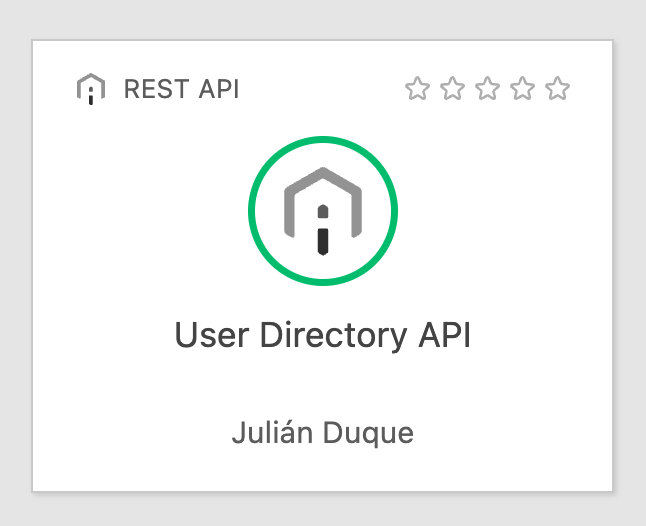
Register the Flex Gateway in Runtime Manager
Before you deploy to Heroku, you need to get the registration.yaml configuration file. To do that, go to the Runtime Manager > Flex Gateways and click Add Gateway. Then select Container > Docker and follow the instructions to set up your gateway locally using Docker. Just follow steps 1 and 2, and that will create the registration.yaml file you need.

Once the command has been executed, you’ll see the registration.yaml file. This file is needed on the next step, along with the confirmation of the gateway listed in your Runtime Manager.

Deploy the Flex Gateway to Heroku
Now, let’s get the Flex Gateway deployed to Heroku. You can find a reference application for the Heroku Docker Flex Gateway on GitHub. There, you have two options: use the Deploy to Heroku button for a quick and easy deployment, or follow the detailed Manual Deployment instructions in the README using the Heroku CLI. Just ensure you’re setting up the Flex Gateway in the same Private Space as the internal API you deployed in earlier steps.
For our example, we will use the Heroku CLI, naming our Flex Gateway api-ingress-west and deploying to the flex-gateway-west private space.
git clone https://github.com/heroku-reference-apps/heroku-docker-flex-gateway/
cd heroku-docker-flex-gateway
heroku create api-ingress-west --space flex-gateway-west
heroku config:set FLEX_CONFIG="$(cat registration.yaml)" -a api-ingress-west
heroku config:set FLEX_DYNAMIC_PORT_ENABLE=true -a api-ingress-west
heroku config:set FLEX_DYNAMIC_PORT_ENVAR=PORT -a api-ingress-west
heroku config:set FLEX_DYNAMIC_PORT_VALUE=8081 -a api-ingress-west
heroku config:set FLEX_CONNECTION_IDLE_TIMEOUT_SECONDS=60 -a api-ingress-west
heroku config:set FLEX_STREAM_IDLE_TIMEOUT_SECONDS=300 -a api-ingress-west
heroku config:set FLEX_METRIC_ADDR=tcp://127.0.0.1:2000 -a api-ingress-west
heroku config:set FLEX_SERVICE_ENVOY_DRAIN_TIME=30 -a api-ingress-west
heroku config:set FLEX_SERVICE_ENVOY_CONCURRENCY=1 -a api-ingress-west
heroku stack:set container
git push heroku main
You’ll see your Heroku apps deployed to the Private Space, after a minute or so you should also see the Flex Gateway as connected in Runtime Manager.

Make sure to grab the api-ingress-west URL under settings like we did with the API, we will need this URL to test things out.

And that’s how you deploy the Flex Gateway to Heroku, now let’s connect our internal API and test it.
Connect the Private API to the Flex Gateway
Now, the final step is connecting the Private API with Flex Gateway, for this you will go to Anypoint API Manager and click on Add API.
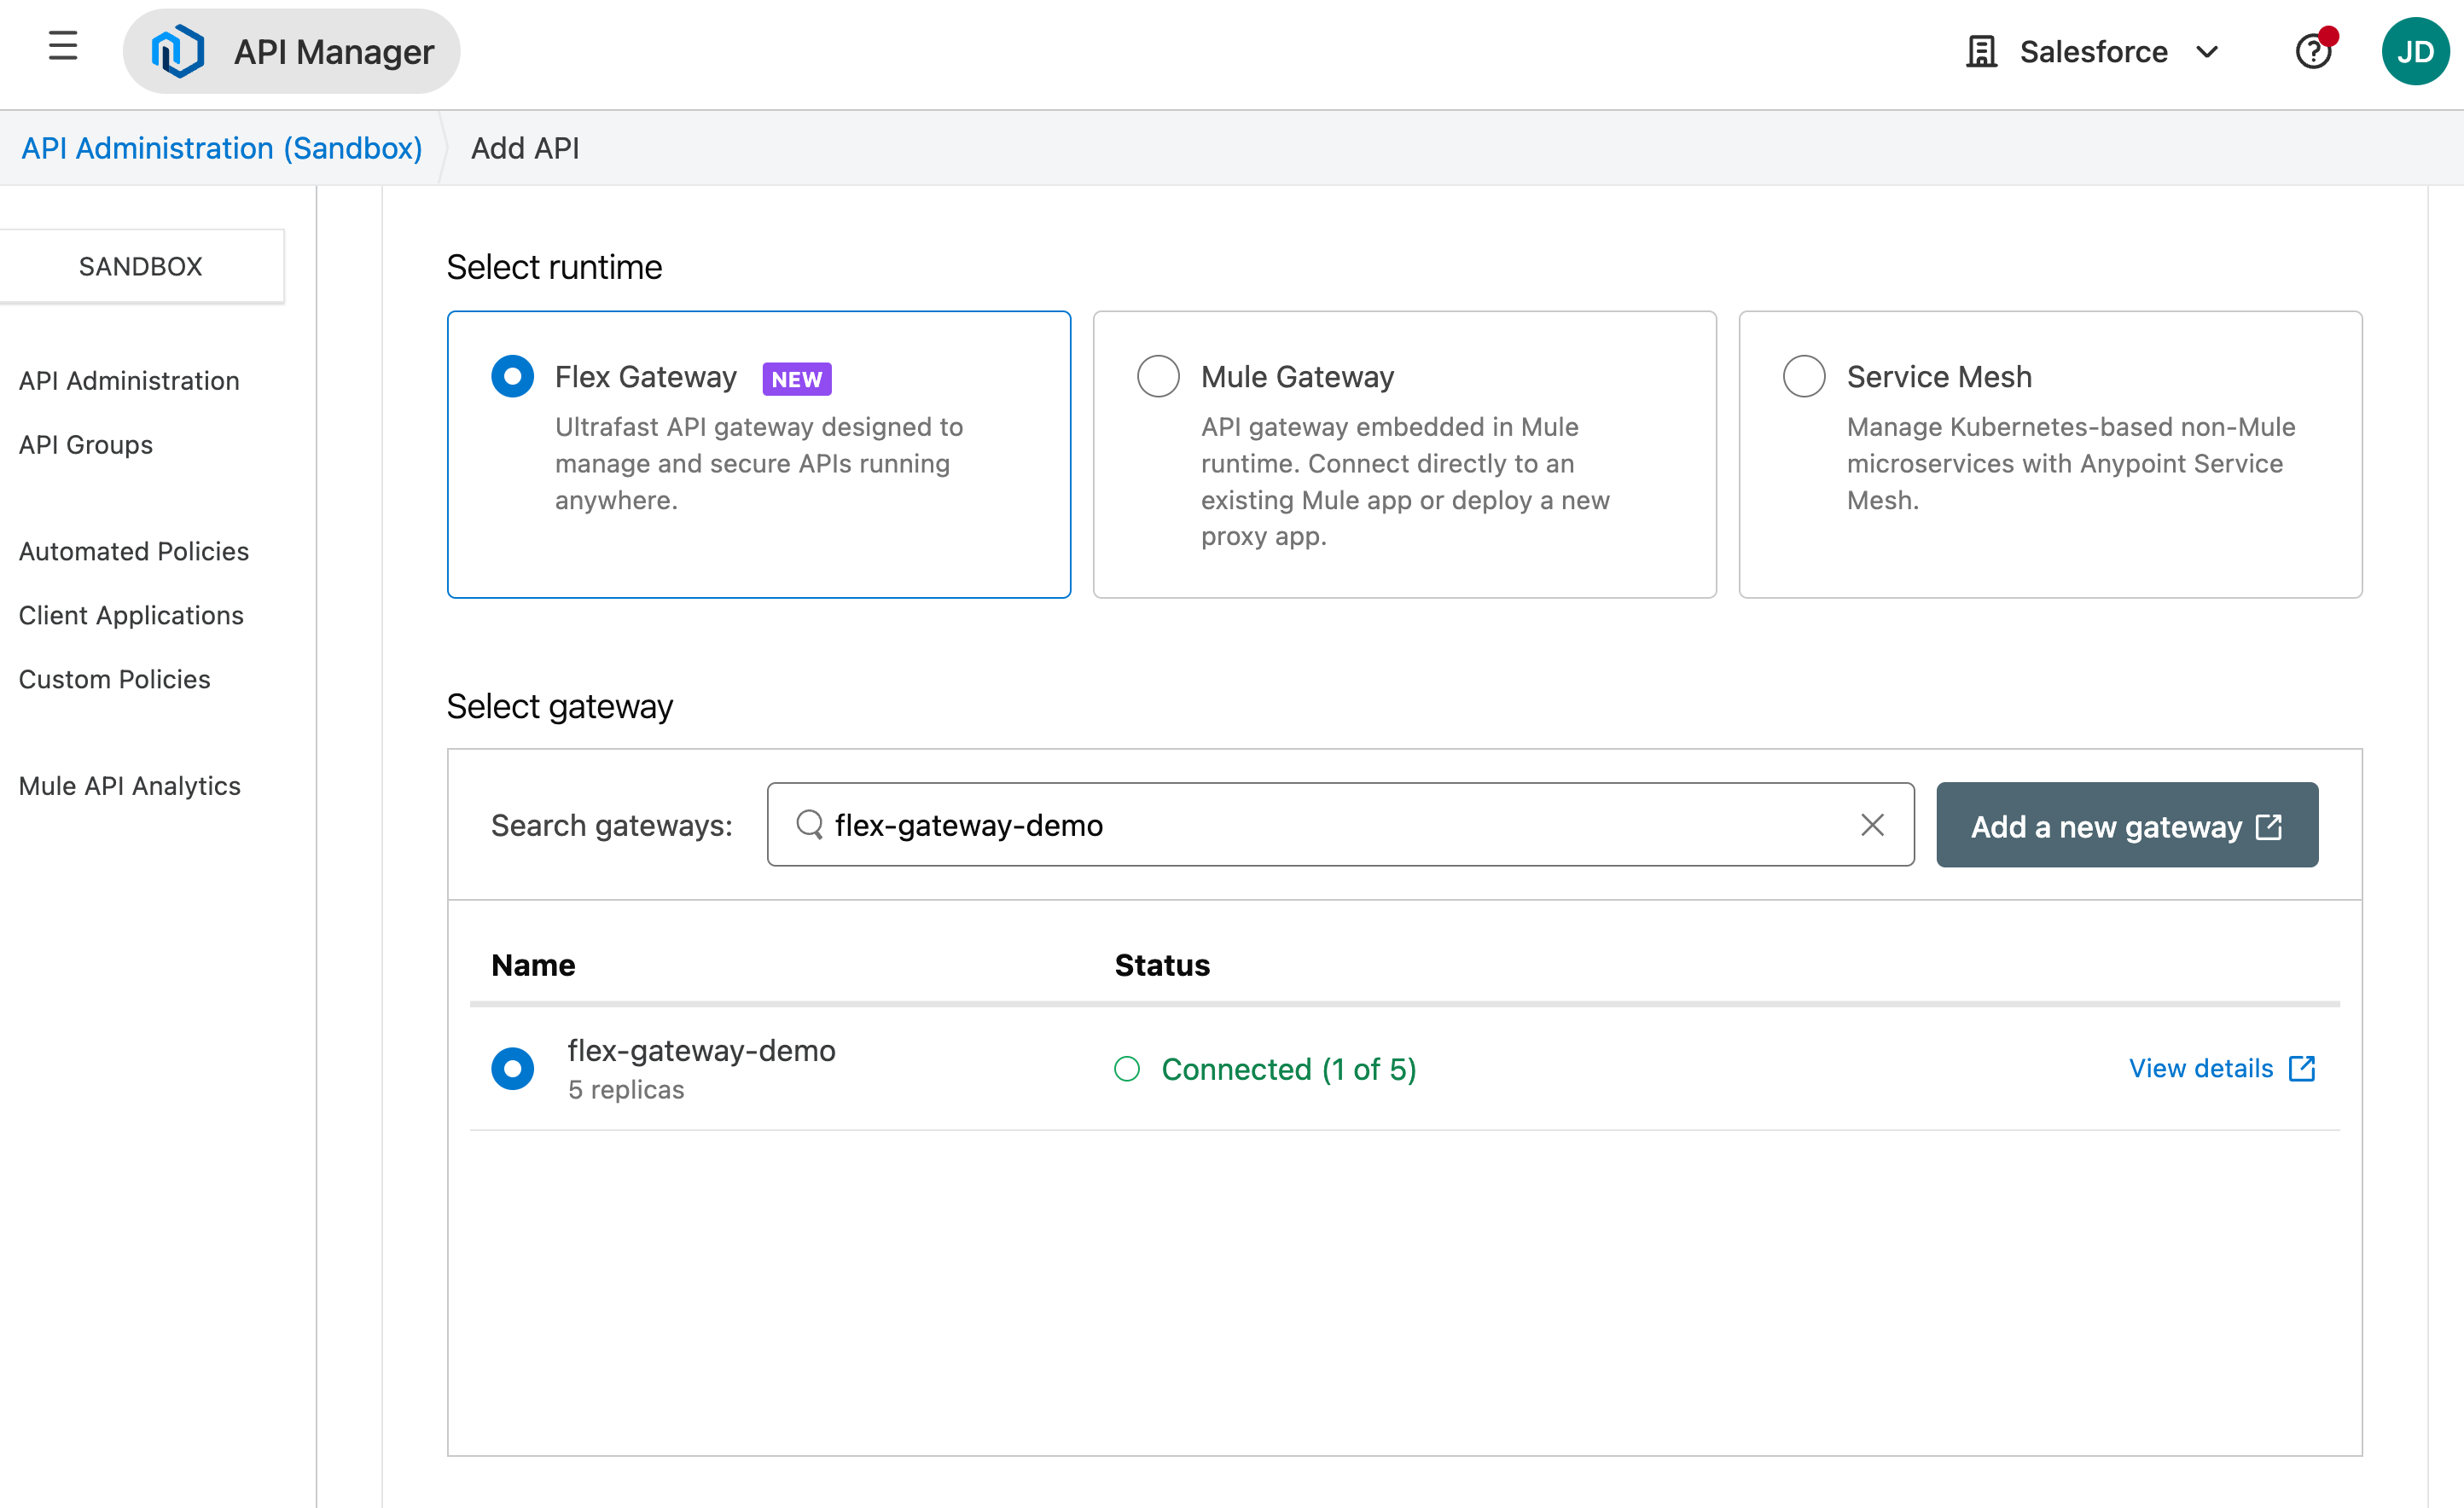
Then, select the API from Exchange and click on Next.

Let’s leave the API Downstream default options as they are and move on to setting up the Upstream. Remember the application URL from our initial step? That URL will serve as our Upstream URL (using http and no trailing /).
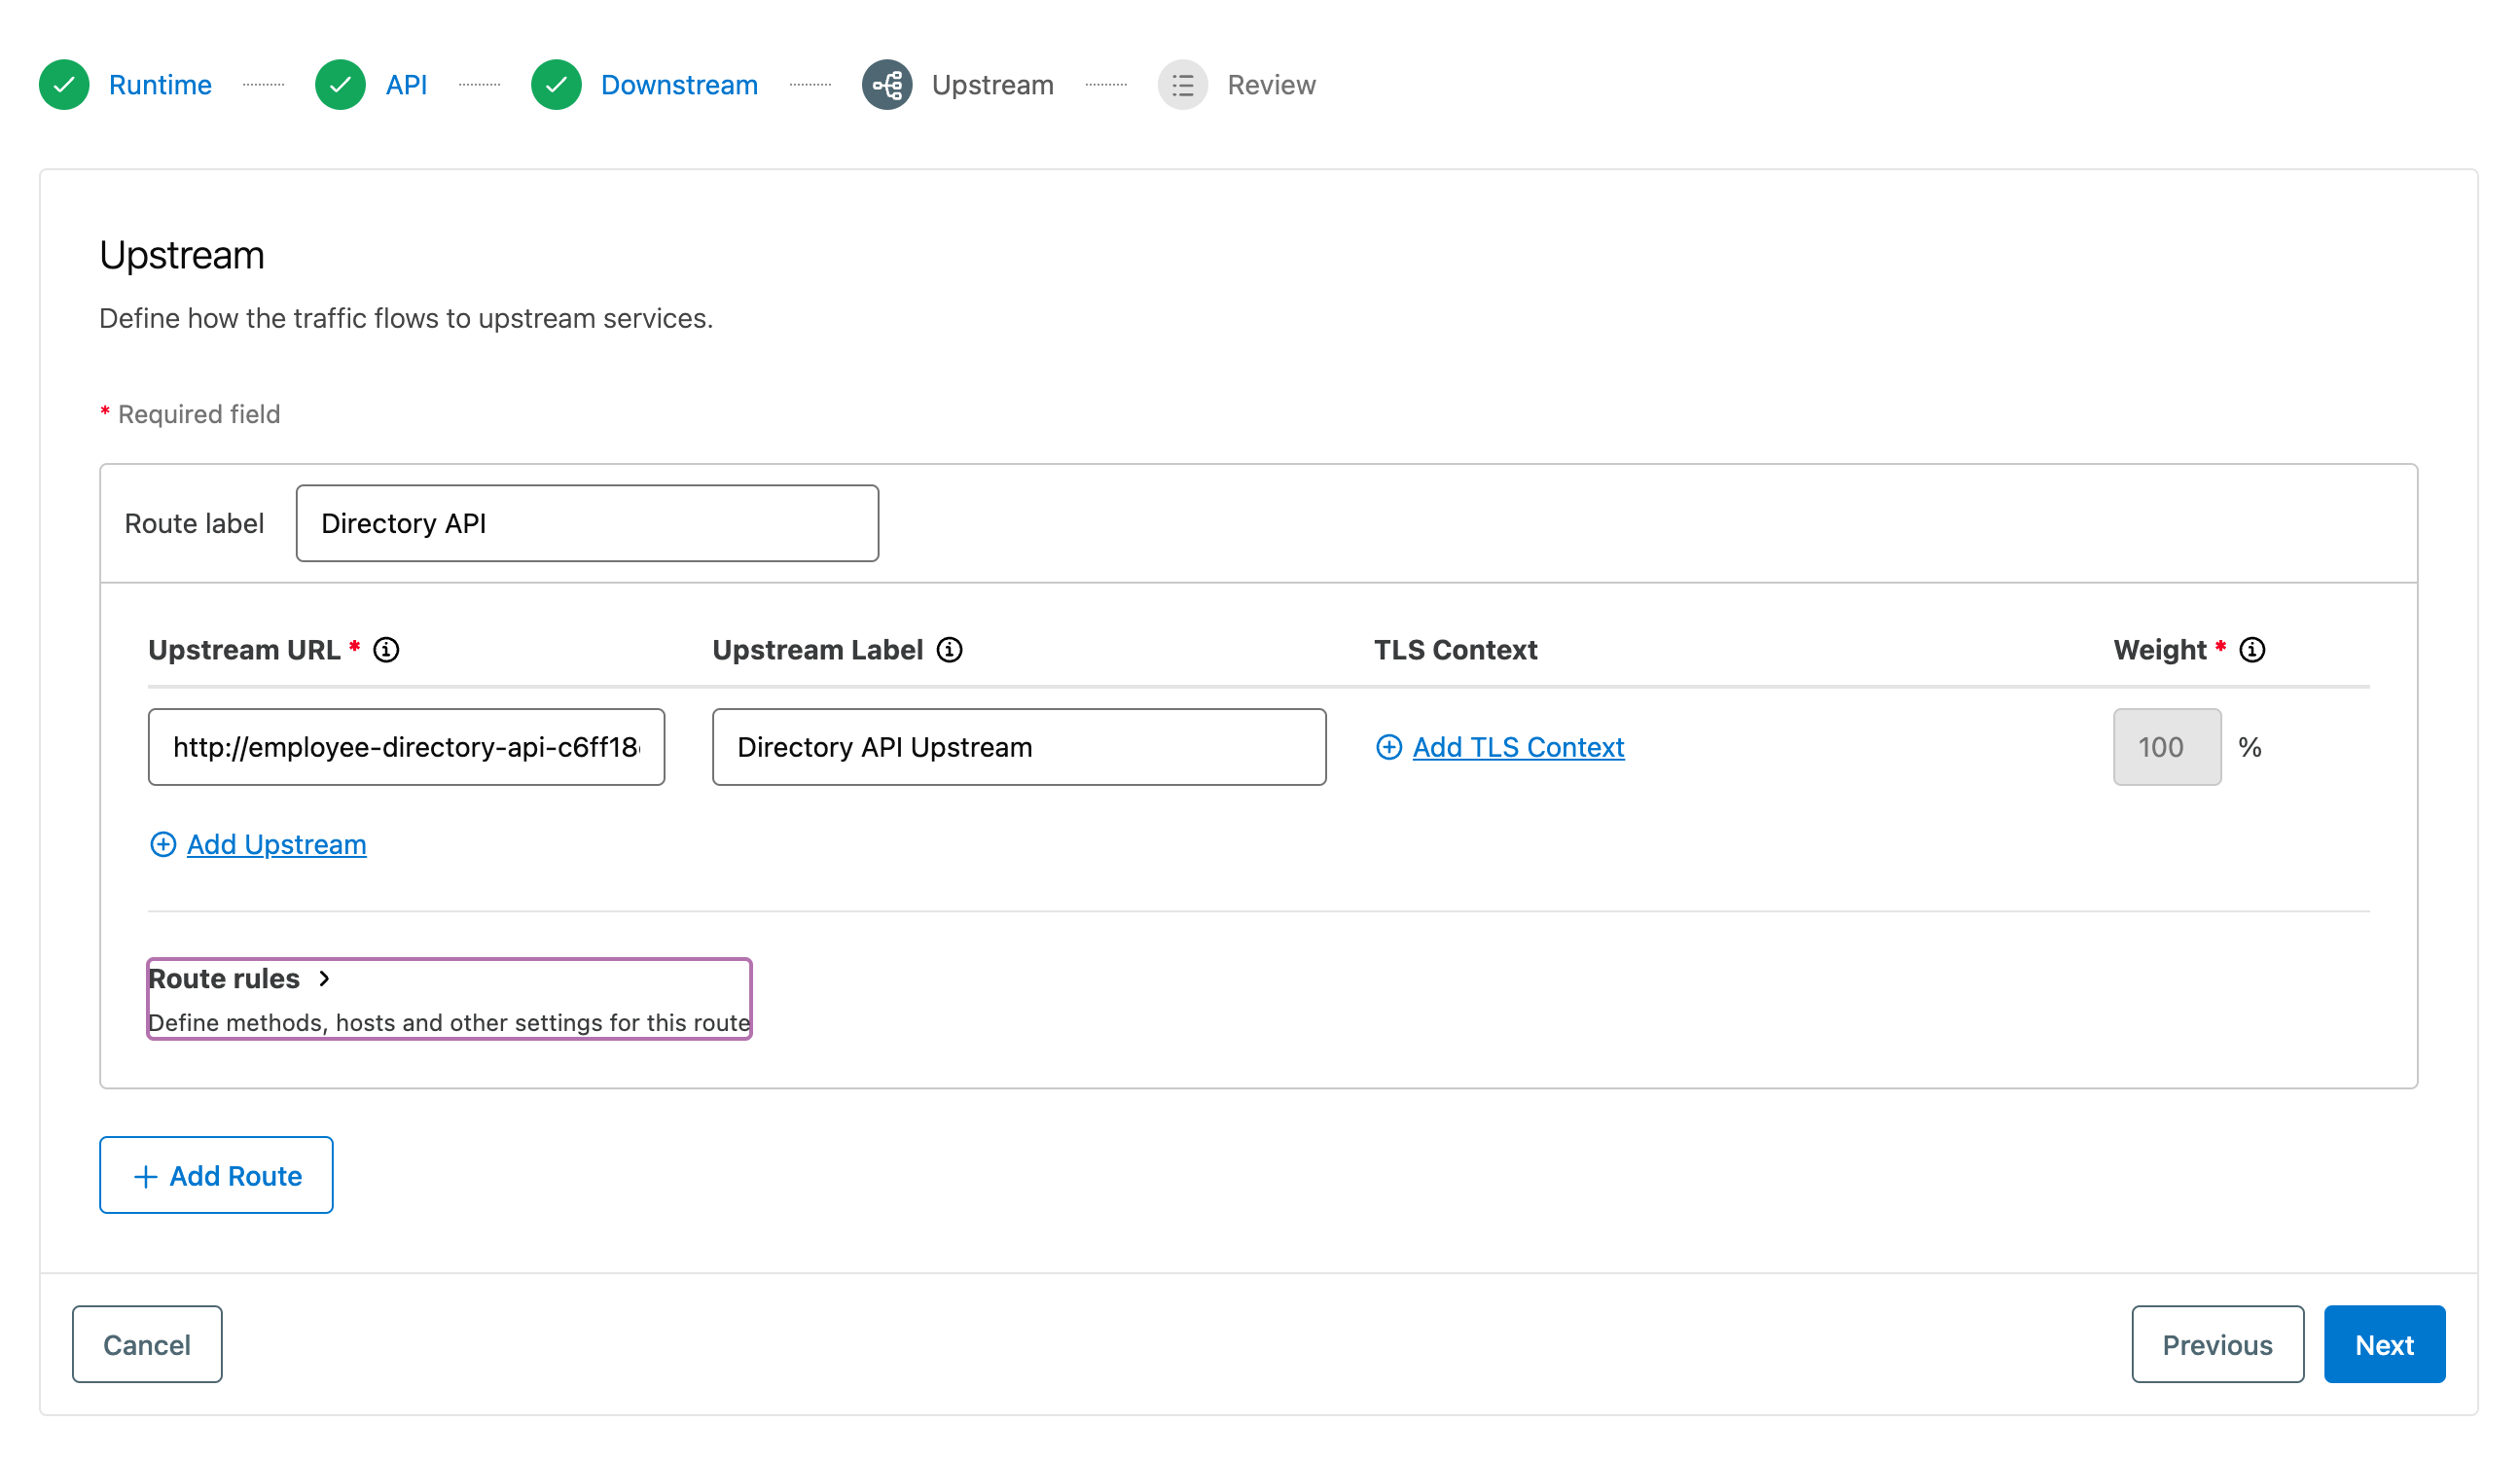
If everything looks good, go ahead and click on Save & Deploy.
As the API is not directly accessible due to internal routing, calling it directly will result in a timeout. However, by calling it through the Flex Gateway, you should be able to retrieve the expected response.
Let’s proceed with a GET request to /directory through the Flex Gateway URL.
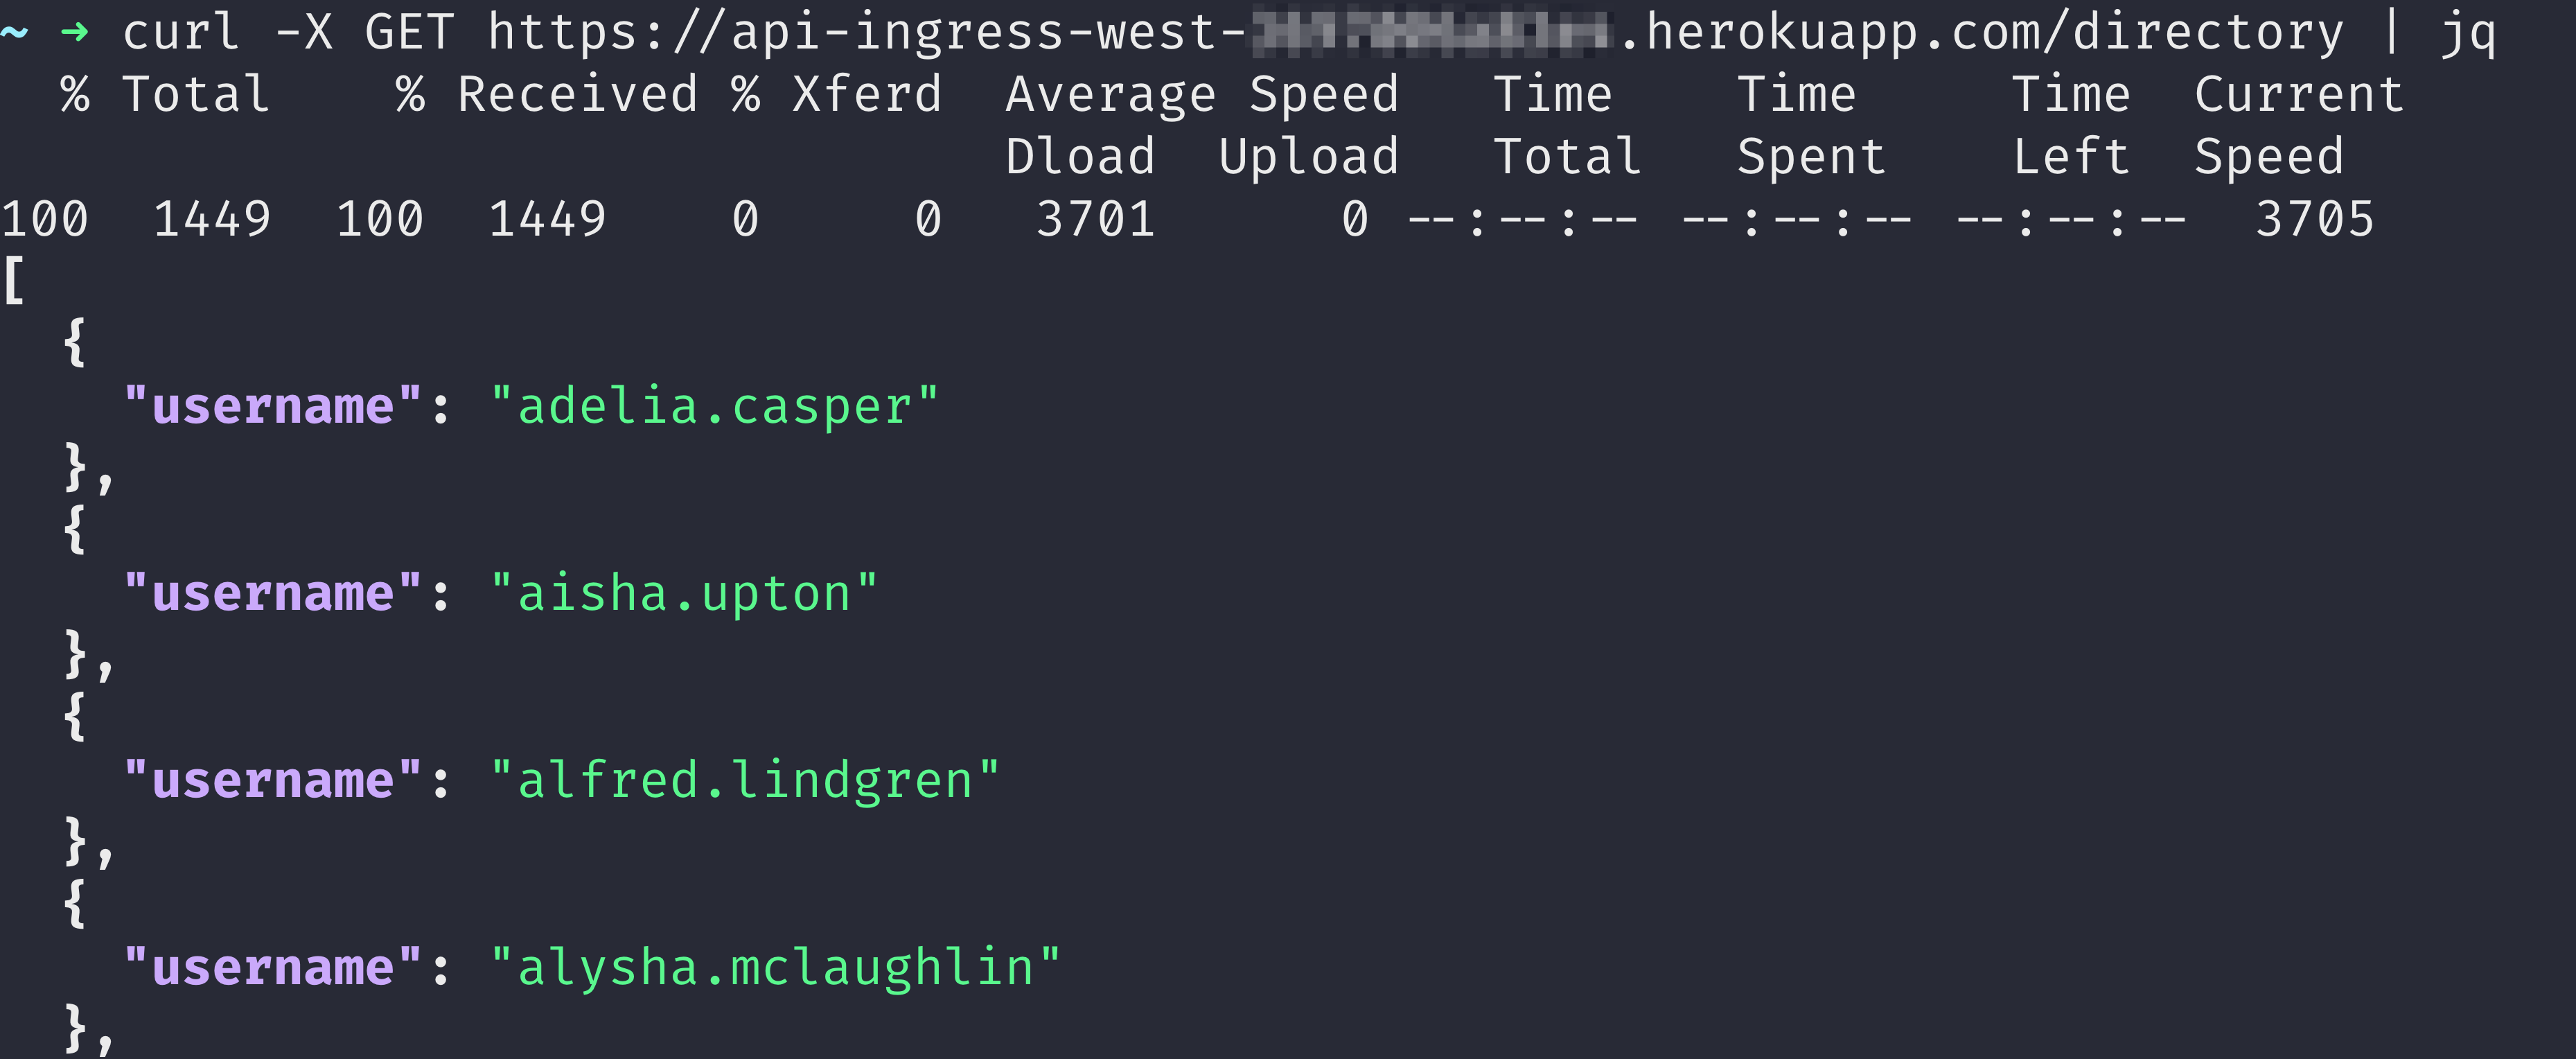
Or you can view the User Directory OpenAPI documentation from our reference app directly on a web browser by using the same URL.
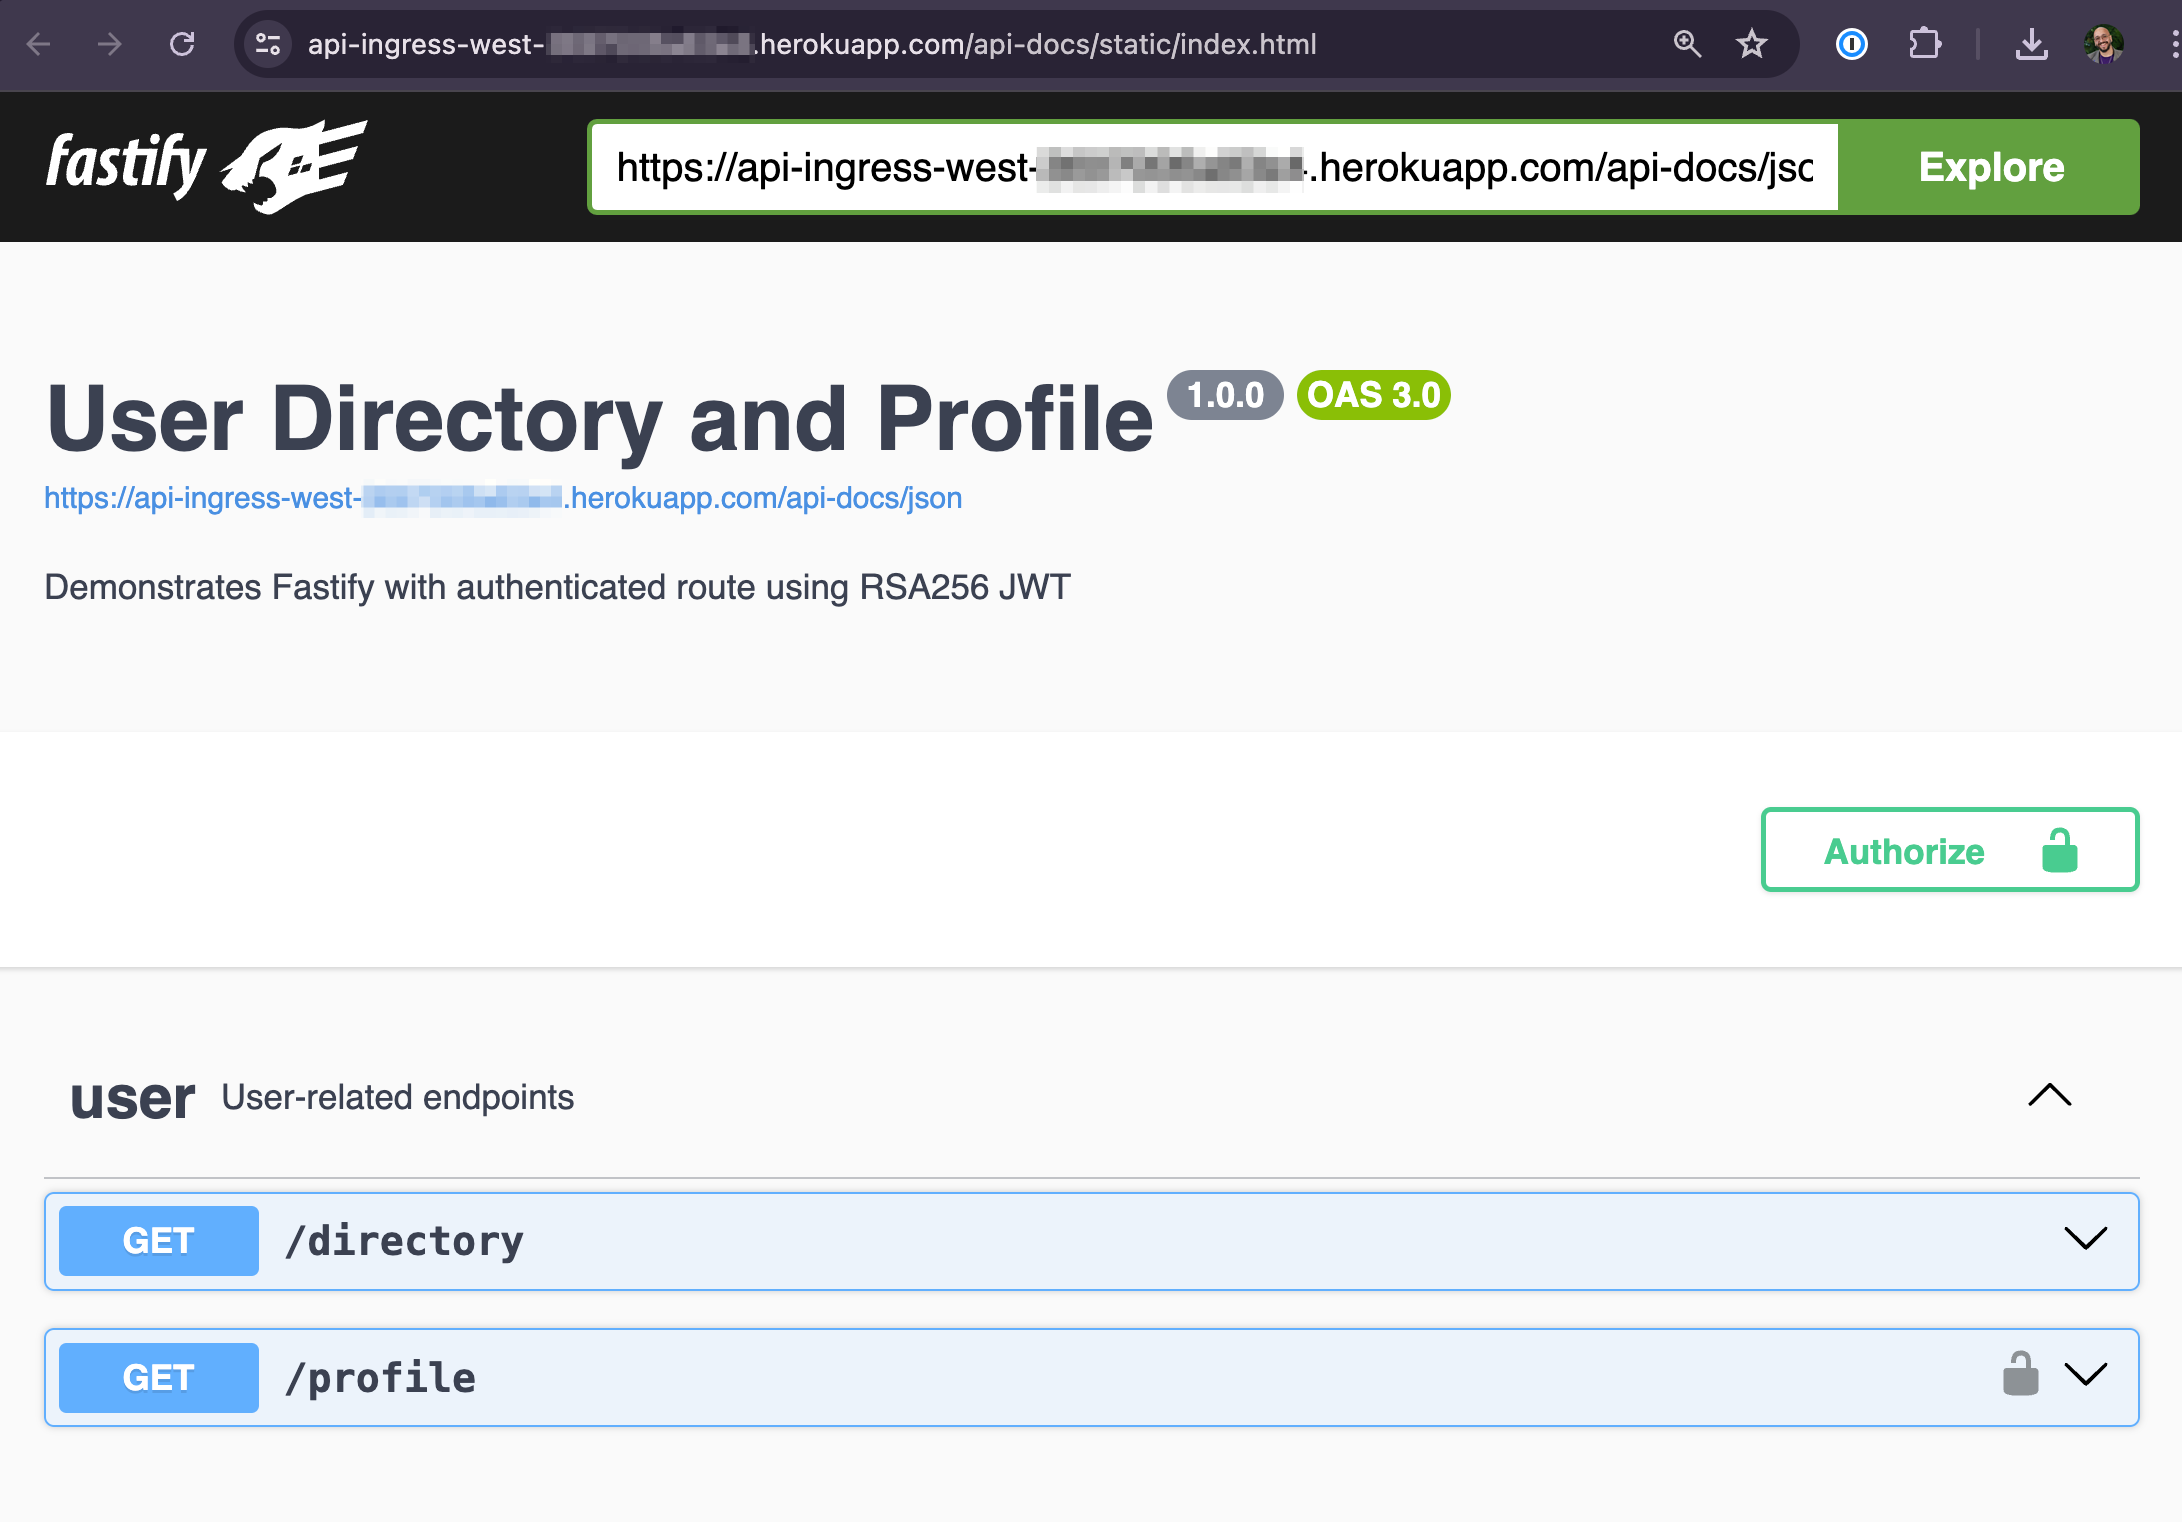
Congratulations, you’ve successfully exposed an internal API deployed in Heroku Private Spaces to the outside world through the Anypoint Flex Gateway running on Heroku. Now you can take full advantage of Anypoint API Manager’s capabilities, including API-Level policies.
Securing your API with Anypoint Flex Gateway
A common pattern for API authentication is using Client ID Enforcement. You can avoid coding your own solution by utilizing the API Manager to apply policies to your API. In this example, we’ll implement Client ID enforcement to secure the API.
To begin, let’s establish an application within Anypoint Platform that will enable us to access the API. Navigate to Exchange, select your API, and in the top right corner, click on Request access.
Then, pick the API instance where your API is deployed, and select an application to grant access to. If you don’t have one, you can create a new application here and click on Request access to obtain the Client and Client Secret credentials.
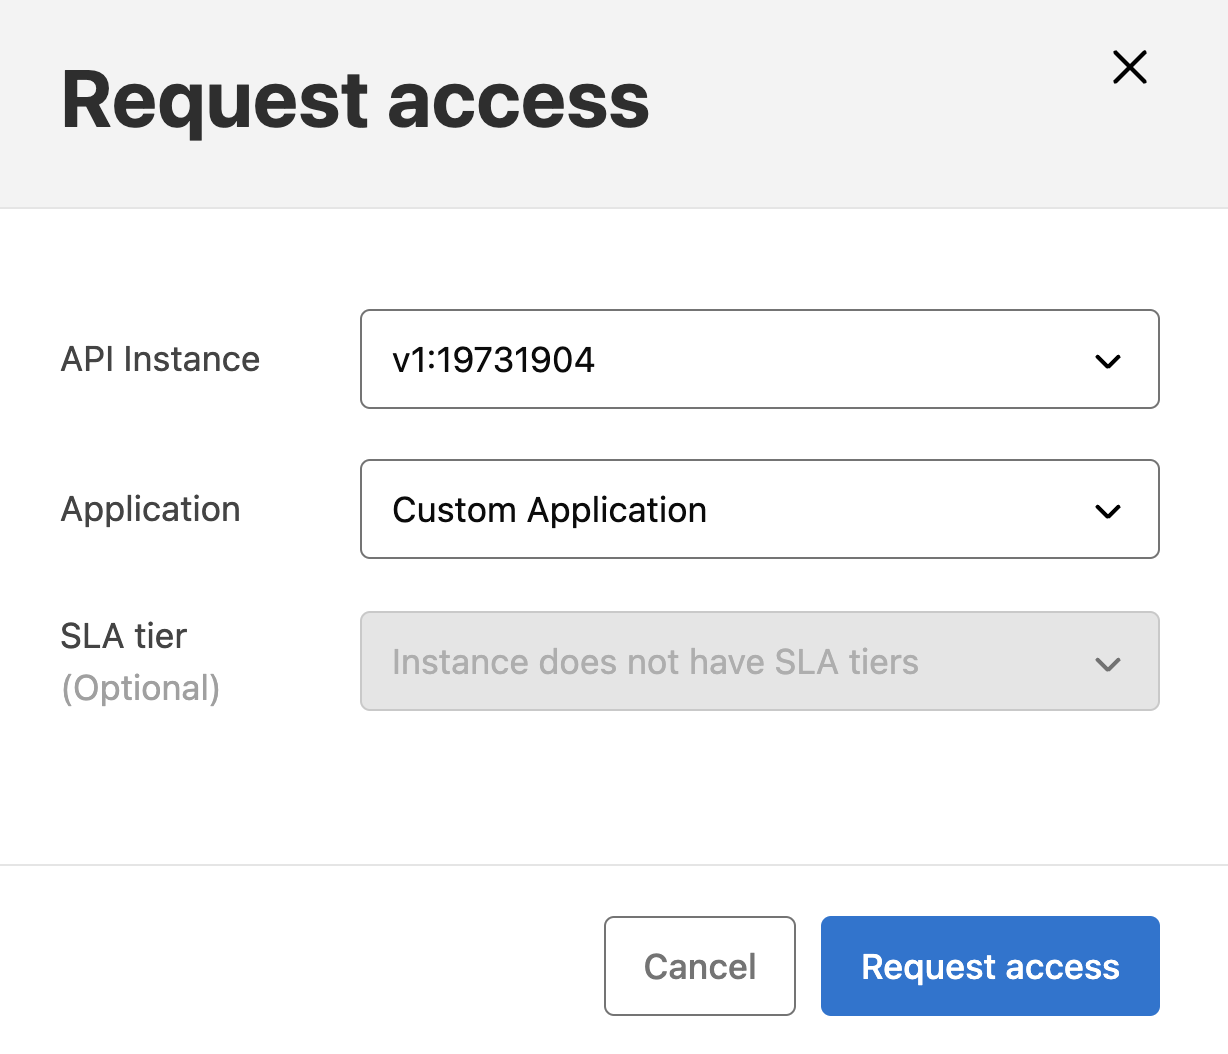
Upon your application’s approval, you’ll receive the Client ID and Client Secret. These credentials will be needed for accessing our newly secured API, so be sure to keep them at hand.
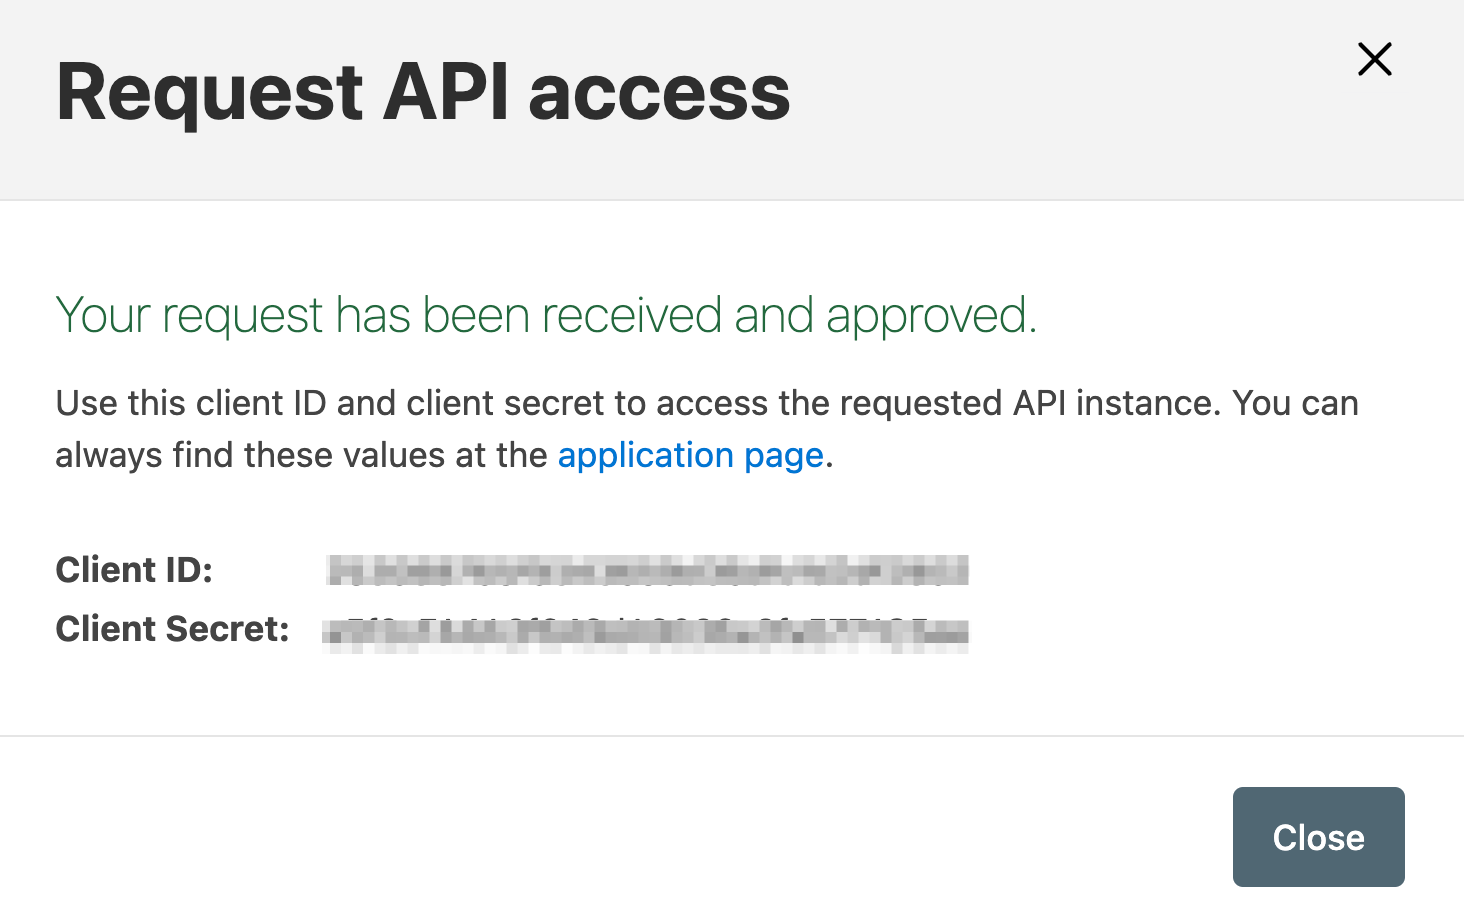
Next, navigate to API Manager, choose the API, and click on Policies in the left menu. Click on Add policy, then select Client ID Enforcement and proceed to Next.
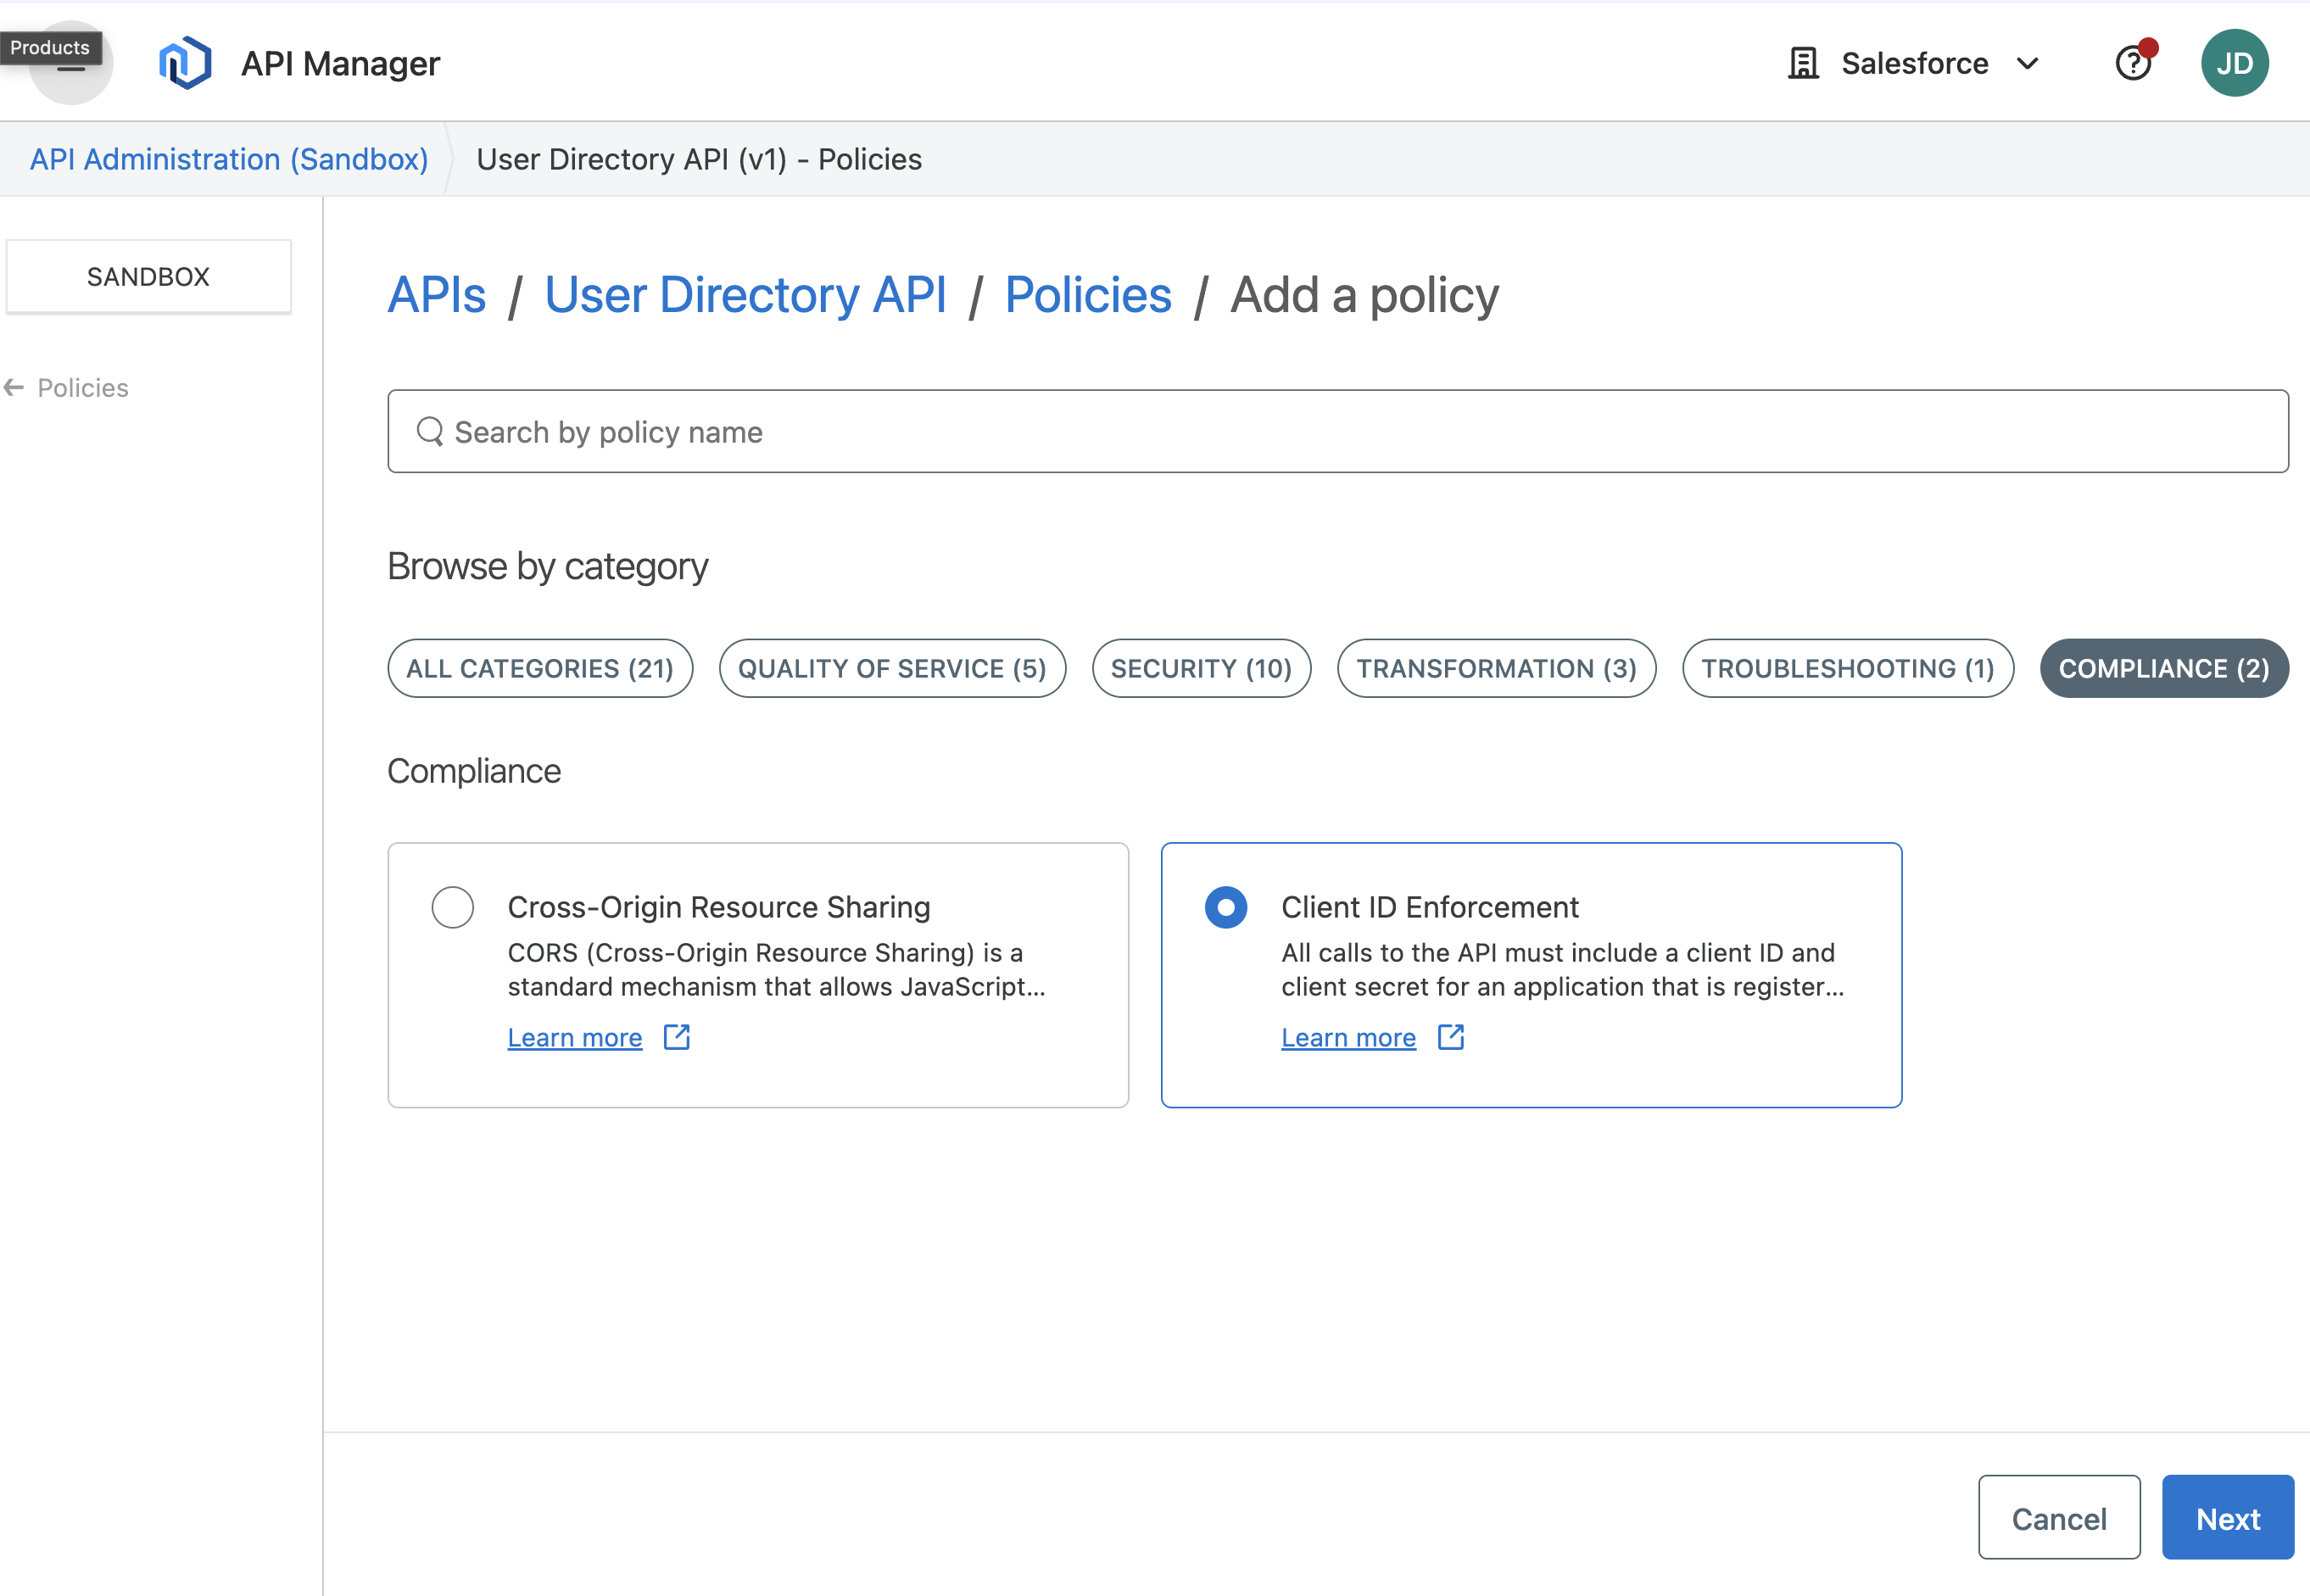
Leave the default configuration for the Client ID Enforcement policy and then click on Apply.

Now that the policy is active, let’s try again a new GET request to the /directory API through the Flex Gateway URL.
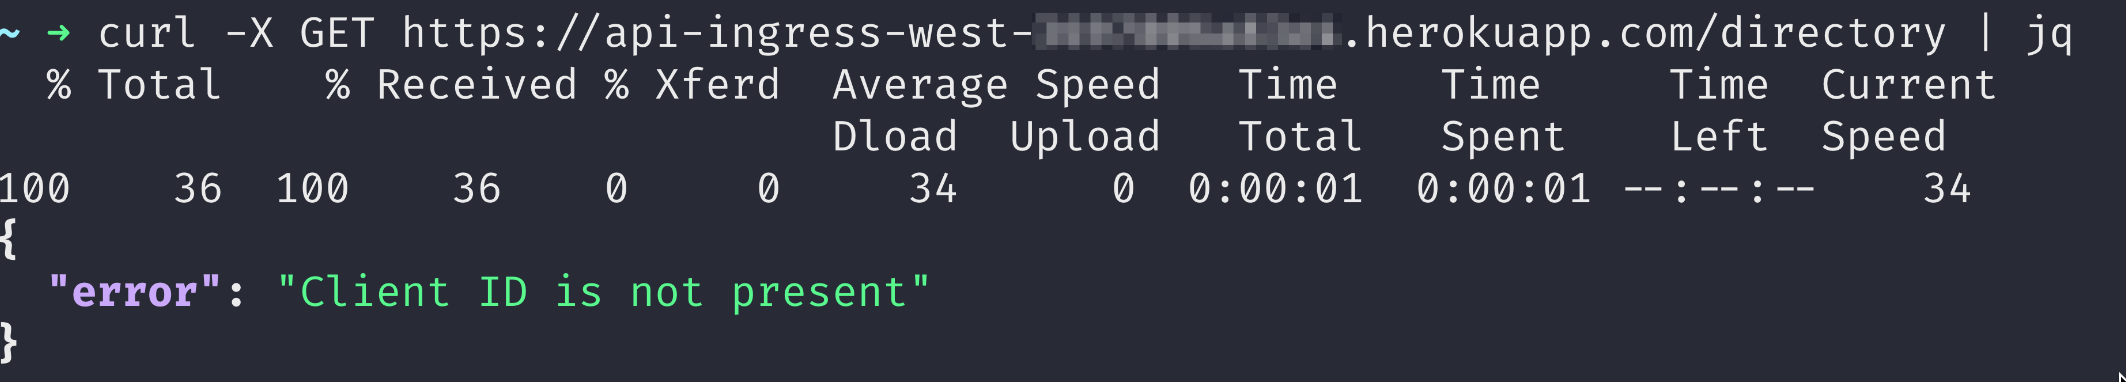
Because we’re enforcing the Client ID, we must include it in the request. Let’s purposely use an incorrect one to witness the authentication attempt failure.

And finally, let’s get the right Client ID and Client Secret in place to test the authentication.

This is just one simple but powerful example of one of many policies that you can apply on the API Manager.
What’s next?
In our next blog post, we’ll delve into the various policies you can employ to improve your API with additional authentication, rate limiting, IP allowlist/blocklist measures, and more. We’ll also show you how to register your API as an External MuleSoft service in Salesforce, ready to be called from Flow and Apex.
Strategic Collaboration for our Customers
The Heroku Customer Solutions Architecture (CSA) team, in collaboration with MuleSoft Engineers, played a pivotal role in this Salesforce multi-cloud integration scenario, they listened to customers and got involved in understanding requirements and technical constraints to propose a preliminary proof-of-concept and a series of incremental changes to achieve a perfect match between Heroku and MuleSoft Flex Gateway.
Heroku Enterprise customers with Premier or Signature Success Plans can request in-depth guidance on this topic from the CSA team. Learn more about Expert Coaching Sessions here or contact your Salesforce account executive.
Learning Resources
- Anypoint Flex Gateway Overview
- Anypoint API Manager documentation
- API Management with MuleSoft Demo series
- Heroku Private Spaces documentation
Authors
Julián Duque
Julián is a Principal Developer Advocate at Heroku, with a strong focus on community, education, Node.js, and JavaScript. He loves sharing knowledge and empowering others to become better developers.
Parvez Mohamed
Parvez Syed Mohamed is a seasoned product management leader with over 15 years of experience in Cloud Technologies. Currently, as Director of Product Management at MuleSoft/Salesforce, he drives innovation and growth in API protection.
Andrea Bernicchia
Andrea Bernicchia is a Senior Customer Solutions Architect at Heroku. He enjoys engaging with Heroku customers to provide solutions for software integrations, architecture patterns, best practices and performance tuning to optimize applications running on Heroku.
The post Mastering API Integration: Salesforce, Heroku, and MuleSoft Anypoint Flex Gateway appeared first on Heroku.
]]>The Heroku CLI is an incredible tool. It’s simple, extendable, and allows you to interact with all the Heroku functionality you depend on day to day. For this reason, it’s incredibly important for us to keep it up to date. Today, we're excited to highlight a major upgrade with the release of Heroku CLI v9.0.0, designed to streamline contributions, building, and iteration processes through the powerful oclif platform .
Version 9.0.0 focuses on architectural improvements. Here's what you need to know: oclif Platform : All core CLI commands are…
The post Heroku CLI v9: Infrastructure Upgrades and oclif Transition appeared first on Heroku.
]]>The Heroku CLI is an incredible tool. It’s simple, extendable, and allows you to interact with all the Heroku functionality you depend on day to day. For this reason, it’s incredibly important for us to keep it up to date. Today, we’re excited to highlight a major upgrade with the release of Heroku CLI v9.0.0, designed to streamline contributions, building, and iteration processes through the powerful oclif platform.
What’s New in Version 9.0.0?
Version 9.0.0 focuses on architectural improvements. Here’s what you need to know:
- oclif Platform: All core CLI commands are built on the oclif platform. Previously, many commands were built using a pre-oclif legacy architecture.
- Unified Package: All core CLI commands are consolidated into a single package, rather than spread across multiple packages. This consolidation makes tasks like dependency management much easier.
- Increased Testing: We greatly improved the code coverage of our unit and integration tests.
- Improved Release Process: Our release process is much simpler and more automated. We can now easily release pre-release versions of the CLI for testing.
- Breaking Changes: With the switch to oclif/core, expect changes in output formatting, including additional new lines, whitespace, table formatting, and output colors. Additional flags now require a — separator, and several commands have updated argument orders or removed flags. We also removed deprecated commands like
outbound-rules,pg:repoint,orgs:default,certs:chain, andcerts:key.
These changes apply only to the core Heroku CLI commands and don’t affect commands installed separately via plugins.
Why We Moved to oclif
For the first time, all core CLI commands are built on the oclif platform. By restructuring the core CLI repository, improving our testing and release processes, and adding telemetry, we laid a solid foundation that allows us to innovate and ship features more quickly and confidently than ever before.
Heroku pioneered oclif (Open CLI Framework) and it’s now the standard CLI technology used at companies like Salesforce, Twillio, and Shopify. It’s a popular framework for building command-line interfaces, offering a modular structure and robust plugin support. By migrating all core CLI commands to oclif, we unified our command architecture, moving away from the legacy systems that previously fragmented our development process. This transition allows for more consistent command behavior, easier maintenance, and better scalability. oclif’s flexibility and widespread adoption underscore its importance in delivering a more reliable and efficient CLI for our users.
Conclusion
The significant architectural enhancements in CLI version 9.0.0 are a testament to Heroku’s commitment to our long-term vision and the exciting developments ahead for our customers. The integration of the oclif platform allows us to deliver a more reliable and efficient CLI, paving the way for future innovations.
Ready to experience the upgrade? Update to CLI version 9.0.0 by running heroku update. For more installation options, visit our Dev Center. We encourage you to try it and share your feedback for enhancing the Heroku CLI and for our full Heroku product via the Heroku GitHub roadmap.
The post Heroku CLI v9: Infrastructure Upgrades and oclif Transition appeared first on Heroku.
]]>The Heroku Node.js buildpack now supports pnpm , an alternative dependency manager. Early Node.js application owners who've taken advantage of pnpm support have seen 10-40% faster install times compared to NPM on Heroku deployments. It’s an excellent choice for managing packages in the Node.js ecosystem because it:
Minimizes disk space with its content-addressable package store. Speeds up installation by weaving together the resolve, fetch, and linking stages of dependency installation.
This post will introduce you to some of the benefits of the pnpm package manager and walk you through creating and deploying a sample…
The post Using pnpm on Heroku appeared first on Heroku.
]]>The Heroku Node.js buildpack now supports pnpm, an alternative dependency manager. Early Node.js application owners who've taken advantage of pnpm support have seen 10-40% faster install times compared to NPM on Heroku deployments. It’s an excellent choice for managing packages in the Node.js ecosystem because it:
- Minimizes disk space with its content-addressable package store.
- Speeds up installation by weaving together the resolve, fetch, and linking stages of dependency installation.
This post will introduce you to some of the benefits of the pnpm package manager and walk you through creating and deploying a sample application.
Prerequisites
Prerequisites for this include:
- A Heroku account (signup).
- A development environment with the following installed:
- Git
- Node.js (v18 or higher)
- Heroku CLI
If you don’t have these already, you can follow the Getting Started with Node.js – Setup for installation steps.
Initialize a new pnpm project
Let’s start by creating the project folder:
mkdir pnpm-demo
cd pnpm-demo
Since v16.13, Node.js has been shipping Corepack for managing package managers and is a preferred method for installing either pnpm or Yarn. This is an experimental Node.js feature, so you need to enable it by running:
corepack enable
Now that Corepack is enabled, we can use it to download pnpm and initialize a basic package.json file by running:
corepack pnpm@9 init
This will cause Corepack to download the latest 9.x version of pnpm and execute pnpm init. Next, we should pin the version of pnpm in package.json with:
corepack use pnpm@9
This will add a field in package.json that looks similar to the following:
"packageManager":
"pnpm@9.0.5+sha256.61bd66913b52012107ec25a6ee4d6a161021ab99e04f6acee3aa50d0e34b4af9"
We can see the packageManager field contains:
- The package manager to use (
pnpm). - The version of the package manager (
9.0.5). - An integrity signature that indicates an algorithm (
sha256) and digest (61bd66913b52012107ec25a6ee4d6a161021ab99e04f6acee3aa50d0e34b4af9) that will be used to verify the downloaded package manager.
Pinning the package manager to an exact version is always recommended for deterministic builds.
engines field of package.json in the same way we already do with npm and Yarn. See Node.js Support – Specifying a Package Manager for more details.
Create the demo application
We’ll create a simple Express application using the express package. We can use the pnpm add command to do this:
pnpm add express
Running the above command will add the following to your package.json file:
"dependencies": {
  "express": "^4.19.2"
}
It will also install the dependency into the node_modules folder in your project directory and create a lockfile (pnpm-lock.yaml).
The pnpm-lock.yaml file is important for several reasons:
- Our Node.js Buildpack requires
pnpm-lock.yamlto enable pnpm support. - It enforces consistent installations and packages resolution between different environments.
- Package resolution can be skipped which enables faster builds.
Now, create an app.js file in your project directory with the following code:
const express = require('express')
const app = express()
const port = process.env.PORT || 3000
app.get('/', (req, res) => {
  res.send('Hello pnpm!')
})
app.listen(port, () => {
  console.log(`pnpm demo app listening on port ${port}`)
})
When this file executes, it will start a web server that responds to an HTTP GET request and responds with the message Hello pnpm!.
You can verify this works by running node app.js and then opening https://localhost:3000/ in a browser.
So Heroku knows how to start our application, we also need to create a Procfile that contains:
web: node app.js
Now we have an application we can deploy to Heroku.
Deploy to Heroku
Let’s initialize Git in our project directory by running:
git init
Create a .gitignore file that contains:
node_modules
If we run git status at this point we should see:
On branch main
No commits yet
Untracked files:
 (use "git add <file>..." to include in what will be committed)
   .gitignore
   Procfile
   app.js
   package.json
   pnpm-lock.yaml
nothing added to commit but untracked files present (use "git add" to track)
Add and commit these files to git:
git add .
git commit -m "pnpm demo application"
Then create an application on Heroku:
heroku create
Not only will this create a new, empty application on Heroku, it also adds the heroku remote to your Git configuration (for more information see Deploying with Git – Create a Heroku Remote).
Finally, we can deploy by pushing our changes to Heroku:
git push heroku main
Conclusion
Integrating pnpm with your Node.js projects on Heroku can lead to more efficient builds and streamlined dependency management, saving time and reducing disk space usage. By following the steps outlined in this post, you can easily set up and start using pnpm to enhance your development workflow. Try upgrading your application to pnpm and deploy it to Heroku today.
The post Using pnpm on Heroku appeared first on Heroku.
]]>My three board stints aligns with significant shifts in the cloud-native landscape. Two are behind us, one is happening now, and it’s the current one that motivated us to join now. Quick preview: It’s not the AI shift going on right now - the substrate…
The post Heroku Joins CNCF as a Platinum Member appeared first on Heroku.
]]>My three board stints aligns with significant shifts in the cloud-native landscape. Two are behind us, one is happening now, and it’s the current one that motivated us to join now. Quick preview: It’s not the AI shift going on right now – the substrate underlying AI/ML shifted to Kubernetes a while ago.
As to why we are joining and why now, let’s take a look at the pivotal shifts that have led us to this point.
The First Shift: Kubernetes Launches – The Early Adopter Phase
It’s been a decade since Kubernetes was launched, and even longer since Salesforce acquired Heroku. Ten years ago, Heroku was primarily used by startups and smaller companies, and Kubernetes 1.0 had just launched (yes, I was on stage for that! Watch the video for a blast from the past). Google Kubernetes Engine (GKE) had launched, but no other cloud services had yet offered a managed Kubernetes solution. I was the Cloud Native CTO at Samsung, and we made an early bet on Kubernetes as transformative to the way we deployed and managed applications both on cloud and on-premises. This was the early adopter phase.
Heroku was one of the early influences on Kubernetes, particularly in terms of developer experience, most notably with The Twelve-Factor App (12-Factor App), which influenced “cloud native” thinking. My presentations from the Kubernetes 1.0 era have Heroku mentions all over them, and it was no surprise to see Heroku highlighted in Eric Brewer’s great talk at the KuberTENes 10th anniversary event. Given Heroku’s legendary focus on user experience, one might wonder why the Kubernetes developer experience turned out the way it did. More on this later, but Kubernetes was built primarily to address the most critical yet painful and error-prone part of the software lifecycle, and the one most people were spending the majority of their time on — operations. In this regard, it is an incredible success. Kubernetes also represented the first broad-based shift to declarative intent as an operational practice, encapsulated by Alexis Richardson as “gitops.” Heroku has a similar legacy: “git push heroku master.” Heroku was doing gitops before it had a name.
The Second Shift: Kubernetes Goes Big
EKS launched six years ago and quickly became the largest Kubernetes managed service, with large companies across all industries adopting it. AWS was the last of the big three to launch a Kubernetes managed service, and this validated that Kubernetes had grown massively and most companies were adopting it as the standard. During this era, Kubernetes was deployed at scale as the primary production system for many companies or the primary production system for new software. Notably, Kubeflow was adopted broadly for ML use cases — Kubernetes was becoming the standard for AI/ML workloads. This continues to this day with generative AI.
During this time, Heroku also matured. Although the credit-card-based Heroku offering remained popular for new startups and citizen developers, the Heroku business shifted rapidly towards the enterprise offering, which is now the majority of the business. Although many think of Heroku as primarily a platform for startups, this hasn’t been the case for many years.
Salesforce was one of the companies that adopted Kubernetes at a huge scale with Hyperforce. The successes of this era (including Hyperforce) were characterized by highly skilled platform teams, often with contributors to Kubernetes or adjacent projects. This demonstrates the value of cloud-native approaches to a company — the significant cost of managing the complexity of Kubernetes and the adjacent systems (including OpenTelemetry, Prometheus, OCI, Docker, Argo, Helm… the CNCF landscape now has over 200 projects) is worth the investment.
However, the large investment in technical expertise is a barrier to even wider adoption beyond the smaller number of more sophisticated enterprises. To be clear, I’m not talking about using EKS, AKS, or GKE—that’s a given. These services are far more cost-effective at running Kubernetes safely and at scale than most enterprises could ever be, thanks to cost efficiencies at scale.
The Third Shift is Afoot: Kubernetes Goes Really Wide
Kubernetes is awesome but complex, and we are seeing the next wave of adopters start to adopt Kubernetes. This wave needs an approach to Kubernetes that provides the benefits without the huge investment. This is why we have shifted the Heroku strategy to be based on Kubernetes going forward. You can hear this announcement during my keynote at KubeCon Paris: Watch the keynote. We are committed to bringing our customers Kubernetes’ benefits on the inside, without the complexity, wrapped in Heroku’s signature simplicity.
Summary: How Should We All Think about Kubernetes?
We view Kubernetes, to quote Jim Zemlin, as the “Linux of the Cloud.” Linux is a single-machine operating system, whereas Kubernetes is the distributed operating system layered on top. Today, Kubernetes is more like the Linux kernel, rather than a full distribution. Various Linux vendors collaborate on a common kernel and differentiate in user space. We view Heroku’s product and contribution to Kubernetes as following that model. We will work with the community on the common unforked Kubernetes but will build great things on top, including Heroku as you know it today.

Final Thoughts
Heroku's commitment to joining the CNCF at the platinum level underscores our dedication to the evolving cloud-native landscape. There’s still more progress to be made for developers & operators alike. That’s why we’re invested in Cloud Native Buildpacks. It lets companies standardize how they build application container images. People can hit the ground running with our recently open sourced Heroku Cloud Native Buildpacks. As Kubernetes and the other constellation of projects around it continue to expand, we are excited to participate, ensuring our customers benefit from its capabilities while maintaining the simplicity and user experience that Heroku is known for.
The post Heroku Joins CNCF as a Platinum Member appeared first on Heroku.
]]>The post Optimizing Data Reliability: Heroku Connect & Drift Detection appeared first on Heroku.
]]>PensionBee, the U.K.-based company, is on a mission to make pensions simple and engaging by building a digital-first pension service on Heroku. PensionBee’s consumer-friendly web and mobile apps deliver sophisticated digital experiences that give people better visibility and control over their retirement savings.
PensionBee’s service relies on a smooth flow of data between the customer-facing app on Heroku and Salesforce on the backend. Both customers and employees need to view and access the most current account data in real time. Heroku Connect ensures all of PensionBee’s systems stay in sync to provide the best end-user experience.

Understanding Data Drift
Heroku Connect reads data from Salesforce and updates Postgres by polling for changes in your Salesforce org within a time window. The initial poll done to bring in changes from Salesforce to Postgres is called a “primary poll”. As the data syncs to Postgres, the polling window moves to capture the next set of changes from Salesforce. The primary poll syncs almost all changes, but it’s possible to miss some changes that lead to “drift”.
Heroku Connect does the hard work of monitoring for “drift” for you and ensures the data eventually becomes consistent. We have now increased the efficiency of this feature to recognize and address drift detection even faster on your behalf. As before, this process is transparent to you; however, we thought our customers might enjoy understanding a bit more about what is going on behind the scenes.
There are several complications in ensuring that the data sync between the two systems is performant while being reliable. One complication is when Heroku Connect polls a Salesforce object for changes, and a long-running automation associated with record updates doesn’t commit data at that time. When those transactions are committed, the polling window could have already moved on to capture the next set of changes in Salesforce. Those missed long-running transactions result in drift. Heroku Connect handles those missed changes seamlessly for its customers.
Drift Detection: Ensuring Data Accuracy and Consistency
Heroku Connect tracks poll windows for each mapping while retrying any failed polls. Drift detection uses a “secondary poll” to catch and fix any changes the primary poll missed. Heroku Connect tracks the poll bounds of the primary poll and schedules a secondary poll for the same poll bounds after some time. Depending on the size of the dataset the primary poll is synchronizing, Heroku Connect uses either the Bulk API or SOAP API for polling. Heroku Connect leverages Salesforce APIs without impacting your API usage limits and license.
With the Bulk API, Heroku Connect creates a bulk job and adds bulk batches to the bulk job during the primary poll. Heroku Connect tracks the poll bounds for each bulk batch, and then performs a secondary poll corresponding to the poll bounds for each bulk batch in the primary poll. During the secondary poll, Heroku Connect creates a bulk job for each bulk batch processed by the primary poll. Sync using Heroku Connect is asynchronous with retries, so it isn’t real-time, though it appears to be.
Scale and Performance Improvements
As Heroku Connect serves more customers with increasingly large mappings, we continue to ensure we provide a scalable, reliable, and performant solution for our customers. One of the areas where we made significant improvements is the way we manage and schedule secondary polls for drift detection, especially for polls that use the Bulk API.
Reduced load on the Salesforce org
In the old process, the secondary poll created a large number of bulk jobs in Salesforce. Now the secondary poll only creates a single bulk job for each bulk job created by the primary poll. Then, for each bulk batch processed by the primary poll, a bulk batch is added to the secondary poll’s bulk job.
Optimized management of the secondary poll
Previously, there was no limit on the number of bulk tasks processed by the secondary poll at a time. As primary bulk batches completed, any number of secondary bulk tasks were scheduled and executed simultaneously. Now Heroku Connect schedules and executes secondary polls so that there’s limited bulk activity at a time. This helps with:
- Improved availability of database connections: Heroku Connect opens database connections as it updates data in Postgres from Salesforce. With an unlimited number of simultaneous secondary poll tasks, Heroku Connect opens a large number of database connections, leaving fewer connections for your applications accessing the same database. By limiting secondary poll tasks and scheduling them in a controlled way, Heroku Connect uses a much smaller number of database connections at any given time, allowing your applications enough connections to work with.
- Improved operational reliability: Our optimizations in scheduling secondary polls enhance the overall performance, ensuring that even during heavy sync activities, the quality of service remains high for all users sharing the underlying infrastructure.
Conclusion
At Heroku, we take the trust, reliability, and availability of our platform seriously. By investing in projects such as improving drift detection, we’re constantly working to improve the resilience of our systems and provide the best possible experience so our customers like PensionBee can continue to rely on Heroku Connect to keep their data in sync. Thank you for choosing Heroku!
If you have any thoughts or suggestions on future reliability improvements we can make, check out our public roadmap on GitHub and submit an issue!
About the Authors
Siraj Ghaffar is a Lead Engineer for Heroku Connect at Salesforce. He has broad experience in distributed, scaleable, and reliable systems. You can follow him on LinkedIn.
Vivek Viswanathan is a Director of Product Management for Heroku Connect at Salesforce. He has more than a decade of experience with the Salesforce ecosystem, and his primary focus for the past few years has been scalable architecture and Heroku. You can follow him on LinkedIn.
The post Optimizing Data Reliability: Heroku Connect & Drift Detection appeared first on Heroku.
]]>“The difference was noticeable right from the start. Heroku Postgres running on Aurora delivered a boost in speed, allowing us to query and process our data faster.”
Our Heroku Postgres Essential plans are the quickest, easiest, and most economical way to integrate a SQL database with…
The post Introducing New Heroku Postgres Essential Plans Built On Amazon Aurora appeared first on Heroku.
]]>pgvector support, no row count limits, and come with a 32 GB option. We deliver exceptional transactional query performance with Amazon Aurora as the backing infrastructure. One of our beta customers said:
“The difference was noticeable right from the start. Heroku Postgres running on Aurora delivered a boost in speed, allowing us to query and process our data faster.”
Our Heroku Postgres Essential plans are the quickest, easiest, and most economical way to integrate a SQL database with your Heroku application. You can use these fully managed databases for a wide range of applications, such as small-scale production apps, research and development, educational purposes, and prototyping. These plans offer full PostgreSQL compatibility, allowing you to use existing skills and tools effortlessly.

Compared to the previous generation of Mini and Basic database plans, the Essential plans on the new infrastructure provides up to three times the query throughput performance and additional improvements such as removing the historic row count limit. The table highlights what each of the new plans include in more detail.
| Product | Storage | Max Connection | Max Row Count | Max Table Count | Postgres Versions | Monthly Pricing |
|---|---|---|---|---|---|---|
| Essential-0 | 1 GB | 20 | No limit | 4,000 | 14, 15, 16 | $5 |
| Essential-1 | 10 GB | 20 | No limit | 4,000 | 14, 15, 16 | $9 |
| Essential-2 | 32 GB | 40 | No limit | 4,000 | 14, 15, 16 | $20 |
Our Commitment to the Developer Experience
At Heroku, we deliver a world-class developer experience that’s reflected in our new Essential database plans. Starting at just $5 per month, we provide a fully managed database service built on Amazon Aurora. With these plans, developers are assured they’re using the latest technology from AWS and they can focus on what’s most important—innovating and building applications—without the hassle of database management.
We enabled pg:upgrade for easier upgrades to major versions and removed the row count limit for increased flexibility and scalability for your projects. We also included support for the pgvector extension, bringing vector similarity search to the entire suite of Heroku Postgres plans. pgvector enables exciting possibilities in AI and natural language processing applications across all of your development environments.
You can create a Heroku Postgres Essential database with:
$ heroku addons:create heroku-postgresql:essential-0 -a example-app
Migrating Mini and Basic Postgres Plans
If you already have Mini or Basic database plans, we’ll automatically migrate them to the new Essential plans. We’re migrating Mini plans to Essential-0 and Basic plans to Essential-1. We’re making this process as painless as possible with minimal downtime for most databases. Our automatic migration process begins on May 29, 2024, when the Mini and Basic plans reach end-of-life and are succeeded by the new Essential plans. See our documentation for migration details.
You can also proactively migrate your Mini or Basic plan to any of the new Essential plans, including the Essential-2 plan, using addons:upgrade:
$ heroku addons:upgrade DATABASE heroku-postgresql:essential-0 -a example-app
Exploring the Use Cases of the Essential Plans
With the enhancements of removing row limits, adding pgvector support, and more, Heroku Postgres Essential databases are a great choice for customers of any size with these use cases.
- Development and Testing: Ideal for developers looking for a cost-effective, fully managed Postgres database. You can develop and test your applications in an environment that closely mimics production, ensuring everything runs smoothly before going live.
- Prototype Projects: In the prototyping phase, the ability to adapt quickly based on user feedback or test results is crucial. With Essential plans, you get the flexibility and affordability needed to iterate fast and effectively during this critical stage.
- Educational Projects and Tutorials: Ideal for educational setups that require access to live cloud database environments. They're perfect for hands-on learning, from running SQL queries to exploring cloud application management and operations, without managing the complex infrastructure.
- Low Traffic Web Apps: Ideal for experimental or low traffic applications such as small blog sites or forums. Essential plans provide the necessary reliability and performance, including daily backups and scalability options as your user engagement grows.
- Startups: The Essential plans offer a fully managed and scalable database solution, important for startup businesses to grow without initial heavy investments. It can help speed up time-to-market and reach customers faster.
- Salesforce Integration Trial: The best method to synchronize Salesforce data and Heroku Postgres is with Heroku Connect. The
demoplan works with Essential database plans. Although the demo plan isn’t suitable for production use cases, it provides a way to explore how Heroku Connect can amplify your Salesforce investment. - Incorporating pgvector: Essential database plans support
pgvector, an open-source extension for Postgres designed for efficient vector search capabilities. This feature is invaluable for applications requiring high-performance similarity searches, such as recommendation systems, content discovery platforms, and image retrieval systems. Usepgvectoron Essential plans to build advanced search functionalities such as AI-enabled applications and Retrieval Augmented Generation (RAG).
Looking Forward
As announced at re:Invent 2023, we’re collaborating with the Amazon Aurora team on the next-generation Heroku Postgres infrastructure. This partnership combines the simplicity and user experience of Heroku with the robust performance, scalability, and flexibility of Amazon Aurora. The launch of Essential database plans marks the beginning of a broader rollout that will soon include a fleet of single-tenant databases.
Our new Heroku Postgres plans will decouple storage and compute, allowing you to scale storage up to 128 TB. They’ll also add more database connections and more Postgres extensions, offer near-zero-downtime maintenance and upgrades, and much more. The future architecture will ensure fast and consistent response times by distributing data across multiple availability zones with robust data replication and continuous backups. Additionally, the Shield option will continue to meet compliance needs with regulations like HIPAA and PCI, ensuring secure data management.
Conclusion
Our Heroku Postgres databases built on Amazon Aurora represent a powerful solution for customers seeking to enhance their database capabilities with a blend of performance, reliability, cost-efficiency, and Heroku’s simplicity. Whether you're scaling a high web traffic application or managing large-scale batch processes, our partnership with AWS accelerates the delivery of Postgres innovations to our customers. Eager to be part of this journey? Join the waitlist for the single-tenant database pilot program.
We want to extend our gratitude to the community for the feedback and helping us build products like Essential Plans. Stay connected and share your thoughts on our GitHub roadmap page. If you have questions or require assistance, our dedicated Support team is available to assist you on your journey into this exciting new frontier.
The post Introducing New Heroku Postgres Essential Plans Built On Amazon Aurora appeared first on Heroku.
]]>Developers configure and manage their applications through a command line interface (CLI), especially during development when working within their integrated development environment (IDE). Heroku apps can be deployed in many different ways, and all that flexibility can be controlled through the CLI. This results in…
The post Heroku Integration with Amazon Q Developer Command Line appeared first on Heroku.
]]>Developers configure and manage their applications through a command line interface (CLI), especially during development when working within their integrated development environment (IDE). Heroku apps can be deployed in many different ways, and all that flexibility can be controlled through the CLI. This results in thousands of command options and flag combinations, and it's nearly impossible to remember them all and what they do. Searching through documentation pages and scrolling through dozens of flags and options to figure things out takes time.
With our new integration with Amazon Q, we are offering suggestions on how to complete any heroku CLI command. This new feature eliminates the need for Heroku users to remember or look up the exact CLI flag and/or syntax to execute the proper command.
The image below demonstrates how Amazon Q Developer predicts the next argument in the heroku addons:create -a command. Command completion here recognizes the addons:create command as well as the -a flag, and creates a prompt with the available apps to complete the command.

Amazon Q Developer predicts commands from any terminal window, including terminals launched within VS Code. Amazon Q Developer is part of the AWS Toolkit for Visual Studio Code, which offers additional developer productivity tools for software development and deployment of all AWS services.
Conclusion
The integration of Amazon Q Developer with Heroku CLI is a testament to the collaborative efforts of Salesforce and AWS to bring our customers the best developer experience possible. It's available for download and use right now. We encourage you to try it and share your thoughts or suggestions for enhancing the Heroku CLI and developer experience. You can explore this feature in our public roadmap on GitHub and submit an issue to contribute to the ongoing development.
The post Heroku Integration with Amazon Q Developer Command Line appeared first on Heroku.
]]>When businesses bring data from Heroku Postgres into Salesforce Data Cloud to create unified customer profiles, they can deliver highly personalized user experiences and give them a competitive advantage.
Today, we‘re excited to announce the launch of the…
The post Introducing the Heroku Postgres Connector for Salesforce Data Cloud appeared first on Heroku.
]]>When businesses bring data from Heroku Postgres into Salesforce Data Cloud to create unified customer profiles, they can deliver highly personalized user experiences and give them a competitive advantage.
Today, we‘re excited to announce the launch of the Heroku Postgres Connector, now part of the Salesforce Data Cloud suite of no-cost connectors. This data connector enables seamless one-way data synchronization from Heroku Postgres to Data Cloud, empowering you to develop customer-facing apps on Heroku and unify Postgres data with Data Cloud.
A Data Connector That Unlocks New Possibilities with Heroku and Data Cloud
Every click and every interaction holds valuable insights into customer preferences and behaviors. Harnessing this data can revolutionize your approach to customer engagement and drive your business forward. You can design a web application hosted on Heroku to capture this engagement data into Heroku Postgres. This data isn't just numbers and metrics; it's a window into your customers' interests and their journey with your brand. The Heroku Postgres Connector for Data Cloud makes it easier to sync the data from your web or mobile apps on Heroku Postgres to Data Cloud, so you can customize your apps to your customer's needs.
By harnessing the power of Heroku and Salesforce Data Cloud, you're not just building a web application — you're creating a digital experience that fosters deeper connections with your customers. This digital experience enables you to understand your customers better, anticipate their needs, exceed their expectations, and drive success like never before. Additionally, this data can then be used to generate an enriched Customer 360 and actionable insights. The following diagram illustrates the Heroku app connectivity to Data Cloud via Heroku Postgres Connector.

In addition, Heroku Postgres Connector for Data Cloud unlocks many interesting use cases.
Deliver Personalized Experiences: With Data Cloud and Heroku Postgres, you can integrate valuable data from your Heroku app to create a unified customer profile, unlocking insights and enhancing engagement and satisfaction. For example, e-commerce customers can roll out personalized shopping apps and marketing journeys that predict consumer spending behaviors and provide tailored offers.
Automate Customer Engagement: By using our powerful data connector to sync data from Heroku Postgres to Data Cloud, you can create automations based on how your customers interact with your app. Depending on a customer’s interactions, you can automate sending personalized marketing campaigns, identifying potential opportunities, or creating cases in Salesforce.
Simplify Custom Data Transformation: Leverage Heroku Postgres to move data from external systems and applications, to simplify data transformations. Combined with Heroku DevOps and scalable compute; custom transformation in large data sets can be efficiently managed programmatically with low-latency. After the transformation process, with the Heroku Postgres Connector, you can seamlessly synchronize your data with the Data Cloud.
Get Started with the Heroku Postgres Connector
Setting up the data connector is easy with a point-and-click UI. All you need is your database credentials for your Heroku Postgres database and Data Cloud enabled in your Salesforce org to set up the connector. Check out the Connecting Heroku Postgres to Salesforce Data Cloud article on getting started.
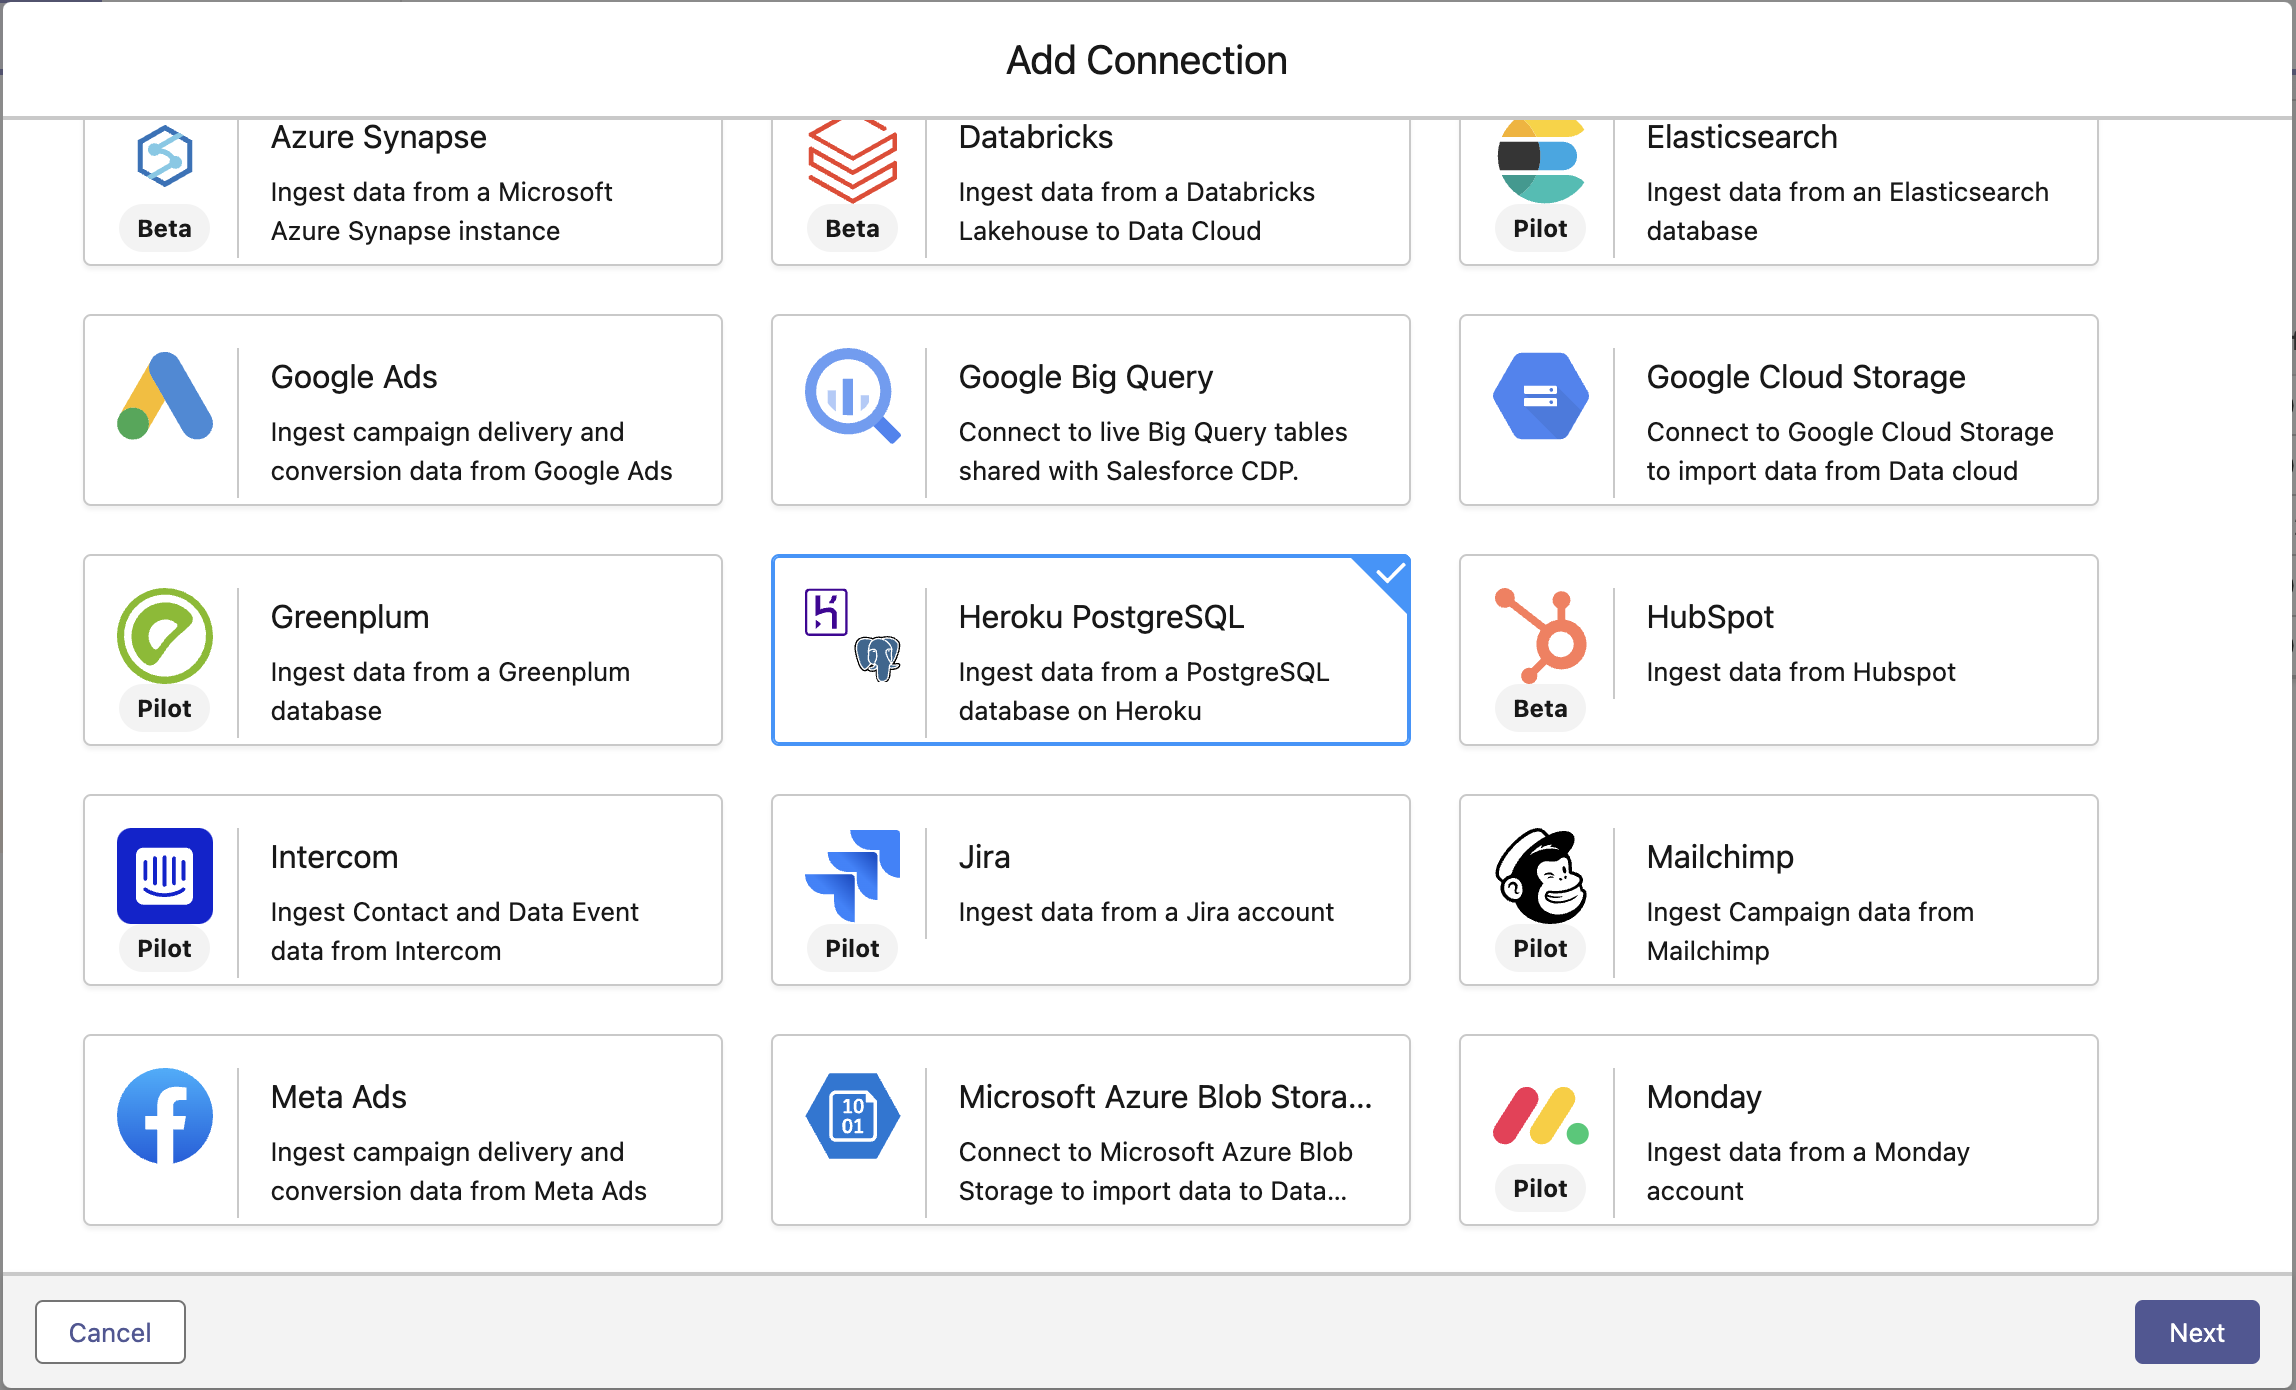
Leverage the Power of Heroku's Data Connector
At Heroku, we make it easy to simplify interactions with Data Cloud and other Salesforce products to enhance the customer experience. The introduction of the Heroku Postgres Connector for Data Cloud represents seamless integration of both Salesforce Products. As you explore the possibilities of Data Cloud integration with Heroku, we encourage you to share your innovative ideas with us.
If you have any thoughts or suggestions on future reliability improvements we can make, check out our public roadmap on GitHub and submit an issue!
The post Introducing the Heroku Postgres Connector for Salesforce Data Cloud appeared first on Heroku.
]]>Keeping Heroku “boring” enough to…
The post Evolving the Backend Storage for Platform Metrics appeared first on Heroku.
]]>Keeping Heroku “boring” enough to be trusted with your mission-critical workloads takes a lot of not-at-all-boring work, however! In this post, we’d like to give you a peek behind the curtain at an infrastructure upgrade we completed last year, migrating to a new-and-improved storage backend for platform metrics. Proactively doing these kinds of behind-the-scenes uplifts is one of the most important ways that we keep Heroku boring: staying ahead of problems by continuously making things more secure, more reliable, and more efficient for our customers.
Metrics (as a Service)
A bit of context before we get into the details: our Application Metrics and Alerting, Language Runtime Metrics, and Autoscaling features are powered by an internal-to-Heroku service called “MetaaS,” short for “Metrics as a Service.” MetaaS collects many different “observations” from customer applications running on Heroku, like the amount of time it took to serve a particular HTTP request. Those raw observations are aggregated to calculate per-application, per-minute statistics like the median, max, and 99th-percentile response time. The resulting time series metrics are rendered on the Metrics tab of the Heroku dashboard, as well as used to drive alerting and autoscaling.
At the core of MetaaS lie two high-scale, multi-tenant data services. Incoming observations — a couple hundred thousand every second — are initially ingested into Apache Kafka. A collection of stream-processing jobs consume observations from Kafka as they arrive, calculate the various different statistics we track for each customer application, publish the resulting time series data back to Kafka, and ultimately write it to a database (Apache Cassandra at the time) for longer-term retention and query. MetaaS’s time-series database stores many terabytes of data, with tens of thousands of new data points written every second and several thousand read queries per second at peak.
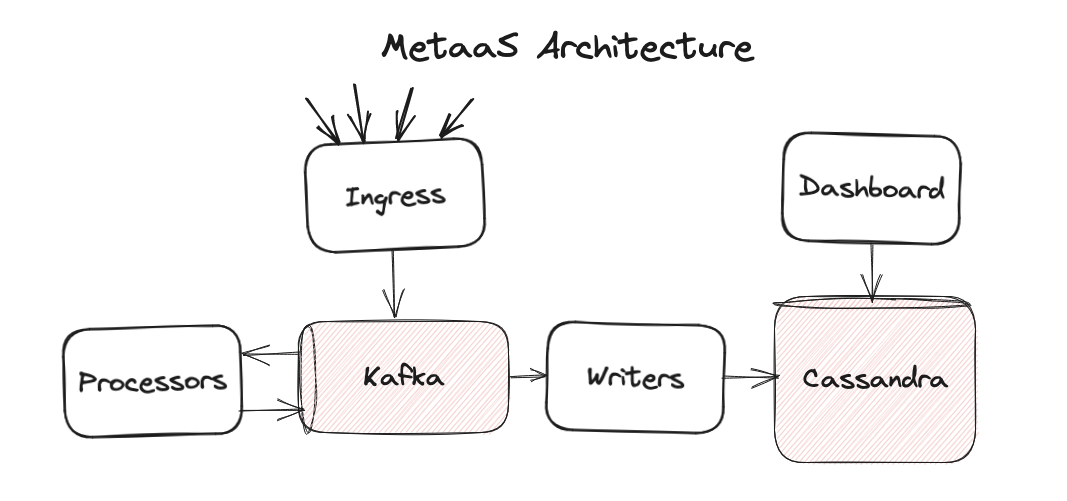
A Storied Legacy
MetaaS is a “legacy” system, which is to say that it was originally designed a while ago and is still here getting the job done today. It’s been boring in all the ways that we like our technology to be boring; we haven’t needed to think about it all that much because it’s been reliable and scalable enough to meet our needs. Early last year, however, we started to see some potential “excitement” brewing on the horizon.
MetaaS runs on the same Apache Kafka on Heroku managed service that we offer to our customers. We’re admittedly a little biased, but we think the team that runs it does a great job, proactively taking care of maintenance and tuning for us to make sure things continue to be boring. The Cassandra clusters, on the other hand, were home-grown just for MetaaS. Over time, as is often the way with legacy systems, our operational experience with Cassandra began to wane. Routine maintenance became less and less routine. After a particularly-rough experience with an upgrade in one of our test environments, it became clear that we were going to have a problem on our hands if we didn’t make some changes.
The general shape of Cassandra — a horizontally-scalable key/value database — remained a great fit for our needs. But we wanted to move to a managed service, operated and maintained by a team of experts in the same way our Kafka clusters are. After considering a number of options, we landed on AWS’s DynamoDB. Like Cassandra, DynamoDB traces its heritage (and its name) back to the system described in the seminal Amazon Dynamo paper. Other Heroku teams were already using DynamoDB for other use cases, and it had a solid track record for reliability, scalability, and performance.
A Careful Migration
Once the plan was made and the code was written, all that remained was the minor task of swapping out the backend storage of a high-scale, high-throughput distributed system without anyone noticing (just kidding, this was obviously going to be the hard part of the job ).
Thankfully, the architecture of MetaaS gave us a significant leg up here. We already had a set of stream-processing jobs for writing time-series data from Kafka to Cassandra. The first step of the migration was to stand up a parallel set of stream-processing jobs to write that same data to DynamoDB as well. This change had no observable impact on the rest of the system, and it allowed us to build confidence that DynamoDB was working and scaling as we expected.
As we began to accumulate data in DynamoDB, we moved on to the next phase of the migration: science! We’re big fans of the open source scientist library from our friends over at GitHub, and we adapted a very similar approach for this migration. We began running a small percent of read queries to MetaaS in “Science Mode”: continuing to read from Cassandra as usual, but also querying DynamoDB in the background and logging any queries that produced different results. We incrementally dialed the experiment up until 100% of production queries were being run through both codepaths. This change also had no observable impact, as MetaaS was still returning the data from Cassandra, but it allowed us to find and fix a couple of tricky edge cases that hadn't come up in our more-traditional pre-production testing.
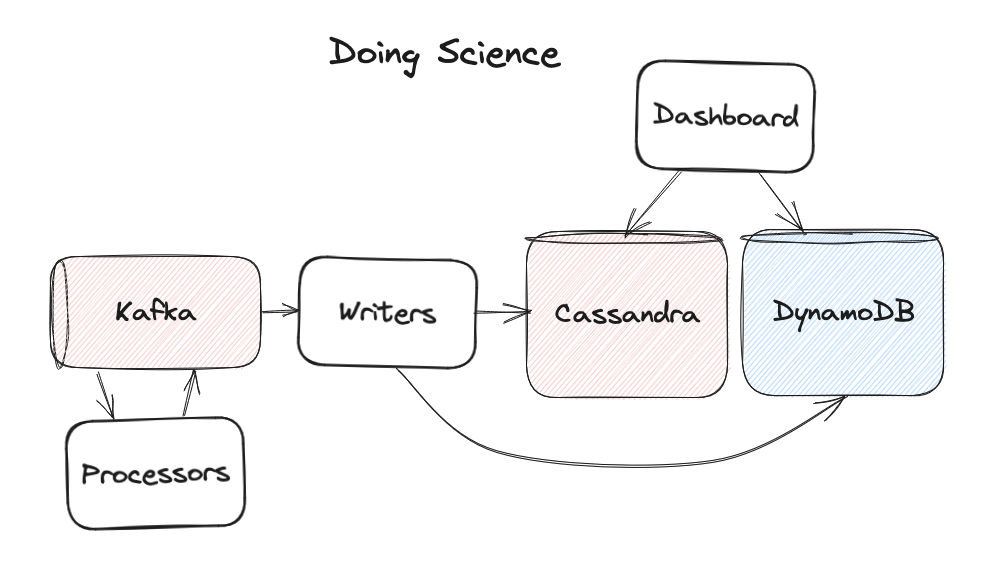
A Smooth Landing
Once our science experiment showed that DynamoDB was consistently returning the same results as Cassandra, the migration was now simply a matter of time. MetaaS stores data for a particular retention period, after which it ages out and is deleted (using the convenient TTL support that both Cassandra and DynamoDB implement). This meant that we didn’t need to orchestrate a lift-and-shift of data from Cassandra to DynamoDB. Once we were confident that the same data was being written to both places, we could simply wait for any older data in Cassandra to age out.
Starting with our test environments, we began to incrementally cut a small percent of queries over to only read from DynamoDB, moving carefully in case there were any reports of weird behavior that had somehow been missed by our science experiment. There were none, and 100% of queries to MetaaS have been served from DynamoDB since May of last year. We waited a few weeks just to be sure that we wouldn’t need to roll back, thanked our Cassandra clusters for their years of service, and put them to rest.

Conclusion
With a year of experience under our belt now, we’re feeling confident we made the right choice. DynamoDB has been boring, exactly as we hoped it would be. It’s been reliable at scale. We’ve spent a grand total of zero time thinking about how to patch the version of log4j it uses. And, for bonus points, it’s been both faster and cheaper than our self-hosted Cassandra clusters were. See if you can guess what time of day we finished the migration based on this graph of 99th-percentile query latency:
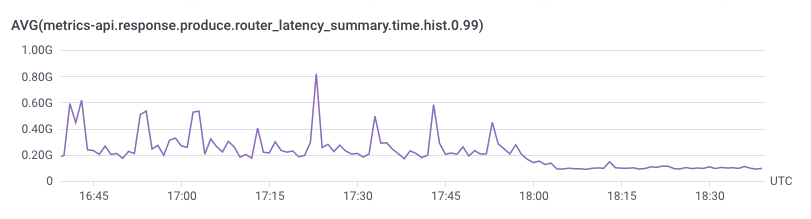
Our favorite part of this story? Unless you were closely watching page load times for the Heroku Dashboard’s Metrics tab at the time, you didn’t notice a thing. For a lot of the work we do here at Heroku, that’s the ultimate sign of success: no one even noticed. Things just got a little bit newer, faster, or more reliable under the covers.
For the moment, MetaaS is back to being a legacy system, doing its job with a minimum of fuss. If you’re interested in the next evolution of telemetry and observability for Heroku, check out the OpenTelemetry item on our public roadmap. It’s an area we’re actively working on, and we would love your input!
This post is a collaborative effort between Heroku and AWS, and it is published on both the Heroku Blog and the AWS Database Blog.
The post Evolving the Backend Storage for Platform Metrics appeared first on Heroku.
]]>We’re excited to announce public beta support for HTTP/2 on both Heroku Common Runtime and Private Spaces . HTTP/2 support is one of the most requested and desired improvements for the Heroku platform . HTTP/2 is significantly faster than HTTP 1.1 by introducing features like multiplexing and header compression to reduce latency and therefore improve the end-user experience of Heroku apps.
Since 2023, we’ve been working on a large platform modernization of our Common Runtime router. This project will allow us to start delivering more modern networking for Heroku. With the majority…
The post Improved Heroku App Performance with HTTP/2 appeared first on Heroku.
]]>
Introduction:
We’re excited to announce public beta support for HTTP/2 on both Heroku Common Runtime and Private Spaces. HTTP/2 support is one of the most requested and desired improvements for the Heroku platform. HTTP/2 is significantly faster than HTTP 1.1 by introducing features like multiplexing and header compression to reduce latency and therefore improve the end-user experience of Heroku apps.
Since 2023, we’ve been working on a large platform modernization of our Common Runtime router. This project will allow us to start delivering more modern networking for Heroku. With the majority of that work now complete, we’re excited to focus more on the future and new features.
What Do You Get From HTTP/2?
Upgrading to HTTP/2, the next-generation HTTP protocol, significantly improves web app performance for our customers. Here's how:
-
Faster loading times: HTTP/2 uses header compression and multiplexing to deliver content quicker and more efficiently. This improvement translates to faster page loads, especially for content-heavy applications with many images or videos.
-
Enhanced responsiveness: HTTP/2 lets multiple requests travel simultaneously on a single connection, and stream prioritization ensures smoother communication and faster updates. HTTP/2 reduces latency and improves performance for real-time applications like chat or live collaborative tools.
-
Improved user experience: Streamlined data transfer and reduced waiting times lead to a more enjoyable user experience. Users experience smoother scrolling, faster interactions with forms, and an overall improved sense of responsiveness across Heroku applications.
HTTP/2 terminates at the Heroku router and we forward HTTP/1.1 from the router to your app. This method is great because you get most of the benefits of HTTP/2 without having to make any changes to your app or code.

Along with this beta, we’ll continue to research solutions to provide HTTP/2 end-to-end (all the way to the dyno) and enable features like Server Push and gRPC use cases with Heroku apps. Those capabilities aren’t included in this release.

For more information about HTTP/2, you can refer to the official HTTP/2 RFC (RFC 9113).
How to Turn On HTTP/2 For Your Application
A valid TLS certificate is required for HTTP/2. We recommend using Heroku Automated Certificate Management.
Common Runtime Applications
For Common Runtime apps, if you’re in the Routing 2.0 Public Beta, HTTP/2 is on by default. If you’re not in the beta, you can enable it with this command:
$ heroku labs:enable http-routing-2-dot-0 -a <app name>
After enabling the new router for your app, it can handle HTTP/2 traffic. In the Common Runtime, we support HTTP/2 on custom domains, but not on the built-in <app-name-cff7f1443a49>.herokuapp.com domain.
To opt out of HTTP/2, simply disable the new router on your application.
Private Spaces and Shield Spaces Applications
Private and Shield Spaces Applications
For Private and Shield Spaces apps, you can enable HTTP/2 for an app with a Heroku Labs flag:
$ heroku labs:enable spaces-http2 -a <app name>
In Private Spaces, we support HTTP/2 on both custom domains and the built-in default app domain.
To disable HTTP/2, simply disable the Heroku labs spaces-http2 flag on your app.
Conclusion
We’re excited to finally bring HTTP/2 to the Heroku platform to see how it improves our customers' apps and their users’ experience.
HTTP/2 is currently in public beta. When our new router becomes the default on Common Runtime, the feature will become generally available for all Heroku customers.
We want to express our sincere appreciation for the feedback received on the Heroku Public roadmap request that led to this change. Your insights were instrumental in shaping this first release of features on our next-generation router. We'll continue monitoring the public roadmap and your feedback as we explore future networking and routing enhancements, especially our continued research on expanding HTTP/2 functionality to dynos and exploring HTTP/3.
The post Improved Heroku App Performance with HTTP/2 appeared first on Heroku.
]]> Get started working with Fastify to build an API
Implement API authentication by using a JSON web token (JWT)
Use Fastify’s Swagger plugins to generate an OpenAPI specification
Consume the OpenAPI specification with Postman, giving you an API client that can send requests seamlessly to your…
The post Build Well-Documented and Authenticated APIs in Node.js with Fastify appeared first on Heroku.
]]>- Get started working with Fastify to build an API
- Implement API authentication by using a JSON web token (JWT)
- Use Fastify’s Swagger plugins to generate an OpenAPI specification
- Consume the OpenAPI specification with Postman, giving you an API client that can send requests seamlessly to your back-end API
- Deploy your application to Heroku
This project is part of our Heroku Reference Applications GitHub organization where we host different projects showcasing architectures and patterns to deploy to Heroku.
Key Concepts
Before we code, let’s briefly cover the core concepts and technologies for this walkthrough.
Application Flow
A Heroku Postgres database stores records of usernames, first names, last names, and emails in a users table. The public endpoint of our API (/directory) returns a list of usernames for all users in the table. The protected endpoint (/profile) requires a JWT with username in the payload. This endpoint returns additional information about the user with the given username.

What’s Fastify?
Fastify is a web framework for Node.js that boasts speed, low overhead, and a delightful developer experience. Many Node.js developers have adopted Fastify as an alternative to Express.
Fastify is designed with a plugin architecture, making it incredibly modular. Its documentation says that “in Fastify everything is a plugin.” This architecture makes it easy for developers to build and use utilities, middleware, and other niceties. We dive deeper into working with plugins as we get to coding.
Authentication
Our authenticated route requires a JWT signed with an RSA256 private key. We attach that JWT, and the API uses the symmetric public key to validate it.
The username in the payload of the validated JWT is meant to represent the user making the request, so the /profile endpoint returns account information about that user.
API Documentation
We also document our API routes as we write our code. Fastify has OpenAPI support through its plugin ecosystem that generates the full OpenAPI specification and gives us a UI. With the OpenAPI specification generated, we can also use Postman to import the spec to give us a client that can send requests to our API.
Deployment
After doing a little bit of local testing, we can deploy our API to Heroku with just a few quick CLI commands, or the Deploy to Heroku button in the GitHub repository
Get Started
To use this demo, you need:
- A Heroku account. You must add a payment method to cover your compute and database costs. To run this API, go with the Eco dyno, which has a $5 monthly flat fee. You also need a Heroku Postgres instance. Go with the Mini plan, at a max of $5 monthly cost. The Eco and Mini plans are enough for this sample application.
- A GitHub account for your code repository. Heroku hooks into your GitHub repo directly, simplifying deployment to a single click.
- (Optional) The Postman client application installed on your local machine. You need Postman to follow along in our section on importing an OpenAPI specification.
You can start by cloning the GitHub repo for this project. If you simply want to deploy and start using the API, follow the instructions in the README.
To keep this walkthrough simple, we’re going to highlight the most important parts of the code to help you understand how we built this API. We don’t go through everything line by line, but you can always reference the repo codebase to examine the code itself.
Initialize the Project
When building this project, we used Node v20.11.1 along with npm as our package manager. Start by initializing a new project and installing dependencies:
npm init -y

npm install fastify fastify-cli fastify-plugin @fastify/auth @fastify/autoload @fastify/jwt @fastify/swagger @fastify/swagger-ui fast-jwt dotenv pg
Create the Initial app.js File
Just to start things out, we begin with an app.js file in our project root folder. This file is our “hello world” initial application:
app.js
export default async (fastify, opts) => {
  fastify.get(
    "/",
    async function (_request, reply) {
      reply.code(200).type("text/plan").send("hello world");
    },
  );
}
We use the fastify-cli to run the app.js file. Notice that we don’t need to import Fastify in our file, since we pass an instance of a Fastify server object, fastify, to the function as an argument. To start, we add handling for a GET request to /. As we build up our API, we can simply enhance this instance by registering new plugins.
Let’s add some lines to our package.json file to use that app.js file.
package.json
{
  "name": "openapi-fastify-jwt",
  "version": "1.0.0",
  "type": "module",
  "description": "A sample Fastify API with RSA256 JWT authentication",
  "main": "app.js",
  "scripts": {
    "start": "fastify start -a 0.0.0.0 -l info app.js",
    "dev": "fastify start -w -l info -P app.js"
  },
The fastify-cli command in our scripts section starts up our server to listen for requests. We start our local server like this:
npm run dev
[10:22:17.323] INFO (816073): Server listening at https://127.0.0.1:3000
In a separate terminal window, we test our server:
curl localhost:3000
hello world
Create the Database Plugin
Next, we write a plugin for querying our Postgres database, and add it to our fastify instance.
In a subfolder called plugins, we create a file called db.js with the following contents:
plugins/db.js
import fp from "fastify-plugin";
import pg from "pg";

const { Pool } = pg;

export default fp(async (fastify) => {
  const pool = new Pool({
    connectionString: process.env.DATABASE_URL,
    ssl: {
      rejectUnauthorized: false,
    },
  });

  fastify.decorate("db", {
    query: async (text, params) => {
      const result = await pool.query(text, params);
      return result.rows;
    },
  });
})
The standard convention for creating Fastify plugins uses the fastify-plugin package,imported above as a function called fp. We define how to enhance our fastify instance, then call fp() on that functionality and export it.
Note: The Fastify ecosystem has its own @fastify/postgresql plugin which is the recommendation for production-based applications. We decided to build our own plugin to demonstrate how to extend Fastify with a simple plugin.
Our database plugin opens a connection to a Postgres database based on the DATABASE_URL environment variable. We have a method called query which sends the SQL query along with any parameters, returning the result.
Notice that we decorate our fastify instance with the string db, supplying the definition for our query function. By doing this, we can call fastify.db.query for any fastify instance that registered this plugin.
Back in app.js, let’s register our newly created plugin. We could call fastify.register individually on each plugin we want to register, as Fastify’s getting started guide describes. However, we use @fastify/autoload to quickly register all plugins in a given folder. Our app.js file now looks like this, after removing the GET handler for /:
app.js
import path from "path";
import AutoLoad from "@fastify/autoload";
import { fileURLToPath } from "url";

const __filename = fileURLToPath(import.meta.url);
const __dirname = path.dirname(__filename);

export default async (fastify, opts) => {
  fastify.register(AutoLoad, {
    dir: path.join(__dirname, "plugins"),
    options: Object.assign({}),
  });
};
By using autoload, we register any plugins found in our plugins subfolder.
Create the /directory Route
Next, we add our /directory route. This public route returns all the usernames in our database’s users table. The handler uses our db plugin’s query method.
In a subfolder called routes, we create a file called directory.js with the following contents:
routes/directory.js
export default async function (fastify, _opts) {
  fastify.get(
    "/directory",
     async (_request, reply) => {
      const { db } = fastify;
      const rows = await db.query(
        "SELECT username FROM users ORDER by username",
      );
      const records = rows.map((r) => { username: r.username });
      reply.code(200).type("application/json").send(records);
    },
  );
}
Notice how we use the db object from our fastify instance. This code assumes that our fastify instance registered a plugin that decorates the instance with db, giving us convenient access to db.query. We handle GET requests to /directory by making the appropriate query and returning the results.
Back in app.js, we have to make sure to add this route to our fastify instance by calling fastify.register. Just like we did for our plugins subfolder, we autoload any files in our routes subfolder. Let’s also add in a call to dotenv, since we need our DATABASE_URL environment variable soon.
app.js
import "dotenv/config";
import path from "path";
import AutoLoad from "@fastify/autoload";
import { fileURLToPath } from "url";

const __filename = fileURLToPath(import.meta.url);
const __dirname = path.dirname(__filename);

export default async (fastify, opts) => {
  fastify.register(AutoLoad, {
    dir: path.join(__dirname, "plugins"),
    options: Object.assign({}),
  });

  fastify.register(AutoLoad, {
    dir: path.join(__dirname, "routes"),
    options: Object.assign({}),
  });
};
Set Up a Local Postgres Database
For local testing, we set up a local Postgres database. Then, we add the database’s connection string to a file called .env in the project root folder. For example:
.env
DATABASE_URL=postgres://user:password@localhost:5432/my_database
You can use files from the repository codebase (in the data subfolder) to create the database schema and seed the table with records.
psql
        postgres://user:password@localhost:5432/my_database
        < create_schema.sql

psql
        postgres://user:password@localhost:5432/my_database
        < create_records.sql
With the database plugin, public /directory route, and local database all in place, we test our server again. We start our server with npm run dev. Then, in a separate terminal window:
curl localhost:3000/directory
[{"username":"adelia.casper"},{"username":"aisha.upton"},{"username":"alfred.lindgren"},{"username":"alysha.mclaughlin"},{"username":"angie.keebler"},{"username":"antonia.gutmann"},{"username":"baron.hessel"},{"username":"bernadine.powlowski"},{"username":"carlee.abbott"},{"username":"charley.glover"},{"username":"cora.bednar"},{"username":"darryl.reynolds"},{"username":"dee.gorczany"},{"username":"dennis.koss"},{"username":"deshaun.wiza"},{"username":"devante.lakin"},{"username":"edythe.thompson"},{"username":"eldon.bahringer"},{"username":"elenor.trantow"},{"username":"elijah.hane"},{"username":"erin.haley"},{"username":"estefania.will"},{"username":"haven.rippin"},{"username":"houston.rowe"},{"username":"imani.okon"},{"username":"irma.durgan"},{"username":"jaiden.vandervort"},{"username":"jamar.maggio"},{"username":"jamir.walsh"},{"username":"jedediah.mraz"},{"username":"jett.beier"},{"username":"johnathon.hessel"},{"username":"jovan.turner"},{"username":"kade.hilpert"},{"username":"king.berge"},{"username":"laurie.marquardt"},{"username":"madge.hettinger"},{"username":"magali.terry"},{"username":"magdalena.farrell"},{"username":"marty.wunsch"},{"username":"mellie.donnelly"},{"username":"muriel.walker"},{"username":"noelia.jenkins"},{"username":"nolan.dubuque"},{"username":"otis.grady"},{"username":"rene.bins"},{"username":"rhoda.bashirian"},{"username":"rose.boehm"},{"username":"tatyana.wolf"},{"username":"zion.reichel"}]%
Excellent. Our public route and our database plugin look like they’re working. Now, it’s time to move onto authentication.
Create the Authentication Plugin
In our plugins subfolder, we create a new plugin in auth.js. It looks like this:
plugins/auth.js
import fp from "fastify-plugin";
import jwt from "@fastify/jwt";
import auth from "@fastify/auth";

export default fp(async (fastify) => {
  if (!process.env.RSA_PUBLIC_KEY_BASE_64) {
    throw new Error(
      "Environment variable `RSA_PUBLIC_KEY_BASE_64` is required",
    );
  }

  const publicKey = Buffer.from(
    process.env.RSA_PUBLIC_KEY_BASE_64,
    "base64",
  ).toString("ascii");
  if (!publicKey) {
    fastify.logger.error(
      "Public key not found. Make sure env var `RSA_PUBLIC_KEY_BASE_64` is set.",
    );
  }

  fastify.register(jwt, {
    secret: {
      public: publicKey,
    },
  });

  fastify.register(auth);

  fastify.decorate("verifyJWT", async (request, reply) => {
    try {
      await request.jwtVerify();
    } catch (err) {
      reply.send(err);
    }
  });
});
Our authentication process checks that the supplied JWT is properly signed. We verify the signature with the signer’s public key. Let’s walk through what we’re doing here step by step:
- Read in the
publicKeyfrom ourRSA_PUBLIC_KEY_BASE_64environment variable. The key must be in base64 format. - Register the
@fastify/jwtplugin, supplying thepublicKeybecause we use the plugin in verify-only mode. - Register the @fastify/auth plugin, which adds convenience utilities for attaching authentication to routes.
- Decorate our
fastifyinstance with a function calledverifyJWT. Our function calls thejwtVerifyfunction in the@fastify/jwtplugin, passing it the API request. That function checks theAuthorizationheader for a bearer token and verifies the JWT against ourpublicKey.
Because our app.js file already autoloads any plugins in our plugins subfolder, we don’t need to do anything else to register our new authentication plugin.
Create the Authenticated /profile Route
In our routes subfolder, we create a file called profile.js with the following contents:
routes/profiles.js
export default async function (fastify, _opts) {
  fastify.get(
    "/profile",
    {
      onRequest: [fastify.auth([fastify.verifyJWT])],
    },
    async (request, reply) => {
      const { db } = fastify;
      const sql =
        'SELECT id, username, first_name as "firstName", last_name as "lastName", email FROM users WHERE username=$1';

      const rows = await db.query(sql, [request.user.username]);
      if (rows.length) {
        reply.code(200).type("application/json").send(rows[0]);
      } else {
        reply.code(404).type("text/plain").send("Not Found");
      }
    },
  );
}
How we implement this route differs slightly from that of /directory. When calling fastify.get, we include an object with route options as the second argument, before our handler function definition. We include the onRequest option, which acts like middleware handling. When a request to /profile comes in, Fastify calls fastify.auth for authentication, passing it our decorated fastify.verifyJWT function as our authentication strategy.
For our route handler, notice that our SQL query references request.user.username. You might wonder where that came from. Do you remember how we expect the JWT payload to include a username? When the @fastify/jwt plugin verifies the JWT, it writes the JWT payload to a user object in the request, passing that payload information downstream. That gives us access to request.user.username in our route handler. We call our database plugin to query for the user’s information, and we send the response.
And, because app.js autoloads the routes subfolder, our server is immediately serving up this route.
Generating Keys and Tokens
When we deploy our API, we use a new pair of public/private RSA keys. You can generate a pair online here. You need the public key, in base64 format, as an environment variable for JWT verification. You only use the private key when signing a JWT for accessing the API’s authenticated route.
Our codebase provides a utility for generating a JWT and signing it with a private key. Here’s an example of how to use it:
npm run generate:jwt
           utils/keys/private_key.example.rsa
           '{"username":"aisha.upton"}'

Token: eyJhbGciOiJSUzI1NiIsInR5cCI6IkpXVCJ9.eyJ1c2VybmFtZSI6ImFpc2hhLnVwdG9uIiwiaWF0IjoxNzE0NDEzNzk3fQ.U0Nkb5IIDKjGv2VHFZQZE8nMpDbj25ui1b868lAnLU5T_rUcsYq-oq792gFlHcMdYmYZ92eHfqEVKjqEcKbeVRCrWSUi3pm0BN74cXZ8Q0DWc1EdxxsgtxdPZ9jtckUkeCG9BNsMBbCAQfSb_cURq4hbX9js28DYP3sVuc5soKE
With a valid token, we can test our server’s authenticated route:
# Valid token
curl
   --header "Authorization:Bearer eyJhbGciOiJSUzI1NiIsInR5cCI6IkpXVCJ9.eyJ1c2VybmFtZSI6ImFpc2hhLnVwdG9uIiwiaWF0IjoxNzE0NDEzNzk3fQ.U0Nkb5IIDKjGv2VHFZQZE8nMpDbj25ui1b868lAnLU5T_rUcsYq-oq792gFlHcMdYmYZ92eHfqEVKjqEcKbeVRCrWSUi3pm0BN74cXZ8Q0DWc1EdxxsgtxdPZ9jtckUkeCG9BNsMBbCAQfSb_cURq4hbX9js28DYP3sVuc5soKE"
   localhost:3000/profile
{"id":"402b11d2-20a0-4104-9800-9b5b9dee4dc1","username":"aisha.upton","firstName":"Aisha","lastName":"Upton","email":"aisha.upton@example.com"}%
Our authentication works!
Here are some examples of how the @fastify/auth and @fastify/jwt plugins handle bad requests, just to show how it looks:
# No token
curl localhost:3000/profile
{"statusCode":401,"code":"FST_JWT_NO_AUTHORIZATION_IN_HEADER","error":"Unauthorized","message":"No Authorization was found in request.headers"}

# Invalid token
curl --header "Authorization:Bearer this-is-not-a-valid-token" localhost:3000/profile

{"statusCode":401,"code":"FST_JWT_AUTHORIZATION_TOKEN_INVALID","error":"Unauthorized","message":"Authorization token is invalid: The token is malformed."}

# Token signed by a different key
curl
   --header "Authorization:Bearer eyJhbGciOiJSUzI1NiIsInR5cCI6IkpXVCJ9.eyJ1c2VybmFtZSI6IkNydXoxOSIsImlhdCI6MTcwOTMyMTc4Mn0.YWklNLXmojxc7Kg0M0utMHQGylsUK3LrHozvcVPYHCvZIG-nwJKKSW9FKzQ9I0glxZdWvjELGwoP7uWVGHyyEo7c3HTk1pxG-av7T9CmWf_Gk0D58n1T1PkeO7YqE-2JL6vIlvnAiUQRrrknYlEAc8Z3UruYik_CFqoRxbLkZl8"
   localhost:3000/profile

{"statusCode":401,"code":"FST_JWT_AUTHORIZATION_TOKEN_INVALID","error":"Unauthorized","message":"Authorization token is invalid: The token signature is invalid."}
Use OpenAPI and Swagger UI for Documentation
With Fastify, we can take advantage of the @fastify/swagger and @fastify/swagger-ui plugins to conveniently generate an OpenAPI specification for our API.
First, we define our data model schemas (in schemas/index.js) using the Validation and Serialization feature from Fastify.
Next, in app.js, we register the @fastify/swagger plugin and supply it with general information about our server. We also register the @fastify/swagger-ui, providing a path (/api-docs). This plugin creates an entire Swagger UI with our OpenAPI specification at that path. Our final app.js file looks like this:
app.js
import "dotenv/config";
import path from "path";
import AutoLoad from "@fastify/autoload";
import Swagger from "@fastify/swagger";
import SwaggerUI from "@fastify/swagger-ui";
import { fileURLToPath } from "url";

const __filename = fileURLToPath(import.meta.url);
const __dirname = path.dirname(__filename);

export const options = {};

export default async (fastify, opts) => {
  fastify.register(Swagger, {
    openapi: {
      info: {
        title: "User Directory and Profile",
        description:
          "Demonstrates Fastify with authenticated route using RSA256",
        version: "1.0.0",
      },
      components: {
        securitySchemes: {
          BearerAuth: {
            description:
              "RSA256 JWT signed by private key, with username in payload",
            type: "http",
            scheme: "bearer",
            bearerFormat: "JWT",
          },
        },
      },
      fastifys: [
        {
          url: "https://localhost:8080",
        },
      ],
      tags: [
        {
          name: "user",
          description: "User-related endpoints",
        },
      ],
    },
    refResolver: {
      buildLocalReference: (json, _baseUri, _fragment, _i) => {
        return json.$id || `def-{i}`;
      },
    },
  });

  fastify.register(SwaggerUI, {
    routePrefix: "/api-docs",
  });

  fastify.register(AutoLoad, {
    dir: path.join(__dirname, "plugins"),
    options: Object.assign({}),
  });

  fastify.register(AutoLoad, {
    dir: path.join(__dirname, "routes"),
    options: Object.assign({}),
  });
};
We also want to add OpenAPI specification info for each of our routes. As an example, here is how we do it in routes/profile.js:
routes/profile.js
import {
  profileSchema,
  errorSchema,
} from "../schemas/index.js";

export default async function (fastify, _opts) {
  fastify.addSchema({
    $id: "profile",
    ...profileSchema,
  });

  fastify.addSchema({
    $id: "error",
    ...errorSchema,
  });

  fastify.get(
    "/profile",
    {
      schema: {
        description:
          "Get user's own profile with additional account attributes",
        tags: ["user"],
        security: [
          {
            BearerAuth: [],
          },
        ],
        response: {
          200: {
            description: "User profile",
            $ref: "profile#",
          },
          404: {
            description: "Not Found",
            $ref: "error#",
          },
          500: {
            description: "Internal Server Error",
            $ref: "error#",
          },
        },
      },
      onRequest: [fastify.auth([fastify.verifyJWT])],
    },
    async (request, reply) => {
      …
    },
  );
}
In this file, we add a schema object to our route options argument. In line with how OpenAPI specifications are written, we add information regarding security, responses, and so on. We do something similar in routes/directory.js.
Now, when we spin up our server, we can visit https://localhost:3000/api-docs to see this:

From right within the Swagger UI, we can send requests to our API. For example, we can use the JWT we generated earlier and send an authenticated request to /profile.
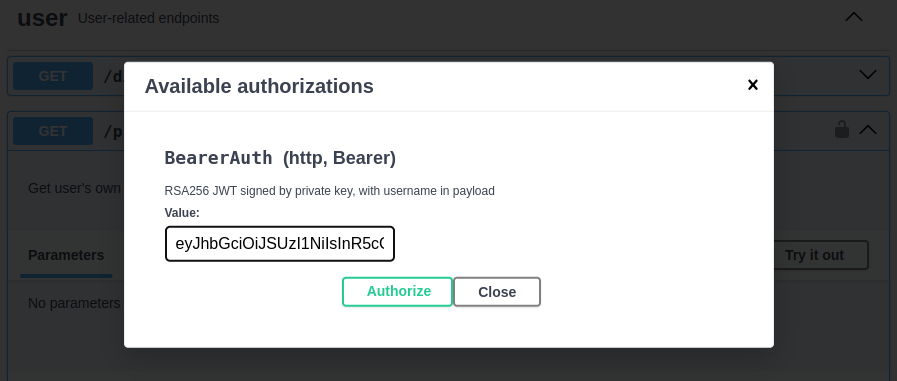

Import OpenAPI Specification into Postman
The Swagger UI is nice, but we can also use Postman for better programmatic usage and developer experience when it comes to authentication.
In Postman, we click the Import button.

We can import our OpenAPI specification using a URL. Our Swagger UI shows that the specification is available at https://localhost:3000/api-docs/json. We provide this URL to Postman, choosing to import the API as a Postman Collection.

Now, we have a new collection in Postman with requests set up to hit our API:

When we click on the profile’s GET request, and then click on the Authorization tab, we see that Postman expects two variables: baseUrl and bearerToken.

Let’s set the values for those. Go to the options for our Postman Collection, navigating to the Variables tab. There, we set baseUrl to https://localhost:3000. Then, we add a new variable called bearerToken, and we use the value of the valid JWT generated earlier.

Click Save in the upper-right corner. Then, we go back to our /profile request and click Send.

Going from our OpenAPI specification to Postman is so quick and easy!
Deploy the API to Heroku
As an API developer, you want to spend your development time focused on building and coding. Ideally, deploying your APIs is fast and painless. With Heroku, it is!
Assuming you installed the Heroku CLI, here’s how to deploy your API.
Step 1: Log in
heroku login
Step 2: Create a new app
heroku create my-fastify-api
Creating ⬢ my-fastify-api... done
https://my-fastify-api-58737de5faf0.herokuapp.com/ | https://git.heroku.com/my-fastify-api.git
Step 3: Add the Heroku Postgres add-on
heroku addons:create heroku-postgresql
Creating heroku-postgresql on ⬢ my-fastify-api... ~$0.007/hour (max $5/month)
Database has been created and is available
Step 4: Load the database schema and seed data
heroku pg:psql < data/create_schema.sql
CREATE TABLE

heroku pg:psql < data/create_records.sql
INSERT 0 50
Step 5: Add your RSA public key as a config variable
heroku config:set \
 RSA_PUBLIC_KEY_BASE_64=`cat utils/keys/public_key.example.rsa | base64`
Setting RSA_PUBLIC_KEY_BASE_64 and restarting ⬢ my-fastify-api... done
Step 6: Create a Git remote to point to Heroku
heroku git:remote -a my-fastify-api
set git remote heroku to https://git.heroku.com/my-fastify-api.git
Step 7: Push your repository branch to Heroku
git push heroku main
…
remote: -----> Creating runtime environment
…
remote: -----> Installing dependencies
…
remote: -----> Build succeeded!
…
remote: -----> Launching...
remote:        Released v6
remote:        https://my-fastify-api-58737de5faf0.herokuapp.com/ deployed to Heroku
…
That’s it! Just a few commands in the Heroku CLI, and our API is deployed, configured, and running. Let’s do some checks to make sure.
At the command line, with curl:
curl https://my-fastify-api-58737de5faf0.herokuapp.com/directory
[{"username":"adelia.casper"},{"username":"aisha.upton"},{"username":"alfred.lindgren"},{"username":"alysha.mclaughlin"},{"username":"angie.keebler"},{"username":"antonia.gutmann"},{"username":"baron.hessel"},{"username":"bernadine.powlowski"},{"username":"carlee.abbott"},{"username":"charley.glover"},{"username":"cora.bednar"},{"username":"darryl.reynolds"},{"username":"dee.gorczany"},{"username":"dennis.koss"},{"username":"deshaun.wiza"},{"username":"devante.lakin"},{"username":"edythe.thompson"},{"username":"eldon.bahringer"},{"username":"elenor.trantow"},{"username":"elijah.hane"},{"username":"erin.haley"},{"username":"estefania.will"},{"username":"haven.rippin"},{"username":"houston.rowe"},{"username":"imani.okon"},{"username":"irma.durgan"},{"username":"jaiden.vandervort"},{"username":"jamar.maggio"},{"username":"jamir.walsh"},{"username":"jedediah.mraz"},{"username":"jett.beier"},{"username":"johnathon.hessel"},{"username":"jovan.turner"},{"username":"kade.hilpert"},{"username":"king.berge"},{"username":"laurie.marquardt"},{"username":"madge.hettinger"},{"username":"magali.terry"},{"username":"magdalena.farrell"},{"username":"marty.wunsch"},{"username":"mellie.donnelly"},{"username":"muriel.walker"},{"username":"noelia.jenkins"},{"username":"nolan.dubuque"},{"username":"otis.grady"},{"username":"rene.bins"},{"username":"rhoda.bashirian"},{"username":"rose.boehm"},{"username":"tatyana.wolf"},{"username":"zion.reichel"}]%
In Postman, with an updated baseUrl to point to our Heroku app URL (while keeping the valid bearerToken):

And finally, in our browser, checking out the API docs:

Conclusion
When building a Node.js API, using the Fastify framework helps you get up and running quickly. You have access to a rich ecosystem of existing plugins, and building your own plugins is simple and straightforward too. Here’s a quick rundown of everything we did in this walkthrough:
- Used Fastify to build an API server
- Built plugins for database querying and JWT authentication
- Built two routes (one public, one protected) for our API
- Integrated OpenAPI-related plugins to get an OpenAPI specification and a Swagger UI
- Showed how to import our OpenAPI specification into Postman
- Deployed our API to Heroku with just a few commands
With technologies like Fastify, JSON web tokens, and OpenAPI, you can quickly build APIs that are powerful, secure, and easy to consume. Then, when it’s time to deploy and run your code, going with Heroku gets you up and running — _within minutes — _at a low cost. When you’re ready to get started, sign up for a Heroku account and begin building today!
The post Build Well-Documented and Authenticated APIs in Node.js with Fastify appeared first on Heroku.
]]>In this post, we introduce a new community buildpack that helps with automated browser testing. The new buildpack resolves installation reliability problems in the existing Chrome browser buildpacks for Heroku apps.
Developers can manually run browser tests on their machines…
The post Improved Browser Testing on Heroku with Chrome appeared first on Heroku.
]]>In this post, we introduce a new community buildpack that helps with automated browser testing. The new buildpack resolves installation reliability problems in the existing Chrome browser buildpacks for Heroku apps.
Browser Testing on Heroku
Developers can manually run browser tests on their machines to support writing and debugging tests. They can automate browser tests with continuous integration tools like Heroku CI to run in response to code updates and catch new problems on feature branches before they’re merged and released. They can also automate browser tests with a continuous end-to-end testing service. For example, running the test suite every hour to catch new problems with a customer-facing app.
At Heroku, we use automated browser testing to ensure the reliability of the Heroku Dashboard, our primary web interface. Continuous testing of the dashboard and related interfaces throughout their lifecycle, from feature development to monitoring the production system, is essential for early bug detection, quality assurance, and adaptability.
Heroku engineers found one long-standing issue regularly disrupts browser testing. Occasionally, automated Chrome browser tests all fail due to a version mismatch of the installed Chrome and Chromedriver components, like this example error message:
This version of ChromeDriver only supports Chrome version N
Current browser version is M
While it seems like the answer is to set a specific version number, Chrome is an evergreen browser. The browser continuously refreshes itself with security updates and features. Setting a specific version is discouraged because the browser quickly falls out of date.
Introducing A New Community Buildpack
To solve this cycle of version mismatches as Chrome updates itself, we created the Chrome for Testing Heroku Buildpack. We were able to release this buildpack because the Chrome development team addressed the long-standing problem of keeping Chrome and Chromedriver versions updated and aligned with each other for automated testing environments.
To use this new Chrome for Testing buildpack in Heroku apps, head over to the Heroku Elements Marketplace and install the Chrome for Testing Heroku Buildpack.
If the app is already using Chrome, make sure to remove existing Chrome and Chromedriver buildpacks before installing the new buildpack. To install Chrome for Testing on an app, add heroku-community/chrome-for-testing as the first buildpack:
heroku buildpacks:add -i 1 heroku-community/chrome-for-testing
By default, this buildpack downloads the latest Stable release, which Google provides. You can control the channel of the release by setting the app’s GOOGLE_CHROME_CHANNEL config variable to Stable, Beta, Dev, or Canary, and then deploy and build the app.
After the app deploys with the Chrome for Testing buildpack, chrome and chromedriver executables are installed on the PATH in dynos, available for browser automation tools like Selenium WebDriver and Puppeteer. We welcome feedback about this buildpack on its GitHub repository. Happy testing!
The post Improved Browser Testing on Heroku with Chrome appeared first on Heroku.
]]>At Heroku, trust and security are top priorities and we’ve been steadily adding more security controls to the platform. Recently, we launched SSO for Heroku Teams, and today, we’re excited to announce more enhancements for teams: add-on controls . Previously, this feature was only available to Heroku Enterprise customers.
The Elements Marketplace has add-ons built by our partners that help teams accelerate app development on Heroku . Add-ons can interact with your team's data and apps, so it's important to manage and audit which add-ons your team uses. Enabling add-on controls helps…
The post Add-on Controls for Pay-As-You-Go Customers appeared first on Heroku.
]]>At Heroku, trust and security are top priorities and we’ve been steadily adding more security controls to the platform. Recently, we launched SSO for Heroku Teams, and today, we’re excited to announce more enhancements for teams: add-on controls. Previously, this feature was only available to Heroku Enterprise customers.
The Elements Marketplace has add-ons built by our partners that help teams accelerate app development on Heroku. Add-ons can interact with your team’s data and apps, so it’s important to manage and audit which add-ons your team uses. Enabling add-on controls helps keep your data and apps protected, so you can remain compliant with your company’s policies.
With today’s announcement, Heroku users with team admin permissions can now control which add-ons their team can use. Enabling this feature restricts non-admin members to only installing add-ons that are on the allowlist.
Setting Up the Allowlist
To begin using add-on controls, a team admin creates a trusted list of add-ons in the Add-on Controls section of the team’s **Settings** page.
To enforce the add-on controls, click Enable Add-ons Allowlisting Restrictions.

Enabling add-on controls doesn’t remove existing installed add-ons that aren’t on the allowlist.
Allowlist Exceptions
The Add-on Controls section has an **Allowlist Exceptions** list. This list shows the add-ons currently used in your team’s apps that aren’t allowlisted. Each entry in this list offers a detailed view option, showing you which app has the add-on installed and since when. These entries help you identify unapproved add-ons your team installed prior to enabling controls, or add-ons installed by an admin.

Conclusion
At Heroku, we take the security and availability of your apps seriously. Extending add-on controls to Heroku Teams for online customers is yet another step to improving security on Heroku.
If you have any thoughts or suggestions on future reliability improvements we can make, check out our public roadmap on GitHub and submit an issue!
The post Add-on Controls for Pay-As-You-Go Customers appeared first on Heroku.
]]>Late in 2023, OpenAI introduced GPTs , a way for developers to build customized versions of ChatGPT that can bundle in specialized knowledge, follow preset instructions, or perform actions like reaching out to external APIs. As more and more businesses and individuals use ChatGPT, developers are racing to build powerful GPTs to ride the wave of ChatGPT adoption.
If you’re thinking about diving into GPT development, we’ve got some good news: Building a powerful GPT mostly…
The post Building a GPT Backed by a Heroku-Deployed API appeared first on Heroku.
]]>Late in 2023, OpenAI introduced GPTs, a way for developers to build customized versions of ChatGPT that can bundle in specialized knowledge, follow preset instructions, or perform actions like reaching out to external APIs. As more and more businesses and individuals use ChatGPT, developers are racing to build powerful GPTs to ride the wave of ChatGPT adoption.

If you’re thinking about diving into GPT development, we’ve got some good news: Building a powerful GPT mostly involves building an API that handles a few endpoints. And in this post, we’ll show you how to do it.
In this walk-through, we’ll build a simple API server with Node.js. We’ll deploy our API to Heroku for simplicity and security. Then, we’ll show you how to create and configure a GPT that reaches out to your API. This project is part of our Heroku Reference Applications GitHub organization where we host different projects showcasing architectures and patterns to deploy to Heroku.
This is going to be a fun one. Let’s do it!
Our GPT: An Employee Directory
Imagine your organization uses ChatGPT internally for some of its operations. You want to provide your users (employees) with a convenient way to search through the employee database. These users aren’t tech-savvy. What’s an SQL query anyway?
With natural language, our users will ask our custom GPT a question about employees in the company. For example, they might ask: “Who do we have in the marketing department that was hired in 2021?”
The end user doesn’t know (or care) about databases, queries, or result rows. Our GPT will send a request to our API. Our API will find the requested information and return a natural language response, which our GPT sends back to the end user.
Here’s how it looks:
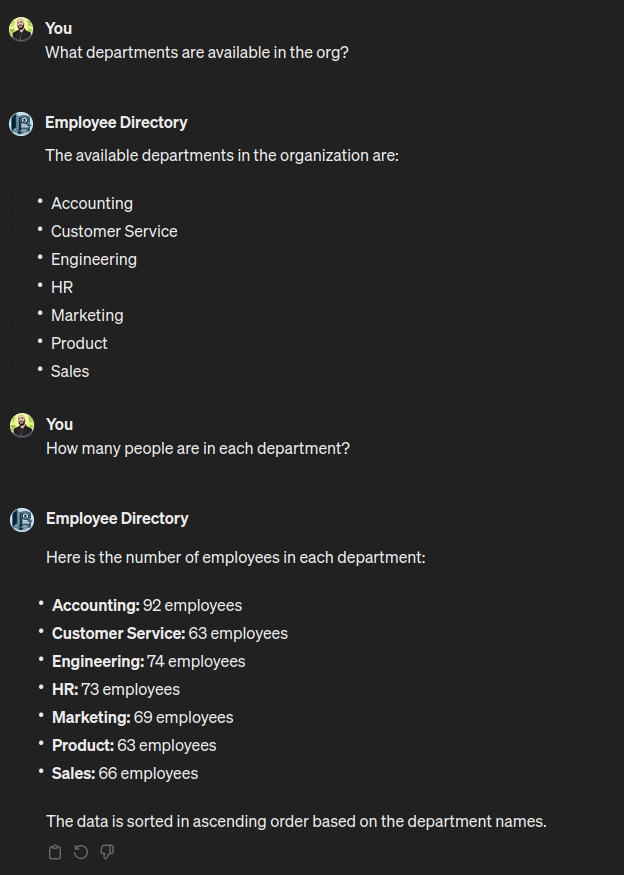
Pretty cool, right? The basic flow looks like this:
- In the ChatGPT interface, the user asks our GPT a question related to the employee directory.
- The GPT sends a POST request containing the user’s question to our API.
- Our API calls OpenAI’s Chat Completions API to help translate the user’s question into a well-formed SQL query.
- Our API uses the SQL query to fetch results from the employee database.
- Our API calls OpenAI’s Chat Completions API to process the query results into a natural language response.
- Our API passes this response back to the GPT.
- ChatGPT presents the response to the user.

Note: In the architecture above, all the data is leaving the Heroku trust boundary to access OpenAI services, take this into account when building data-sensitive applications.
Prerequisites and Initial Steps
Note: If you want to try the application first, deploy it using the “Deploy to Heroku” button in the reference application’s README file.
Before you can get started, you’ll need a few things in place:
- An OpenAI account. You’ll need to add a payment method and purchase a small amount of credit since you want access to its APIs.
- Once you have your OpenAI account set up, you’ll need to create a secret API key and copy it down. Your API application will need this key to authenticate its requests to the OpenAI API.
- A Heroku account. You’ll need to add a payment method to cover your compute and database costs. For building and testing this API, we recommend using an eco dyno, which has a $5 monthly flat fee. It’ll supply you with more than enough hours for initial development. You’ll also need Heroku Postgres. You can use the Mini plan, at $0.007/hour, which is enough for this application.
- A GitHub account for your code repository. Heroku will hook into your GitHub repo directly, simplifying deployment to a single click.
- Clone the GitHub repo with the code for the API application.
Note: Every request incurs costs and the price varies depending on the selected model. For example, using the GPT-3 model, in order to spend $1, you'd have to ask more than 20,000 questions. See the OpenAI API pricing page for more information.
The README in the repo has all the instructions you need to get the API server deployed to Heroku. If you just want to get your GPT up and running quickly, skip down to the Create and Configure GPT section Otherwise, you can follow along to walk through how to build this API.
We used Node v20.10.0 and yarn as our package manager. Install your dependencies.
yarn install
Build the API
One of the most powerful ways to use OpenAI’s custom GPTs is by building an API that your GPT reaches out to. Here’s how OpenAI’s blog post introducing GPTs describes it:
In addition to using our built-in capabilities, you can also define custom actions by making one or more APIs available to the GPT… Connect GPTs to databases, plug them into emails, or make them your shopping assistant. For example, you could integrate a travel listings database, connect a user’s email inbox, or facilitate e-commerce orders.
So, even though we’re building a GPT, under the hood we are simply building an API. For this, we use Express and listen for POST requests to the /search endpoint. We can build and test our API as a standalone unit before creating our GPT and custom action.
Let’s look at src/index.js for how our server will handle POST requests to /search. To keep our code snippet easily readable, we’ve left out the logging and error handling:
server.post('/', authMiddleware, async (req, res) => {
  …
  const userPrompt = req.body.message
  const sql = await AI.craftQuery(userPrompt)
  let rows = []
  …
  rows = await db.query(sql)
  …
  const results = await AI.processResult(userPrompt, sql, rows)
  res.send(results)
})
As you can see, the major steps we need to cover are:
- Ask OpenAI to craft an SQL query.
- Query the database.
- Ask OpenAI to turn the query results into a natural language response.
Using OpenAI’s Chat Completions API
Because our API will need to do some natural language processing, it will make some calls to OpenAI’s Chat Completions API. Not every API needs to do this. Imagine a simple API that just needs to return the current date and time. It doesn’t need to rely on OpenAI for its business logic.
But our GPT’s supporting API will need the Chat Completions API for basic text generation.
The first call to OpenAI: generate an SQL query
As per our flow (see the diagram above), we’ll need to ask OpenAI to convert the user’s original question into an SQL query. Let’s look at src/ai.js to see how we do this.
When sending a request to the Chat Completions API, we send an array of messages to help ChatGPT understand the context, including what’s being requested and how we want ChatGPT to behave in its response. Our first message is a system message, where we set the stage for ChatGPT.
const PROMPT = `
  I have a psql db with an "employees" table, created with the following statements:
  create type department_enum as enum('Accounting','Sales','Engineering','Marketing','Product','Custom
er Service','HR');
  create type title_enum as enum('Assistant', 'Manager', 'Junior Executive', 'President', 'Vice-President', 'Associate', 'Intern', 'Contractor');
  create table employees(id char(36) not null unique primary key, first_name varchar(64) not null, last_name varchar(64) not null, email text not null, department department_enum not null, title title_enum not null, hire_date date not null);
`.trim()
const SYSTEM_MESSAGE = { role: 'system', content: PROMPT }
Our craftQuery function looks like this:
const craftQuery = async (userPrompt) => {
  const settings = {
    messages: [SYSTEM_MESSAGE],
    model: CHATGPT_MODEL,
    temperature: TEMPERATURE,
    response_format: {
    type: 'json_object'
    }
  }
  settings.messages.push({
    role: 'system',
    content: 'Output JSON with the query under the "sql" key.'
  })
  settings.messages.push({
    role: 'user',
    content: userPrompt
  })
  settings.messages.push({
    role: 'user',
    content: 'Provide a single SQL query to obtain the desired result.'
  })
  logger.info('craftQuery sending request to openAI')
  const response = await openai.chat.completions.create(settings)
  const content = JSON.parse(response.choices[0].message.content)
  return content.sql
}
Let’s walk through what this code does in detail. First, we put together the set of messages that we’ll send to ChatGPT:
- The initial
systemmessage that lays out how we have structured our database, so that ChatGPT knows column names and constraints when crafting a query. - A
systemmessage that tells ChatGPT the format/structure we want for the response. In this case, we want the response as JSON (not natural language), with the SQL query under the key calledsql. - A
usermessage, which is the end user’s original request. - A follow-up
usermessage, where we specifically ask ChatGPT to generate a single SQL query for us, based on what we’re looking for.
We use the openai package (not shown) for Node.js. This is the official JavaScript library for OpenAI, serving as a convenient wrapper around the OpenAI API. With our settings place, we call the create function to generate a response. Then, we return the sql statement (in the JSON object) from OpenAI’s response.
Use SQL to query the database
Back in src/index.js, we use the SQL statement from OpenAI to query our database. We wrote a small module (src/db.js) to handle connecting with our PostgreSQL database and sending queries.
Our call to db.query(sql) returns the query result, an array called rows.
The second call to OpenAI: process the query results
Although our API could send back the raw database query results to the end user, it would be a better user experience if we turned those results into a human-readable response. Our user doesn’t need to know that there was a database involved. A natural language response would be ideal.
So, we’ll send another request to the Chat Completions API. In src/ai.js, we have a function called processResult:
const processResult = async (userPrompt, sql, rows) => {
  const settings = {
    messages: [SYSTEM_MESSAGE],
    model: CHATGPT_MODEL,
    temperature: TEMPERATURE
  }
  const userMessage = `
    This is how I described I was looking for: ${userPrompt}
    This is the query sent to find the results: ${sql}
    Here is the resulting data that you found:
    ${JSON.stringify(rows)}
Assume I am not even aware that a database query was run. Do not include the SQL query in your response to me. If the original request does not explicitly specify a sort order, then sort the results in the most natural way. Return the resulting data to me in a human-readable way, not as an object or an array. Keep your response direct. Tell me what you found and how it is sorted.'
  `
  settings.messages.push({
    role: 'user',
    content: userMessage
  })
  logger.info('processResult sending request to openAI')
  const response = await openai.chat.completions.create(settings)
  return response.choices[0].message.content
}
Again, we start with an initial system message that gives ChatGPT information about our database. At this point, you might ask: Didn’t we already do that? Why do we need to tell ChatGPT about our database structure again? The answer is in the Chat Completions API documentation:
Including conversation history is important when user instructions refer to prior messages…. Because the models have no memory of past requests, all relevant information must be supplied as part of the conversation history in each request.
Along with the database structure, we want to provide ChatGPT with some more context. In userMessage, we include:
- The user’s original question (
userPrompt), so ChatGPT knows what question it is ultimately answering. - The
sqlquery that we used to fetch the results from the database. - The database query results (
rows). - Clear instructions about what we want ChatGPT to do now—that is, “return the resulting data to me in a human-readable way” (along with some other guidelines).
Similar to before, we send these settings to the create function, and then pass the response content up to the caller.
Other implementation details (not shown)
The code snippets we’ve shown cover the major implementation details for our API development. You can always take a look at the GitHub repo to see all the code, line by line. Some details that we didn’t cover here are:
- Creating a PostgreSQL database with an
employeestable and populating it with dummy data. See thedata/create_schema.sqlanddata/create_records.sqlfor this. - Implementing bearer auth for our API (see
src/auth.js). Requests to our API must attach an API key that we generate. We store this API key as an environment variable calledBEARER_AUTH_API_KEY. We’ll discuss this lower down when configuring our GPT. - Writing basic unit tests with Jest.
- ESLint and Prettier configurations to keep our code clean and readable.
Testing our API’s business logic
With all of our code in place, we can test our API by sending a POST request, just like our GPT would send a request when a user makes a query. When we start our server locally, we make sure to have a .env file that contains the environment variables that our API will need:
OPENAI_API_KEY: TheopenaiJavaScript package uses this to authenticate requests we send to the Chat Completions API.BEARER_AUTH_API_KEY: This is the API key that a caller of our API will need to provide for authentication.DATABASE_URL: The PostgreSQL connection string for our database.
An example .env file might look like this:
OPENAI_API_KEY=sk-Kie************************************************
BEARER_AUTH_API_KEY=thisismysecretAPIkey
DATABASE_URL=postgres://db_user:db_pass@localhost:5432/company_hr_db
We start our server:
node index.js
In a separate terminal, we send a curl request to our API:
curl -X POST
  --header "Content-type:application/json"
  --header "Authorization: Bearer thisismysecretAPIkey"
  --data "{"message":"Please find names and hire dates of any employees in the marketing department hired after 2018. Sort them by hire date."}"
  https://localhost:3000/search
I found the names and hire dates of employees in the marketing department who were hired after 2018. The data is sorted by hire date in ascending order. Here are the results:
- Jailyn McClure, hired on 2019-02-21
- Leopold Johnston, hired on 2019-02-21
- Francis Kris, hired on 2019-10-09
- Jerad Strosin, hired on 2019-10-22
- Daniela Boehm, hired on 2020-05-25
- Joe Torp, hired on 2020-05-31
- Harry Heaney, hired on 2020-08-16
- Anabel Sporer, hired on 2020-12-22
- Carson Gislason, hired on 2020-12-25
- Bud Farrell, hired on 2021-05-04
- Katelynn Swaniawski, hired on 2021-07-13
- Ernesto Baumbach, hired on 2021-08-15
- Gwendolyn DuBuque, hired on 2021-10-10
- Willow Green, hired on 2021-11-20
- Rodrigo Fay, hired on 2022-07-04
- Makayla Crooks, hired on 2022-08-02
- Gerry Boehm, hired on 2022-09-28
- Gretchen Mertz, hired on 2023-02-15
- Chloe Bayer, hired on 2023-03-30
- Alek Herman, hired on 2023-05-25
- Eloy Flatley, hired on 2023-08-25
- Zackery Welch, hired on 2023-09-08
Our API works as expected! It interpreted our request, queried the database successfully, and then returned results in a human-readable format.
Now it’s time to create our custom GPT.
Deploy to Heroku
First, we need to deploy our API application to Heroku.
Step 1: Create a new Heroku app
After logging in to Heroku, go to the Heroku dashboard and click Create new app.
Provide a name for your app. Then, click Create app.

Step 2: Connect your Heroku app to your project repository
With your Heroku app created, connect it to the GitHub repository for your project.
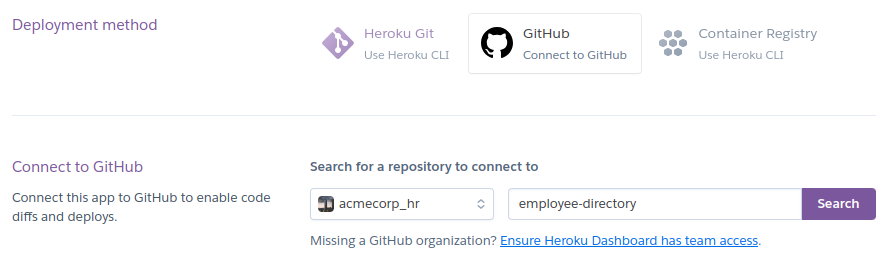
Step 3: Add Heroku Postgres
You’ll also need a PostgreSQL database running alongside your API. Go to your app’s Resources page and search the add-ons for “postgres.”

Select the “Mini” plan and submit the order form.
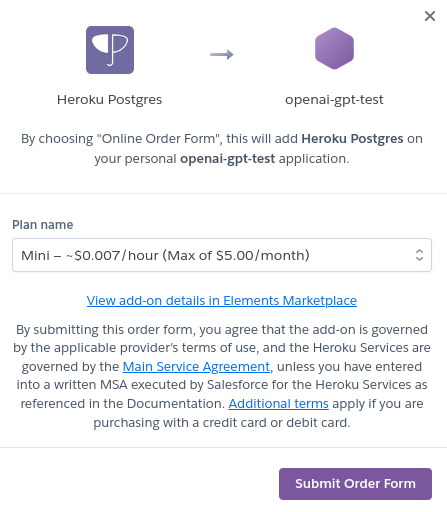
Step 4: Set up app config vars
You’ll recall that our API depends on a few environment variables (in .env). When deploying to Heroku, you can set these up by going to your app Settings, Config Vars. Add a new config var called OPENAI_API_KEY, and paste in the value you copied from OpenAI.
Notice that Heroku has added a DATABASE_URL config var based on your Heroku Postgres add-on. Convenient!
Finally, you need to add a config var called BEARER_AUTH_API_KEY. This is the key that any caller of our API (including ChatGPT, through our custom GPT’s action) will need to provide for authentication. You can set this to any value you want. We used an online random password generator to generate a string.
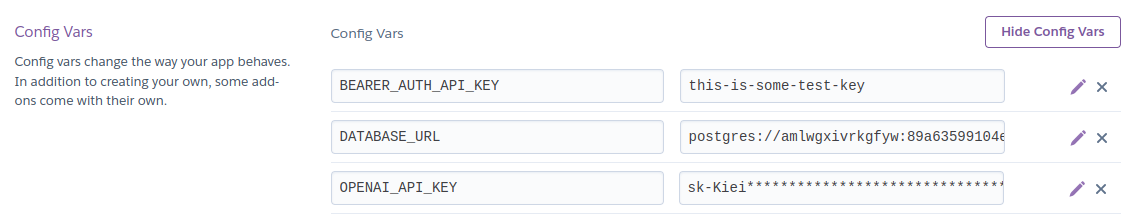
Step 5: Seed the database
Don’t forget to seed your newly running Heroku Postgres database with the dummy data. Assuming you have the Heroku CLI installed, accessing your database add-on is incredibly convenient. Set up your database with the following:
heroku pg:psql < create_schema.sql
heroku pg:psql < create_records.sql
Step 6: Deploy
Go to the Deploy tab for your Heroku app. Click Deploy Branch. Heroku takes the latest commit on the main branch, installs dependencies, and then starts the server (yarn start). You can deploy your API in seconds with just one click.

After you’ve deployed your application, click Open app

Opening your app to the default page will show a Swagger UI interface with the API specification for our app. We get this by adding functionality from the swagger-ui-express package.
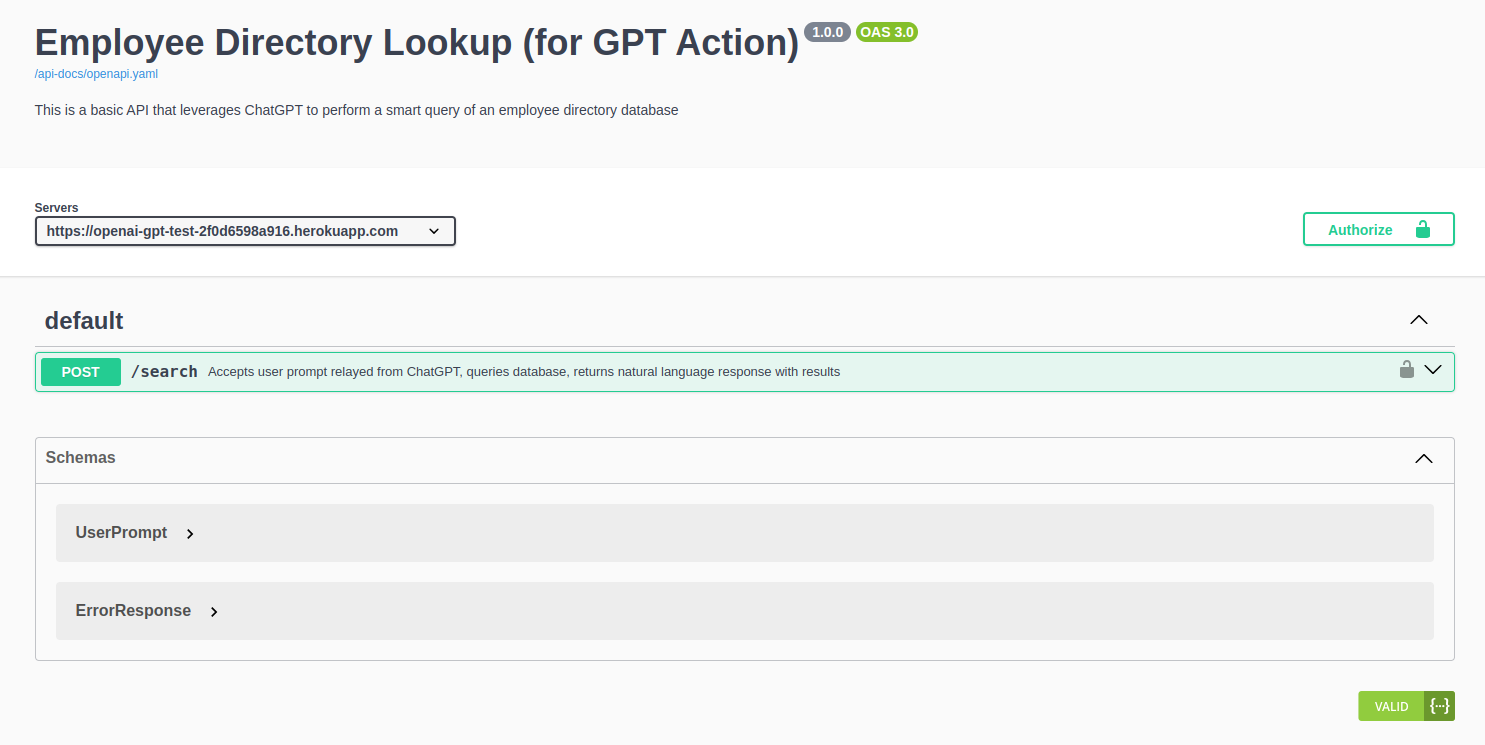
Create and Configure GPT
Creating a GPT is quick and easy. When you’re logged into https://chat.openai.com/, click Explore GPTs in the left-hand navigation. Then, click the + Create button.
Configure the initial settings
There are two tabs you can navigate when creating a GPT. The Create tab is a wizard-style interface where you interact with the GPT Builder to solidify what you want your GPT to do. Since we already know what we want to do, we will configure our GPT directly. Click the Configure tab.

We provide a name, description, and basic instructions for our GPT. We also upload the logo for our GPT. The codebase has a logo you can use: resources/logo.png.
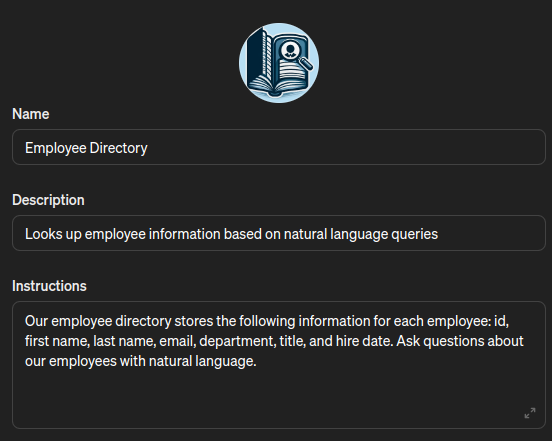
For “Capabilities”, we can uncheck all of the options, as our GPT will not need to use them.
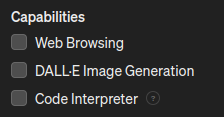
Create new action
The “meat” of our GPT will be an action that calls our Heroku-deployed API. At the bottom of the Configure page, we click Create new action.

To configure our GPT’s action, we need to specify the API authentication scheme and provide the OpenAPI schema for our API. With this information, our GPT will have what it needs to call our API properly.
For authentication, we select API Key as the authentication type. Then, we enter the value we set in our variables for BEARER_AUTH_API_KEY. Our auth type is Bearer.
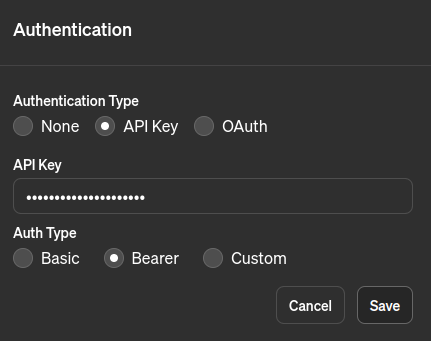
For schema, we need to import or paste in the OpenAPI specification for our API. This specification let's ChatGPT know what endpoints are available and how to interact with our API. Fortunately, because we use swagger-ui-express, we have access to a dynamically generated OpenAPI spec simply by visiting the /api-docs/openapi.yaml route in our Heroku app.
We click Import from URL and paste in the URL for our Heroku app serving up the OpenAPI spec (for example, https://my-gpt-12345.herokuapp.com/api-docs/openapi.yaml). Then, we click Import. This loads in the schema.
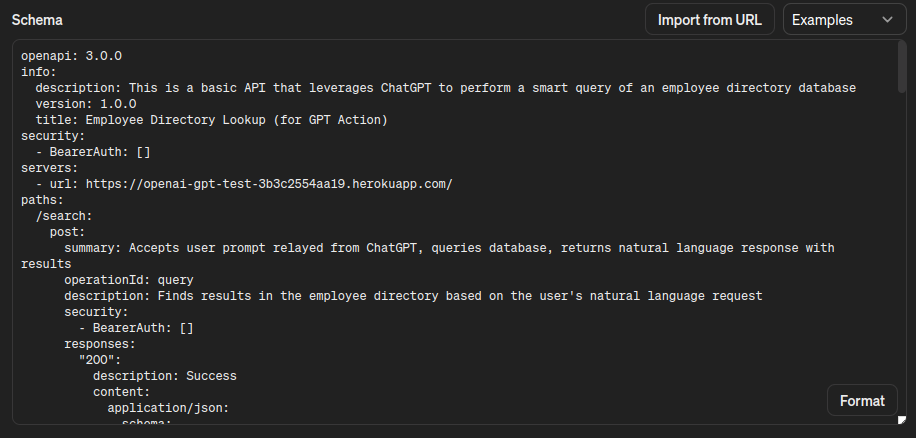
With the configurations for action set, we click Save (Publish to Only me).
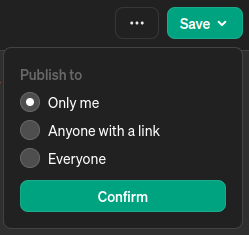
Now, we can test out some interactions with our GPT.

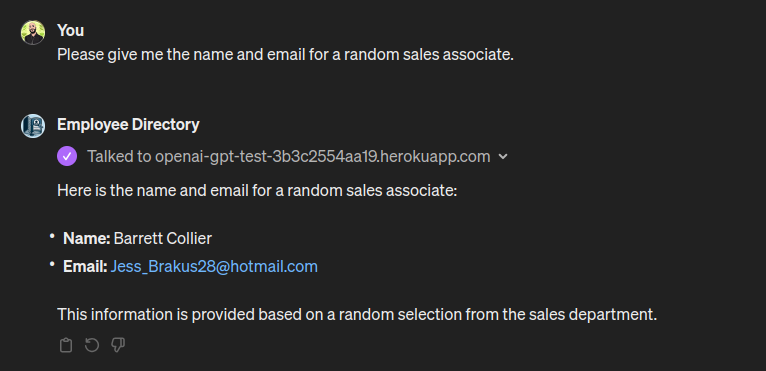
Everything is connected and working! If you’ve been following by performing all these steps along the way, then congratulations on building your first GPT!
Conclusion
Experience in building and deploying custom GPTs sets you up to enhance the ChatGPT experience of businesses and individuals who are adopting it en masse. The majority of the work in building a GPT with an action is in implementing the API. After this, you only need to make a few setup configurations, and you’re good to go.
Deploying your API to Heroku—along with any add-ons you might need, like a database or a key-value store—is quick, simple, and low cost. When you’re ready to get started, sign up for a Heroku account and begin building today!
The post Building a GPT Backed by a Heroku-Deployed API appeared first on Heroku.
]]>Heroku is excited to introduce nine new dyno types to our fleets and product offerings. In 2014 , we introduced Performance-tier dynos , giving our customers fully dedicated resources to run their most compute-intensive workloads. Now in 2024, today's standards are rapidly increasing as complex applications and growing data volumes consume more memory and carry heavier CPU loads.
With these additional dyno types, we’re excited to enable new use cases on Heroku with enhanced compute and memory specifications. Some use case examples include real-time processing against big data/real-time analytics, large in-memory cache applications such…
The post Expanded Memory and Compute with Heroku’s New Larger Dynos appeared first on Heroku.
]]>Heroku is excited to introduce nine new dyno types to our fleets and product offerings. In 2014, we introduced Performance-tier dynos, giving our customers fully dedicated resources to run their most compute-intensive workloads. Now in 2024, today's standards are rapidly increasing as complex applications and growing data volumes consume more memory and carry heavier CPU loads.
With these additional dyno types, we’re excited to enable new use cases on Heroku with enhanced compute and memory specifications. Some use case examples include real-time processing against big data/real-time analytics, large in-memory cache applications such as Apache Spark or Hadoop processing, online gaming, machine learning, video encoding, distributed analytics, and complex or large simulations.
Heroku is addressing these modern developer requirements with three new dyno types for each of our Performance, Private, and Shield dyno tiers:
- Performance-L-RAM, Performance-XL, and Performance-2XL for Heroku Common Runtime
- Private-L-RAM, Private-XL, and Private-2XL for Private Spaces
- Shield-L-RAM, Shield-XL, and Shield-2XL for Shield Private Spaces

What’s New
We created three distinct new dyno sizes for each of the Performance, Private and Shield tiers that allow for increased flexibility and higher performance ceilings for Heroku customers.
- Performance/Private/Shield-L-RAM: If you’re targeting more memory-focused tasks, you can lower your CPUs, and double your RAM while maintaining the same cost as existing *-L dynos. These dynos are perfect for tackling memory-intensive tasks like large-scale image processing or data analysis.
- Performance/Private/Shield-XL: quadruples your RAM while providing the same stellar CPU performance as *-L dynos, empowering you to run simulations or deliver lightning-fast processing.
- Performance/Private/Shield-2XL: delivers a staggering 8x RAM and 2x CPU boost compared to our *-L dynos, unleashing the full potential of your ambitious projects.
See the updated dyno table for how these new dynos stack up to our previous offering:
| Spec | Memory (RAM) | CPU Share | Compute | Sleeps | Dedicated |
|---|---|---|---|---|---|
| Eco | 512 MB | 1x | 1x-4x |  |
|
| Basic | 512 MB | 1x | 1x-4x | ||
| Standard-1X | 512 MB | 1x | 1x-4x | ||
| Standard-2X | 1024 MB | 2x | 2x-8x | ||
| Performance-M | 2.5 GB | 100% | 12x | |
|
| Performance-L | 14 GB | 100% | 50x | |
|
| Performance/Private/Shield-L-RAM | 30 GB | 100% | 24x | |
|
| Performance/Private/Shield-XL | 62 GB | 100% | 50x | |
|
| Performance/Private/Shield-2XL | 126 GB | 100% | 100x | |
You can migrate applications in seconds using simple CLI commands or through the Heroku Dashboard.
Pricing information is transparent and costs are prorated to the second, so you only pay for what you use. Visit the Heroku pricing page for more details and the Heroku Dev Center on how to unlock more power with these new dynos.
Get Started with New Dynos
All Heroku customers interested in using our new Performance dynos for their applications can start today. The process is simple and follows the typical process of spinning up and switching dyno types.
To provision these dyno types from the Heroku Dashboard, follow the Heroku Dev Center steps on setting dyno types.
Or simply run the following CLI command:
$ heroku dyno:type performance-2xl
Private Space customers can also use the new Private Dynos, and Shield Private Space customers can use the new Shield Dynos in their spaces.
How Heroku Uses the New Dynos
As we started to internally test and prepare the new dyno types for general availability, the Heroku Connect team was a prime candidate as an internal customer. Its data-intensive operations power the Heroku Connect product offering, which enables developers seamlessly access Salesforce CRM data using Heroku Postgres. This bi-directional data synchronization requires hundreds of Shield dynos to make sure data is up-to-date and accurate between Salesforce and Postgres. With a growing number of Heroku Connect customers, the Connect team was reaching the memory limits of our Shield-L dynos, requiring constant scale-ups to meet customer demands.
At the beginning of February, the Connect team upgraded their dyno fleets from Shield-L to Shield-XL dynos. After monitoring the platform and re-scaling appropriately, the team successfully reduced the total number of dynos required to run the data synchronization. The new formation continued to meet all of the availability and data quality requirements that Connect customers expect. In total, by changing their formation to utilize the new dyno sizes, the team reduced the estimated compute-specific costs of running Heroku Connect jobs by almost 20%!
From a senior engineer on the Heroku Connect team:
"We were able to reduce cost and reduce the number of dynos we needed because a lot of these operations are memory-heavy. With the newer dynos, we overcame this bottleneck of memory which required us to add more dynos in the past".
We hope that our customers can perform the same cost optimizations unlocked by these new dyno offerings. This launch is another step towards making Heroku a more cost-effective cloud platform.
We’re excited for the internal wins for our Heroku teams. We’re even more excited to see what new projects and optimizations are possible for our customers now that these dynos are generally available.
Conclusion
With the new larger dyno types, we’re pushing the boundaries of what is possible with Heroku. We’re working to make our platform, bigger, faster, and more resilient. We’re continuously listening to our customers on our Github Public Roadmap. The valuable feedback on the Larger Dynos roadmap item led to this change.
Paired with our recently announced plans for flexible storage on Heroku Postgres, we're working hard to make sure Heroku can scale with your business.
The post Expanded Memory and Compute with Heroku’s New Larger Dynos appeared first on Heroku.
]]>Cybersecurity Threat Mitigation
Usernames and passwords are prime targets for cybercriminals. Frequently, individuals use the same password across multiple…
The post SSO for Pay-as-you-go Customers appeared first on Heroku.
]]>Cybersecurity Threat Mitigation
Usernames and passwords are prime targets for cybercriminals. Frequently, individuals use the same password across multiple platforms. In the event of a security breach, hackers can exploit these credentials to infiltrate corporate systems. Implementing Single Sign-On (SSO) minimizes the proliferation of credentials to a single, managed point.
Improved Usability
Developers interact with a multitude of applications every day. SSO eliminates the hassle of maintaining distinct sets of usernames and passwords for each application.
Lower Support Overhead
When users manage login credentials for different tools, they’re more likely to forget passwords. By adopting SSO, you can reduce support overhead.
Enable SSO
Team admins can enable SSO in the Settings tab of the Heroku Dashboard.
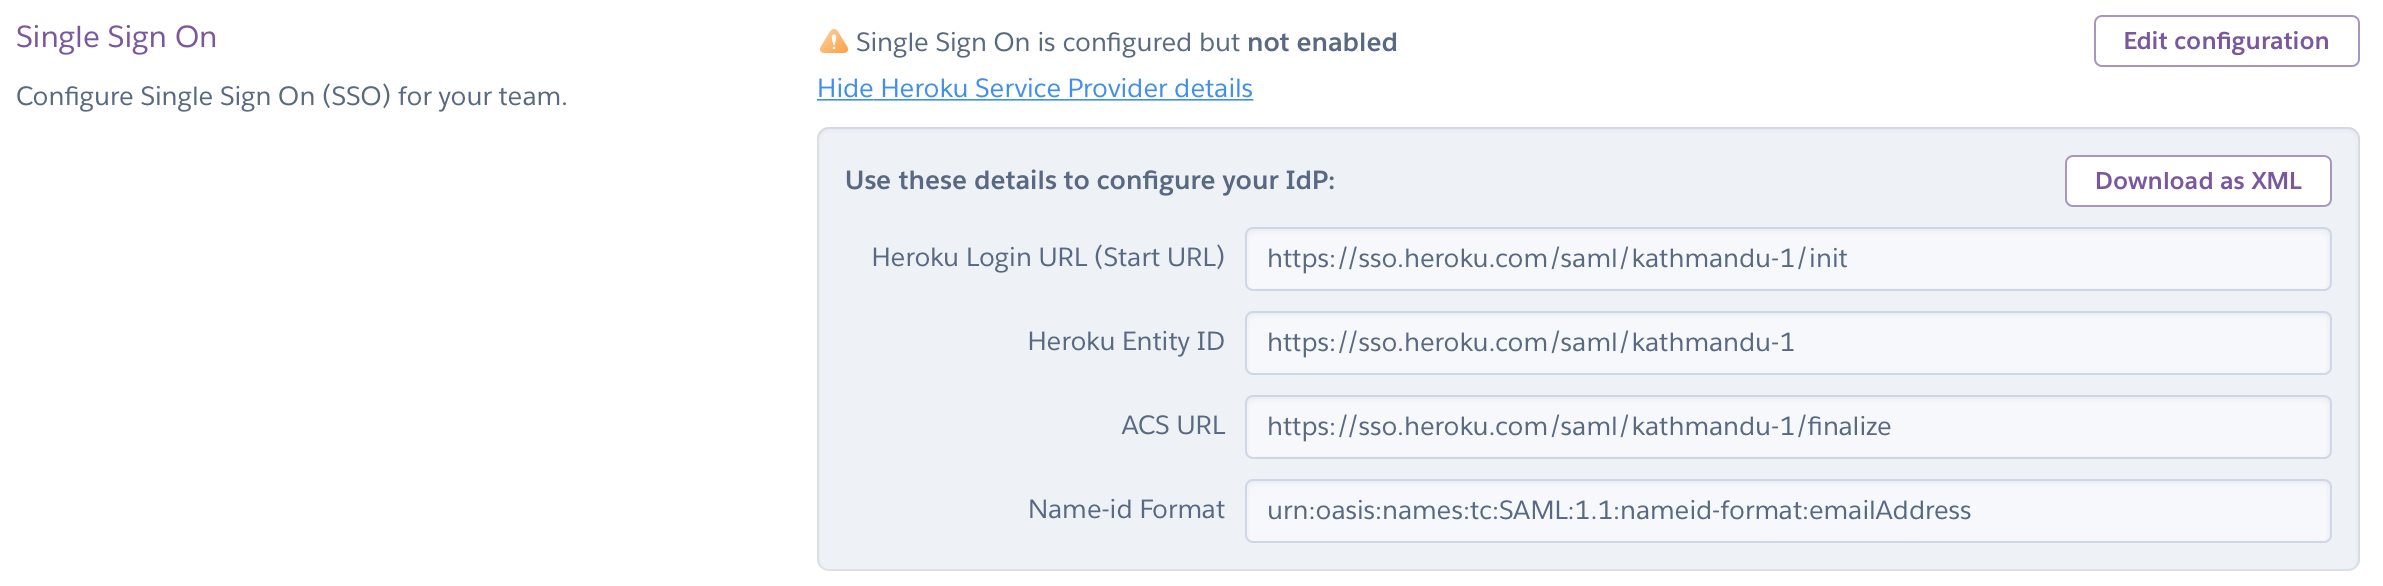
Note: You must have team admin permissions to see this information and enable SSO.

To add end users, create accounts for those users in your IdP. The first time a user logs in to Heroku via the IdP, we create a Heroku account for them via automatic IdP provisioning. You can specify the default role for new user creation, with the default set to member initially.

Conclusion
At Heroku, we take the trust, security, and availability of your apps seriously. Extending SSO to Heroku Teams is yet another step to improving security for all customers.
If you have any thoughts or suggestions on future reliability improvements we can make, check out our public roadmap on GitHub and submit an issue!
The post SSO for Pay-as-you-go Customers appeared first on Heroku.
]]>The post Heroku Cloud Native Buildpacks: Bringing Heroku Magic to Container Images appeared first on Heroku.
]]>
Buildpacks for Heroku and Beyond
Deploying an app to Heroku is as simple as running git push heroku main. Behind the scenes, buildpacks take care of the dependencies, caching, and compilation for any language your app uses. By open sourcing our buildpacks and the Buildpack API, Heroku lets you customize your build process. Extensibility remains a core principle on Heroku, whether that’s changing a single line in the buildpack or supporting an entirely new language.
Our vision for buildpacks has always extended beyond Heroku. We strive to create a standard that minimizes lock-in, maximizes transparency, and enables developers to share application building practices.
Today, OCI images are the new cloud executables. In a joint effort with Pivotal, we invented Cloud Native Buildpacks as a standardized way to build container images directly from source code, without needing Dockerfiles. We built these CNBs on years of experience with our existing buildpacks and running them at scale in production. CNBs offer a new level of portability while also making containers more accessible to developers.
![]()
Get Started with Heroku Cloud Native Buildpacks
Building container images with Heroku Cloud Native Buildpacks is simple. All you need is a container runtime like Docker and the pack CLI. With these tools, you can transform any source code into a portable OCI image using Heroku CNBs.
Let’s see these CNBs in action with our existing Node.js Getting Started Guide, which intentionally omits a Dockerfile:
$ git clone https://github.com/heroku/node-js-getting-started
$ cd node-js-getting-started
$ pack build my-node-app --builder heroku/builder:22
22: Pulling from heroku/builder
...
===> ANALYZING
Image with name "my-node-app" not found
===> DETECTING
3 of 5 buildpacks participating
heroku/nodejs-engine 2.6.6
heroku/nodejs-npm-install 2.6.6
heroku/procfile 3.0.0
===> RESTORING
===> BUILDING
...
[Discovering process types]
Procfile declares types -> web
===> EXPORTING
...
Setting default process type 'web'
Saving my-node-app...
*** Images (97b42d93c354):
my-node-app
Adding cache layer 'heroku/nodejs-engine:dist'
Adding cache layer 'heroku/nodejs-npm-install:npm_cache'
Successfully built image my-node-app
This command builds a fully OCI-compliant container image named my-node-app. You can push it to any OCI registry, use it as a base image in a Dockerfile, or run it locally as a container.
To run our sample express Node.js application locally on port 9292, we can use a basic docker run command:
$ docker run --env PORT=9292 -p 9292:9292 my-node-app
The Heroku Cloud Native Buildpacks preview release is just the tip of the iceberg. We're so excited for you to try them even though our platform won’t officially support them until later this year. Get ahead of the curve and experiment with Heroku CNBs today. We're eager to hear your thoughts and see what you create with them. Head over to the project on GitHub and join us in shaping the future of application packaging!
The post Heroku Cloud Native Buildpacks: Bringing Heroku Magic to Container Images appeared first on Heroku.
]]>Our teams continued to grow to meet the demands of our many existing and new customers in 2023. Customers who do things like make safer cars, bring us…
The post 2023: Delivering Innovation and Customer Success appeared first on Heroku.
]]>
Customer Success
Our teams continued to grow to meet the demands of our many existing and new customers in 2023. Customers who do things like make safer cars, bring us live music, deliver last-minute items to our door, and ensure that more people get the affordable healthcare they need. The many ways that Heroku serves as the catalyst for businesses across the globe never fails to amaze our employees.
One example is HealthSherpa who enrolled 6.6 million individuals and families into Affordable Care Act health insurance during the 2024 open enrollment period. The enrollment made up 40% of the total enrollments completed through the Federally Facilitated Marketplace.
Equally exciting is the way that Live Nation brings entertainment to the world using Heroku. The Live Nation team joined us on stage at Dreamforce and shared how they use Heroku and Salesforce to create a custom concert planning system. The Heroku app shaved off 15+ hours from the old process for mounting a tour and ensured that everyone from roadie to food vendor to artist is paid a fair wage.
Delivering Innovations
2023 marked a year of delivering on customer requests about how we can improve the product. We started with the release of larger Postgres plans. Larger plans have been a popular request for a long time and we were excited to deliver it last year.
Our global footprint has been front and center with requests for additional Private Space regions. Now you can launch a Private Space in Canada and India, and we’ll continue to listen for other country requests.
Our customers were very vocal in 2023 about their need to innovate efficiently and economically on Heroku. We listened and added Basic dynos for Enterprise customers. Customers in India can once again pay for services via credit card. We also eliminated fees for Heroku CI and large teams.
Salesforce and Heroku announced a brand new partnership with AWS at the end of 2023. Now customers can purchase Heroku on the AWS Marketplace. The partnership lets us accelerate our innovation in AI and offer more flexible compute and storage for products like Heroku Postgres by leveraging Amazon Aurora.
We believe Heroku has a key role to play in the future of AI apps. As we’ve done for general application development, we’re making the hard things easy and letting our customers focus on experiences that differentiate them. We closed out the year by launching the support for pgvector. pgvector allows Heroku Postgres to quickly find similar data points in complex data, which is great for applications like recommendation systems and prompt engineering for large language models (LLMs). This is just the beginning of what it looks like to bring the Heroku developer experience to AI.
These innovations are just the highlights. We shipped over 200 changes to the platform, ranging from small to large improvements that keep our customers focused on delivering great experiences.
Growing the Community
We know that many communities learn to code on Heroku. In 2023 we provided over 27,000 students access to Heroku through the GitHub Student program. You can learn more about our involvement in the GitHub student program or enroll as a student here. We extended our student program and are now offering 2 years of Heroku credits to learn with Heroku. We're passionate about the open-source community, and in 2023, we proudly supported 28 projects through our new Open Source Credits program. One of these standout projects is Ember.js, a powerful frontend framework run entirely by volunteers. The team uses Heroku to show up just like giant projects with big corporate budgets backing them!
Our teams were at EmberConf, RubyConf, KubeCon, TrailblazerDX, Dreamforce, and AWS re:Invent in 2023. Heroku’s CTO & SVP of Engineering Gail Frederick spoke at re:Invent about database innovation. Each event brought us closer to the developer community and new opportunities to learn. The reception from our customers at these events has been amazing and validates how important it is for Heroku to represent not just at Salesforce events but broader industry events as well. We can’t wait to meet more of you in 2024!
We’re looking forward to engaging with our customers and partners in 2024, starting with our Heroku Developer Meetup on March 5, 2024 and TrailblazerDX on March 6-7, 2024. We’re hosting six sessions including developing AI apps with Heroku, and so much more. If you have product-specific questions, come meet our technical team at our demo booths. We’re following up TrailblazerDX with KubeCon in Paris as we embark on our renewed commitment to Cloud Native.
Want to learn more about what’s to come and how to interact with us? Follow us on YouTube, LinkedIn, X. To see what else we’re working on, or to suggest enhancements and new features for Heroku, check out our public roadmap on GitHub.
The post 2023: Delivering Innovation and Customer Success appeared first on Heroku.
]]>The post TrailblazerDX 2024: More Heroku Experiences appeared first on Heroku.
]]>
Developer Meetup: Connecting the Heroku Community
Heroku, Salesforce's robust PaaS offering, is set to take center stage with six insightful sessions catering to both novice developers and seasoned architects. The anticipation begins before the official conference kick-off, with the Heroku Developer Meetup on March 5, from 2-6 pm at the Salesforce Tower. This afternoon promises a sneak peek into the latest Heroku releases, engaging discussions, and a chance to challenge your skills at the Heroku AI Arcade. For those eager to network, you’ll also get to hear from senior leadership and stay for a networking event. This event is SOLD OUT! We look forward to adding more Developer events later this year.
TrailblazerDX Heroku Hands-On Activations and Demos
The hands-on activations and demos at TrailblazerDX 2024 offer attendees a chance to explore Heroku's capabilities and to directly interact with Heroku engineers and technical architects. These interactive experiences transform the learning environment into a collaborative space where attendees can tap into the wealth of knowledge possessed by Heroku team members.
Heroku AI Arcade – Solve code challenges using an AI assistant
Come to the Heroku AI Arcade, where participants can put their skills to the test by solving code challenges with the assistance of an AI companion. Learn while actively applying your knowledge in a fun and dynamic environment.
Camp Mini Hacks – Solve a 30-minute Heroku challenge
Immerse yourself in Camp Mini Hacks, where you have the opportunity to solve a unique 30-minute Heroku challenge that navigates a real-world scenario. Participants will gain practical insights into Heroku's functionalities and enhance their problem-solving skills.
Heroku Connect – Synchronize Salesforce data with Postgres
In this demo, Heroku experts lead you through the seamless integration between Salesforce and Heroku as Heroku Connect takes center stage. Learn how to synchronize Salesforce data with Postgres effortlessly, unlocking new possibilities for data management and accessibility.
Vector DB on Heroku Postgres – Implement retrieval-augmented generation with AI-enabled search
Step into the future of AI-driven search with the Vector DB on Heroku Postgres demo. Discover how to implement retrieval-augmented generation, enhancing search capabilities with artificial intelligence. This hands-on experience empowers developers to harness the power of AI in their applications, bringing innovation to the forefront of their projects.
TrailblazerDX Heroku Theater and Breakout Sessions
Heroku has a lineup of six sessions at this year’s TDX. These sessions cover topics from unlocking the full potential of customer engagement strategies to delving into the realm of artificial intelligence. Led by Heroku staff, these theater and breakout sessions cover topics specific to the developer and IT community.
Boost Engagement with Heroku and Salesforce Data Cloud
Also available on Salesforce+
Presenter: Vivek Viswanathan, Director of Product Management, Salesforce
This session promises to unlock the full potential of your customer engagement strategy. Whether you're a developer or an IT leader, learn how to build trusted personalized ecommerce, loyalty, social engagement, and service apps that seamlessly integrate with Salesforce clouds. Get ready to take your customer engagement strategy to new heights.
Wednesday, March 6 | 2:30 PM – 3:10 PM PST
Build AI Applications on Heroku
Also available on Salesforce+
Presenter: Julián Duque, Principal Developer Advocate, Salesforce
For architects and developers eager to harness the power of AI, this session is a must-attend. Julián Duque, a seasoned expert, guides you through building Heroku applications using AI patterns such as retrieval-augmented generation, agents, GPT actions, open-source languages, and leveraging Heroku Postgres with pgvector.. Dive into the world of AI and revolutionize your application development.
Thursday, March 7 | 9:30 AM – 10:10 AM PST
Build an Event Experience with pgvector Similarity Search
Presenter: Valerie Woolard, Software Engineering LMTS, Salesforce Heroku
In this session designed for architects and developers, Valerie Woolard demonstrates how to use pgvector to build an immersive experience for conference attendees with a Heroku application. Walk away with the ability to perform a similarity search with natural language processing, enhancing the user experience for your applications.
Wednesday, March 6 | 5:00 PM – 5:20 PM PST
Choosing the Right AI Model for Your Heroku Application
Presenter: Rand Fitzpatrick, Senior Director, Product Management, Heroku
Learn the art of selecting the right AI models for your Heroku application. Rand Fitzpatrick, a Senior Director in Product Management at Heroku, guides developers and IT leaders through understanding how to choose models tailored to your specific task, data, and modalities. Achieve the efficiencies and effectiveness you need for your AI applications.
Thursday, March 7 | 2:00 PM – 2:40 PM PST
See How Heroku Postgres is Changing with Amazon Aurora
Presenters: Jonathan K Brown, Sr. Product Manager, Salesforce and Justin Downing, Software Engineering Architect, Salesforce
Explore the evolution of Heroku Postgres with the development of new infrastructure on Amazon Aurora. Learn about enhanced performance, flexibility, scalability, extensibility, and the simplicity Heroku brings to the table. For developers and IT leaders, this session is an opportunity to stay at the forefront of database technology.
Thursday, March 7 | 8:00 AM – 8:20 AM PST
Using Heroku Connect to Leverage Your Salesforce Data
Presenters: Dan Mehlman, Director, Technical Architecture, Salesforce and Jess Carosello, Senior Salesforce Admin – Heroku
Discover the power of Salesforce data across your enterprise. Join this session to learn how to use Heroku Connect to easily leverage Salesforce and expand your data model. This session is ideal for developers looking to integrate Salesforce seamlessly into their applications.
Wednesday, March 6 | 3:30 PM – 3:50 PM PST
Conclusion
As we gear up for TrailblazerDX 2024, the excitement is mounting. For the Heroku team, it's about the technology and so much more. We look forward to connecting with a community of like-minded developers, architects, and IT leaders. Whether you're a seasoned Heroku user or just stepping into the world of PaaS, TDX promises a unique blend of learning, networking, and hands-on experiences.
Register today and add your favorite Heroku sessions to your agenda. Salesforce Events mobile app available for iOS and Android.
The post TrailblazerDX 2024: More Heroku Experiences appeared first on Heroku.
]]>Certificates handled by ACM automatically renew one month before they expire. New certificates are created automatically whenever…
The post Automatic Certificate Management for Eco Dynos appeared first on Heroku.
]]>Certificates handled by ACM automatically renew one month before they expire. New certificates are created automatically whenever you add or remove a custom domain to an app. Automated Certificate Management makes running secure and compliant apps on Heroku simple. Heroku ACM uses Let’s Encrypt, the free, automated, and open certificate authority for managing TLS certificates. Heroku sponsors Let’s Encrypt, which the Internet Security Research Group (ISRG) runs for public benefit.
You can enable ACM for any app by running the following command:
$ heroku certs:auto:enable
Previously, Heroku automatically enabled ACM when apps were upgraded from Eco to larger dynos. We deprecated this behavior and ACM is no longer auto-enabled when making any dyno type change. See the changelog entry for details.
Conclusion
At Heroku, we take the trust, reliability and availability of your apps seriously. Supporting ACM & manual certificate uploads for Eco dynos is another step to improving security for all app types. Your satisfaction is our priority, and we’re excited to continue delivering features that enhance your experience.
If you have any thoughts or suggestions on future reliability improvements we can make, check out our public roadmap on GitHub and submit an issue!
The post Automatic Certificate Management for Eco Dynos appeared first on Heroku.
]]>Near the end of 2023, ChatGPT announced that it had 100M weekly users. That’s a massive base of users who want to take advantage of the convenience and power of intelligent question answering with natural language.
With this level of popularity for ChatGPT, it’s no wonder that software developers are joining the ChatGPT app gold rush, building tools on top of OpenAI’s APIs. Building and deploying a GenAI-based app is quite easy to do—and we’re going to show you how!
…
The post Working with ChatGPT Functions on Heroku appeared first on Heroku.
]]>Near the end of 2023, ChatGPT announced that it had 100M weekly users. That’s a massive base of users who want to take advantage of the convenience and power of intelligent question answering with natural language.
With this level of popularity for ChatGPT, it’s no wonder that software developers are joining the ChatGPT app gold rush, building tools on top of OpenAI’s APIs. Building and deploying a GenAI-based app is quite easy to do—and we’re going to show you how!
In this post, we walk through how to build a Node.js application that works with OpenAI’s Chat Completions API and uses its function calling feature. We deploy it all to Heroku for quick, secure, and simple hosting. And we’ll have some fun along the way. This project is part of our new Heroku Reference Applications, a GitHub organization where we host different projects showcasing architectures to deploy to Heroku.
Ready? Let’s go!
Meet the Menu Maker
Our web application is called Menu Maker. What does it do? Menu Maker lets users enter a list of ingredients that they have available to them. Menu Maker comes up with a dish using those ingredients. It provides a description of the dish as you’d find it on a fine dining menu, along with a full ingredients list and recipe instructions.
This basic example of using generative AI uses the user-supplied ingredients, additional instructional prompts, and some structured constraints via ChatGPT's functions calling to create new content. The application’s code provides the user experience and the data flow.
Menu Maker is a Node.js application with a React front-end UI that talks to an Express back-end API server. The Node.js application is a monorepo, containing both front-end and back-end code, stored at GitHub. The entire application is deployed on Heroku.
Here’s a preview of Menu Maker in action:

Let’s briefly break down the application flow:
- The back-end server takes the user’s form submission, supplements it with additional information, and then sends a request to OpenAI’s Chat Completions API.
- The back-end server receives the response from OpenAI and passes it up to the front-end.
- The front-end updates the interface to reflect the response received from OpenAI.

Prerequisites
Note: If you want to try the application first, deploy it using the “Deploy to Heroku” button in the reference application’s README file.
Before we dive into the code let’s cover the prerequisites. Here’s what you need to get started:
- An OpenAI account. You must add a payment method and purchase a small amount of credit to access its APIs. As we built and tested our application, the total cost of all the API calls made was less than $1*.
- After setting up your OpenAI account, create a secret API key and copy it down. Your application back-end needs this key to authenticate its requests to the OpenAI API.
- A Heroku account. You must add a payment method to cover your compute costs. For building and testing this application, we recommend using an Eco dyno, which has a $5 monthly flat fee and provides more than enough hours for your initial app.
- A GitHub account for your code repository. Heroku hooks into your GitHub repo directly, simplifying deployment to a single click.
Note: Every menu recipe request incurs costs and the price varies depending on the selected model. For example, using the GPT-3 model, in order to spend $1, you'd have to request more than 30,000 recipes. See the OpenAI API pricing page for more information.
Initial Steps
For our environment, we use Node v20.10.0 and yarn as our package manager. Start by cloning the codebase available in our Heroku Reference Applications GitHub organization. Then, install your dependencies by running:
yarn install
Build the Back-End
Our back-end API server uses Express and listens for POST requests to the /ingredients endpoint. We supplement those ingredients with more precise prompt instructions, sending a subsequent request to OpenAI.
Working with OpenAI
Although OpenAI’s API supports advanced usage like image generation or speech-to-text, the simplest use case is to work with text generation. You send a set of messages to let OpenAI know what you’re seeking, and what kind of behavior you expect as it responds to you.
Typically, the first message is a system message, where you specify the desired behavior of ChatGPT. Eventually, you end up with a string of messages, a conversation, between the user (you) and the assistant (ChatGPT).
Call Functions with OpenAI
Most users are familiar with the chatbot-style conversation format of ChatGPT. However, developers want structured data, like a JSON object, in their ChatGPT responses. JSON makes it easier to work with responses programmatically.
For example, imagine asking ChatGPT for a list of events in the 2020 Summer Olympics. As a programmer, you want to process the response by inserting each Olympic event into a database. You also want to send follow-up API requests for each event returned. In this case, you don’t want several paragraphs of ChatGPT describing Olympic events in prose. You’d rather have a JSON object with an array of event names.
Use cases like these are where ChatGPT functions come in handy. Alongside the set of messages you send to OpenAI, you send functions, which detail how you use the response from OpenAI. You can specify the name of a function to call, along with data types and descriptions of all the parameters to pass to that function.
Note: ChatGPT doesn’t call functions as part of its response. Instead, it provides a formatted response that you can easily feed directly into a custom function in your code.
Initialize Prompt Settings with Function Information
Let’s take a look at src/server/ai.js. In our code, we send a settings object to the Chat Completions API. The settings object starts with the following:
const settings = {
  functions: [
    {
    name: 'updateDish',
    description: 'Generate a fine dining dish based on a list of ingredients',
    parameters: {
        type: 'object',
        properties: {
        title: {
            type: 'string',
            description: 'Name of the dish, as it would appear on a fine dining menu'
        },
        description: {
            type: 'string',
            description: 'Description of the dish, in 2-3 sentences, as it would appear on a fine dining menu'
        },
        ingredients: {
            type: 'array',
            description: 'List of all ingredients--both provided and additional ones in the dish you have conceived--capitalized, along with measurements, that would be needed to make 8 servings of this dish',
            items: {
            type: 'object',
            properties: {
                ingredient: {
                type: 'string',
                description: 'Name of ingredient'
                },
                amount: {
                type: 'string',
                description: 'Amount of ingredient needed for recipe'
                }
            }
            }
        },
        recipe: {
            type: 'array',
            description: 'Ordered list of recipe steps, numbered as "1.", "2.", etc., needed to make this dish',
            items: {
            type: 'string',
            description: 'Recipe step'
            }
        }
        },
        required: ['title', 'description', 'ingredients', 'recipe']
    }
    }
  ],
  model: CHATGPT_MODEL,
  function_call: 'auto'
}
We’re telling OpenAI that we plan to use its response in a function that we call updateDish, a function in our React front-end code. When calling updateDish, we must pass in an object with four parameters:
title: the name of our dishdescription: a description of our dishingredients: an array of objects, each having aningredientname andamountrecipe: an array of recipe steps for making the dish
Send Settings with Ingredients Attached
In addition to the functions specification, we must attach messages in our request settings, to clearly tell ChatGPT what we want it to do. Our module’s send function looks like:
const PROMPT = 'I am writing descriptions of dishes for a menu. I am going to provide you with a list of ingredients. Based on that list, please come up with a dish that can be created with those ingredients.'
const send = async (ingredients) => {
  const openai = new OpenAI({
    timeout: 10000,
    maxRetries: 3
  })
  settings.messages = [
    {
      role: 'system',
      content: PROMPT
    }, {
      role: 'user',
      content: `The ingredients that will contribute to my dish are: ${ingredients}.`
    }
  ]
  const completion = await openai.chat.completions.create(settings)
  return completion.choices[0].message
}
Our Node.js application imports the openai package (not shown), which serves as a handy JavaScript library for OpenAI. It abstracts away the details of sending HTTP requests to the OpenAI API.
We start with a system message that tells ChatGPT what the basic task is and the behavior we expect. Then, we add a user message that includes the ingredients, which gets passed as an argument to the send function. We send these settings to the API, asking it to create a model response. Then, we return the response message.
Handle the POST Request
In src/server/index.js, we set up our Express server and handle POST requests to /ingredients. Our code looks like:
import express from 'express'
import AI from './ai.js'
const server = express()
server.use(express.json())
server.post('/ingredients', async (req, res) => {
  if (process.env.NODE_ENV !== 'test') {
    console.log(`Request to /ingredients received: ${req.body.message}`)
  }
  if ((typeof req.body.message) === 'undefined' || !req.body.message.length) {
    res.status(400).json({ error: 'No ingredients provided in "message" key of payload.' })
    return
  }
  try {
    const completionResponse = await AI.send(req.body.message)
    res.json(completionResponse.function_call)
  } catch (error) {
    res.status(500).json({ error: error.message })
  }
})
export default server
After removing the error handling and log messages, the most important lines of code are:
const completionResponse = await AI.send(req.body.message)
res.json(completionResponse.function_call)
Our server passes the request payload message contents to our module’s send method. The response, from OpenAI, and then from our module, is an object that includes a function_call subobject. function_call has a name and arguments, which we use in our custom updateDish function.
Testing the Back-End
We’re ready to test our back-end!
The openai JavaScript package expects an environment variable called OPENAI_API_KEY. We set up our server to listen on port 3000, and then we start it:
OPENAI_API_KEY=sk-Kie*** node index.js
Server is running on port 3000
In a separate terminal, we send a request with curl:
curl -X POST
  --header "Content-type:application/json"
  --data "{"message":"cauliflower, fresh rosemary, parmesan cheese"}"
  https://localhost:3000/ingredients
{"name":"updateDish","arguments":"{"title":"Crispy Rosemary Parmesan Cauliflower","description":"Tender cauliflower florets roasted to perfection with aromatic fresh rosemary and savory Parmesan cheese, creating a crispy and flavorful dish.","ingredients":[{"ingredient":"cauliflower","amount":"1 large head, cut into florets"},{"ingredient":"fresh rosemary","amount":"2 tbsp, chopped"},{"ingredient":"parmesan cheese","amount":"1/2 cup, grated"},{"ingredient":"olive oil","amount":"3 tbsp"},{"ingredient":"salt","amount":"to taste"},{"ingredient":"black pepper","amount":"to taste"}],"recipe":["1. Preheat the oven to 425°F.","2. In a large bowl, toss the cauliflower florets with olive oil, chopped rosemary, salt, and black pepper.","3. Spread the cauliflower on a baking sheet and roast for 25-30 minutes, or until golden brown and crispy.","4. Sprinkle the roasted cauliflower with grated Parmesan cheese and return to the oven for 5 more minutes, until the cheese is melted and bubbly.","5. Serve hot and enjoy!"]}"}
It works! We have a JSON response with arguments that our back-end can pass to the front-end’s updateDish function.
Let’s briefly touch on what we did for the front-end UI.
Build the Front-End
All the OpenAI-related work happened in the back-end, so we won’t spend too much time unpacking the front-end. We built a basic React application that uses Material UI for styling. You can poke around in src/client to see all the details for our front-end application.
In src/client/App.js, we see how our app handles the user’s web form submission:
const handleSubmit = async (inputValue) => {
  if (inputValue.length === 0) {
    setErrorMessage('Please provide ingredients before submitting the form.')
    return
  }
  try {
    setWaiting(true)
    const response = await fetch('/ingredients', {
      method: 'POST',
      headers: {
        'Content-Type': 'application/json'
      },
      body: JSON.stringify({ message: inputValue })
    })
    const data = await response.json()
    if (!response.ok) {
      setErrorMessage(data.error)
      return
    }
    updateDish(JSON.parse(data.arguments))
  } catch (error) {
    setErrorMessage(error)
  }
}
When a user submits the form, the application sends a POST request to /ingredients. The arguments object in the response is JSON-parsed, then sent directly to our updateDish function. Using ChatGPT’s function calling feature significantly simplifies the steps to handle the response programmatically.
Our updateDish function looks like:
const [title, setTitle] = useState('')
const [waiting, setWaiting] = useState(false)
const [description, setDescription] = useState('')
const [recipeSteps, setRecipeSteps] = useState([])
const [ingredients, setIngredients] = useState([])
const [errorMessage, setErrorMessage] = useState('')
const updateDish = ({ title, description, recipe, ingredients }) => {
  setTitle(title)
  setDescription(description)
  setRecipeSteps(recipe)
  setIngredients(ingredients)
  setWaiting(false)
  setErrorMessage('')
}
Yes, that’s it. We work with React states to keep track of our dish title, description, ingredients, and recipe. When updateDish updates these values, all of our components update accordingly.
Our back-end and front-end pieces are all done. All that’s left to do is deploy.
Not shown in this walkthrough, but which you can find in the code repository, are:
- Basic unit tests for back-end and front-end components, using Jest
- ESLint and Prettier configurations to keep our code clean and readable
- Babel and Webpack configurations for working with modules and packaging our front-end code for deployment
Deploy to Heroku
With our codebase committed to GitHub, we’re ready to deploy our entire application on Heroku. You can also use the Heroku Button in the reference repository to simplify the deployment.
Step 1: Create a New Heroku App
After logging in to Heroku, click “Create new app” in the Heroku Dashboard.

Next, provide a name for your app and click “Create app”.
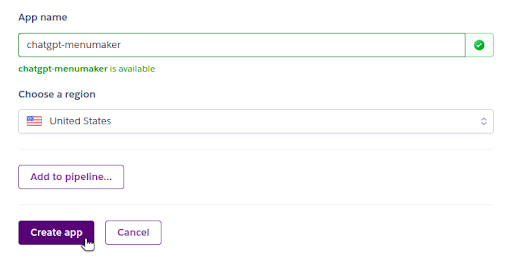
Step 2: Connect Your Repository
With your Heroku app created, connect it to the GitHub repository for your project.

Step 3: Set Up Config Vars
Remember that your application back-end needs an OpenAI API key to authenticate requests. Navigate to your app “Settings”, then look for “Config Vars”. Add a new config var called OPENAI_API_KEY, and paste in the value for your key.
Optionally, you can also set a CHATGPT_MODEL config var, telling src/server/ai.js which GPT model you want OpenAI to use. Models differ in capabilities, training data cutoff date, speed, and usage cost. If you don’t specify this config var, Menu Maker defaults to gpt-3.5-turbo-1106.

Step 4: Deploy
Go to the “Deploy” tab for your Heroku app. Click “Deploy Branch”. Heroku takes the latest commit on the main branch, builds the application (yarn build), and then starts it up (yarn start). With just one click, you can deploy and update your application in under a minute.

Step 5: Open Your App
With the app deployed, click “Open app” at the top of your Heroku app page to get redirected to the unique and secure URL for your app.

With that, your shiny, new, ChatGPT-powered web application is up and running!
Step 6: Scale Down Your App
When you’re done using the app, remember to scale your dynos to zero to prevent incurring unwanted costs.
Conclusion
With all the recent hype surrounding generative AI, many developers are itching to build ChatGPT-powered applications. Working with OpenAI’s API can initially seem daunting, but it’s straightforward. In addition, OpenAI’s function calling feature simplifies your task by accommodating your structured data needs.
When it comes to quick and easy deployment, you can get up and running on Heroku within minutes, for just a few dollars a month. While the demonstration here works specifically with ChatGPT, it’s just as easy to deploy apps that use other foundation models, such as Google Bard, LLaMA from Meta, or other APIs.
Are you ready to take the plunge into building GenAI-based applications? Today is the day. Happy coding!
The post Working with ChatGPT Functions on Heroku appeared first on Heroku.
]]>The post Innovating on Heroku is now more cost-effective appeared first on Heroku.
]]>For Enterprise customers, Basic dynos consume 0.28 dyno units, a notable reduction from the existing minimum consumption of 1 dyno unit with Standard-1X dynos. Basic dynos are the new default dyno type for Common Runtime apps for Enterprise customers. If you’re interested in buying Heroku on an Enterprise contract, reach out to our dedicated account team. If you’re a Premier or Signature support customer, our customer solution architects can help you identify cost optimizations for your implementation using Basic dynos.
Basic Dynos Uses & Features
There’s no change to the features Basic dynos supports. If you’re using a Basic dyno, review and ensure that you aren’t relying on a feature that the Basic dyno doesn’t support.
| Feature | Eco | Basic | Standard-1X | Standard-2X | Performance-M | Performance-L |
|---|---|---|---|---|---|---|
| Deploy with Git or Docker | |
|
|
|
|
|
| Custom Domain Support | |
|
|
|
|
|
| Pipelines | |
|
|
|
|
|
| Automatic OS patching | |
|
|
|
|
|
| Regular and timely updates to language version support | |
|
|
|
|
|
| Free SSL and automated certificate management for TLS certs | |
|
|
|
|
|
| Application metrics | |
|
|
|
|
|
| Heroku Teams | |
|
|
|
|
|
| Horizontal scalability | |
|
|
|
||
| Preboot | |
|
|
|
||
| Language runtime metrics | |
|
|
|
||
| Autoscaling for web dynos | |
|
||||
| Dedicated compute resources | |
|
Conclusion
At Heroku, we want to ensure all our customers can build apps rapidly and cost-effectively, no matter whether you’re a card-paying or Enterprise customer. Enabling Basic dynos for Heroku Enterprise represents a significant stride in that direction.
If you have any thoughts or suggestions on future reliability improvements we can make, check out our public roadmap on GitHub and submit an issue!
The post Innovating on Heroku is now more cost-effective appeared first on Heroku.
]]>If you’re a U.S. AWS Enterprise Discount Program (EDP) customer, starting today, you can buy Dynos , Private Spaces , Heroku Postgres , Heroku Data for Redis® , Apache Kafka on Heroku , and Heroku Connect through…
The post Heroku in AWS Marketplace appeared first on Heroku.
]]>![[Blog] [Product] Heroku in AWS Marketplace](https://www.heroku.com/wp-content/uploads/2025/03/1701128141-Blog-Product-Heroku-in-AWS-Marketplace.png)
If you’re a U.S. AWS Enterprise Discount Program (EDP) customer, starting today, you can buy Dynos, Private Spaces, Heroku Postgres, Heroku Data for Redis®, Apache Kafka on Heroku, and Heroku Connect through AWS Marketplace Private Offers. Get in touch with a Heroku sales representative and let them know you’re interested in buying Heroku through AWS.
Heroku is joined in AWS Marketplace by Salesforce Data Cloud, Service Cloud, Sales Cloud, Industry Clouds, Tableau, MuleSoft and Platform. Read the full announcement on the Salesforce Press Site.
If you’re at re:Invent, drop by the Heroku section of the Salesforce booth at the Venetian Content Hub. You can learn more about Heroku in AWS Marketplace, and about all of our features and products. You can also join Heroku CTO, Gail Frederick, at the database innovation talk on Wednesday at 2:30 p.m (watch now).
To see what else we’re working on, or to suggest enhancements and new features for Heroku, check out our public roadmap on GitHub.
The post Heroku in AWS Marketplace appeared first on Heroku.
]]>Over the past few weeks, we worked on adding pgvector as an extension on Heroku Postgres . We're excited to release this feature, and based on the feedback on our public roadmap , many of you are too. We want to share a bit more about how you can use it and how it may be helpful to you.
All Standard-tier or higher databases running Postgres 15 now support the pgvector extension . You can get started by running CREATE EXTENSION vector; in a client session. Postgres 15 has been…
The post How to Use pgvector for Similarity Search on Heroku Postgres appeared first on Heroku.
]]>Over the past few weeks, we worked on adding pgvector as an extension on Heroku Postgres. We're excited to release this feature, and based on the feedback on our public roadmap, many of you are too. We want to share a bit more about how you can use it and how it may be helpful to you.
All Standard-tier or higher databases running Postgres 15 now support the pgvector extension. You can get started by running CREATE EXTENSION vector; in a client session. Postgres 15 has been the default version on Heroku Postgres since March 2023. If you're on an older version and want to use pgvector, upgrade to Postgres 15.
The extension adds the vector data type to Heroku Postgres along with additional functions to work with it. Vectors are important for working with large language models and other machine learning applications, as the embeddings generated by these models are often output in vector format. Working with vectors lets you implement things like similarity search across these embeddings. See our launch blog for more background into what pgvector is, its significance, and ideas for how to use this new data type.
An Example: Word Vector Similarity Search
To show a simple example of how to generate and save vector data to your Heroku database, I'm using the Wikipedia2Vec pretrained embeddings. However, you can train your own embeddings or use other models providing embeddings via API, like HuggingFace or OpenAI. The model you want to use depends on the type of data you're working with. There are models for tasks like computing sentence similarities, searching large texts, or performing image classification. Wikipedia2Vec uses a Word2vec algorithm to generate vectors for individual words, which maps similar words close to each other in a continuous vector space.
I like animals, so I want to use Wikipedia2Vec to group similar animals. I’m using the vector embeddings of each animal and the distance between them to find animals that are alike.
If I want to get the embedding for a word from Wikipedia2Vec, I need to use a model. I downloaded one from the pretrained embeddings on their website. Then I can use their Python module and the function get_word_vector as follows:
from wikipedia2vec import Wikipedia2Vec
wiki2vec = Wikipedia2Vec.load('enwiki_20180420_100d.pkl')
wiki2vec.get_word_vector('llama')
The output of the vector looks like this:
memmap([-0.15647224,  0.04055957,  0.48439676, -0.22689971, -0.04544162,
        -0.06538601,  0.22609918, -0.26075622, -0.7195759 , -0.24022003,
         0.1050799 , -0.5550985 ,  0.4054564 ,  0.14180332,  0.19856507,
         0.09962048,  0.38372937, -1.1912689 , -0.93939453, -0.28067762,
         0.04410955,  0.43394643, -0.3429818 ,  0.22209083, -0.46317756,
        -0.18109794,  0.2775289 , -0.21939017, -0.27015808,  0.72002393,
        -0.01586861, -0.23480305,  0.365697  ,  0.61743397, -0.07460125,
        -0.10441436, -0.6537417 ,  0.01339269,  0.06189647, -0.17747395,
         0.2669941 , -0.03428648, -0.8533792 , -0.09588563, -0.7616592 ,
        -0.11528812, -0.07127796,  0.28456485, -0.12986512, -0.8063386 ,
        -0.04875885, -0.27353695, -0.32921   , -0.03807172,  0.10544889,
         0.49989182, -0.03783042, -0.37752548, -0.19257008,  0.06255971,
         0.25994852, -0.81092316, -0.15077794,  0.00658835,  0.02033841,
        -0.32411653, -0.03033727, -0.64633304, -0.43443972, -0.30764043,
        -0.11036412,  0.04134453, -0.26934972, -0.0289086 , -0.50319433,
        -0.0204528 , -0.00278326,  0.36589545,  0.5446438 , -0.10852882,
         0.09699931, -0.01168614,  0.08618425, -0.28925297, -0.25445923,
         0.63120073,  0.52186656,  0.3439454 ,  0.6686451 ,  0.1076297 ,
        -0.34688494,  0.05976971, -0.3720558 ,  0.20328045, -0.485623  ,
        -0.2222396 , -0.22480975,  0.4386788 , -0.7506131 ,  0.14270408],
       dtype=float32)
To get your vector data into your database:
- Generate the embeddings.
- Add a column to your database to store your embeddings.
- Save the embeddings to the database.
I already have the embeddings from Wikipedia2Vec, so let’s walk through preparing my database and saving them. When creating a vector column, it's necessary to declare a length for it, so check and see the length of the embedding the model outputs. In my case, the embeddings are 100 numbers long, so I add that column to my table.
CREATE TABLE animals(id serial PRIMARY KEY, name VARCHAR(100), embedding VECTOR(100));
From there, save the items you're interested in to your database. You can do it directly in SQL:
INSERT INTO animals(name, embedding) VALUES ('llama', '[-0.15647223591804504,
…
-0.7506130933761597, 0.1427040845155716]');
But you can also use your favorite programming language along with a Postgres client and a pgvector library. For this example, I used Python, psycopg, and pgvector-python. Here I'm using the pretrained embedding file to generate embeddings for a list of animals I made, valeries-animals.txt, and save them to my database.
import psycopg
from pathlib import Path
from pgvector.psycopg import register_vector
from wikipedia2vec import Wikipedia2Vec
wiki2vec = Wikipedia2Vec.load('enwiki_20180420_100d.pkl')
animals = Path('valeries-animals.txt').read_text().split('n')
with psycopg.connect(DATABASE_URL, sslmode='require', autocommit=True) as conn:
    register_vector(conn)
    cur = conn.cursor()
    for animal in animals:
        cur.execute("INSERT INTO animals(name, embedding) VALUES (%s, %s)", (animal, wiki2vec.get_word_vector(animal)))
Now that I have the embeddings in my database, I can use pgvector's functions to query them. The extension includes functions to calculate Euclidean distance (<->), cosine distance (<=>), and inner product (<#>). You can use all three for calculating similarity between vectors. Which one you use depends on your data as well as your use case.
Here I'm using Euclidean distance to find the five animals closest to a shark:
=> SELECT name FROM animals WHERE name != 'shark' ORDER BY embedding <-> (SELECT embedding FROM animals WHERE name = 'shark') LIMIT 5;
 name
-----------
 crocodile
 dolphin
 whale
 turtle
 alligator
(5 rows)
It works! It's worth noting that the model that we used is based on words appearing together in Wikipedia articles, and different models or source corpuses likely yield different results. The results here are also limited to the hundred or so animals that I added to my database.
pgvector Optimization and Performance Considerations
As you add more vector data to your database, you may notice performance issues or slowness in performing queries. You can index vector data like other columns in Postgres, and pgvector provides a few ways to do so, but there are some important considerations to keep in mind:
- Adding an index causes pgvector to switch to using approximate nearest neighbor search instead of exact nearest neighbor search, possibly causing a difference in query results.
- Indexing functions are based on distance calculations, so create one based on the calculation you plan to rely on the most in your application.
- There are two index types supported, IVFFlat and HNSW. Before you add an IVFFlat index, make sure you have some data in your table for better recall.
Check out the pgvector documentation for more information on indexing and other performance considerations.
Collaborate and Share Your pgvector Projects
Now that pgvector for Heroku Postgres is out in the world, we're really excited to hear what you do with it! One of pgvector's great advantages is that it lets vector data live alongside all the other data you might already have in Postgres. You can add an embedding column to your existing tables and start experimenting. Our launch blog for this feature includes a lot of ideas and possible use cases for how to use this new tool, and I'm sure you can come up with many more. If you have questions, our Support team is available to assist. Don't forget you can share your solutions using the Heroku Button on your repo. If you feel like blogging on your success, tag us on social media and we would love to read about it!
The post How to Use pgvector for Similarity Search on Heroku Postgres appeared first on Heroku.
]]>As part of our commitment to infrastructure modernization, Heroku is making upgrades to the Common Runtime routing layer. The beta release of Router 2.0 is an important step along this journey. We’re excited to give you an inside look at all we’ve been doing to get here.
In both the Common Runtime and Private Spaces , the Heroku router is responsible for serving requests to customers’ web dynos. In 2024, Router 2.0 will replace the existing Common Runtime router. We’re being…
The post Router 2.0: The Road to Beta appeared first on Heroku.
]]>As part of our commitment to infrastructure modernization, Heroku is making upgrades to the Common Runtime routing layer. The beta release of Router 2.0 is an important step along this journey. We’re excited to give you an inside look at all we’ve been doing to get here.
In both the Common Runtime and Private Spaces, the Heroku router is responsible for serving requests to customers’ web dynos. In 2024, Router 2.0 will replace the existing Common Runtime router. We’re being transparent about this project so that you, our customers, are motivated to try out Router 2.0 now, while it’s in beta. As an early adopter, you can help us validate that things are working as they should, particularly for your apps and your use cases. You’ll also be first in line to try out the new features we’re planning to add, like HTTP/2.
Why a New Router?
Now, you may be asking, why build a new router instead of improving the existing one? Our primary motivator has been faster and safer delivery of new routing features for our customers. For a couple of reasons, this has been difficult to achieve with the Common Runtime’s legacy routing layer.
The current Common Runtime router is written in Erlang. It’s built around a custom HTTP server library that supports Heroku-specific features, such as H-codes, dyno sleeping, and router logs. For over 10 years, this router, dubbed “Hermes” internally, has served all requests to Heroku’s Common Runtime. At the time of Hermes’ launch, Erlang was an appropriate choice since the language places emphasis on concurrency, scalability, and fault tolerance. In addition, Erlang offers a powerful process introspection toolchain that has served our networking engineers well when debugging in-memory state issues. Our engineers embraced the language fully, also choosing to write the previous version of our logging system, Logplex, in Erlang.
However, as the years passed, development on the Hermes codebase proved difficult. The popularity of Erlang within Heroku began to taper off. The open-source and internal libraries that Hermes depends on stopped receiving the volume of contributions they once had. Productivity declined due to these factors, making significant router upgrades risky. After a few failed upgrade attempts, our team decided to pin the software versions of relevant Erlang components. This action wasn’t without trade-offs. Being pinned to an old version of Erlang became a blocker to delivering now common-place features like HTTP/2. Thus, we decided to put Hermes into maintenance mode and focus on its replacement.
Choosing a Language
Before kicking off design sessions, our team discussed what broader goals we had for the replacement. In establishing our priorities, the team came to a consensus around three main goals:
- Write the router in a language everyone on our team knows well. With Erlang knowledge limited to just a couple of engineers on the team, we wanted to rewrite the router in a different language. That language had to be something our team already knew well.
- Write the router in a language with a strong open-source community. A robust community unlocks the ability to quickly adopt new specs, write features, fix bugs, and respond to CVEs. It also expands the candidate pool when it comes time to hire new engineers.
- Share as much code as possible between the Common Runtime and Private Spaces routers. Since the Common Runtime and Private Spaces routers share most of the same features, there’s no reason for the codebases to differ much. Additionally, it’s faster and easier to deliver a feature if we only have to write it once.
With these goals in mind, the language to choose for Router 2.0 was clear — Go.
Not only is the Private Spaces router already written in Go, but the language has become our standard choice for developing new components of Heroku’s runtime. This story isn’t at all unique. Many others in the DevOps and cloud hosting world today have chosen Go for its performance, built-in concurrency handling, automatic garbage collection — the list goes on. Simply put, it’s a language designed specifically for building big dynamic distributed systems. Because of these factors, the Go community outside and within Heroku has flourished, with Go expertise in abundance across our runtime engineering teams.
Today, by writing Router 2.0 in Go, we’re creating a piece of software to which everyone on our team can contribute. Furthermore, by doubling down on the language of the Private Spaces router, we unify the source code and routing behavior of these two products. Historically, these codebases have been entirely distinct, meaning that any implementation our engineers introduce must be written twice. To combat this, we’ve extracted the common functionality of the two routers into an internal HTTP library. With a unified codebase, the delivery of features and fixes becomes faster and simpler, reducing the cognitive burden on our engineers who operate and maintain the routers.
Developing the router is only half the story, though. The other half is about introducing this service to the world as safely and seamlessly as possible.
Architecture
You may recall that back in 2021, Heroku announced the completion of an infrastructure upgrade to the Common Runtime that brought customers better performing dynos and lower request latencies. This upgrade involved an extensive migration from our old, “classic” cloud environment to our more performant and secure “sharded” environment. We wanted to complete this migration without disrupting any active traffic or asking customers to change their DNS setups. To do this, our engineers put an L4 reverse proxy in front of Hermes, straddling the classic and sharded environments. The idea was to slowly shift traffic over to the sharded environments, with the L4 proxy splitting connections to both the classic and the new “in-shard” Hermes instances.
Also a part of this migration, TLS termination on custom domains was transitioned from Hermes to the L4 proxy.

This L4 proxy is the component that has formed the basis for Router 2.0. Over the past year, our networking team has been developing an L7 router to sit in-memory behind the L4 proxy. Today, the L4 proxy + Router 2.0 process runs alongside Hermes, communicating over the localhost network on our router instances. Putting these two processes side by side, instead of on separate hosts, means we limit the number of network hops between clients and backend dynos.
The Strangler Pattern
For apps still on the default routing path, client connections are established with the L4 proxy, which directs traffic through Hermes.
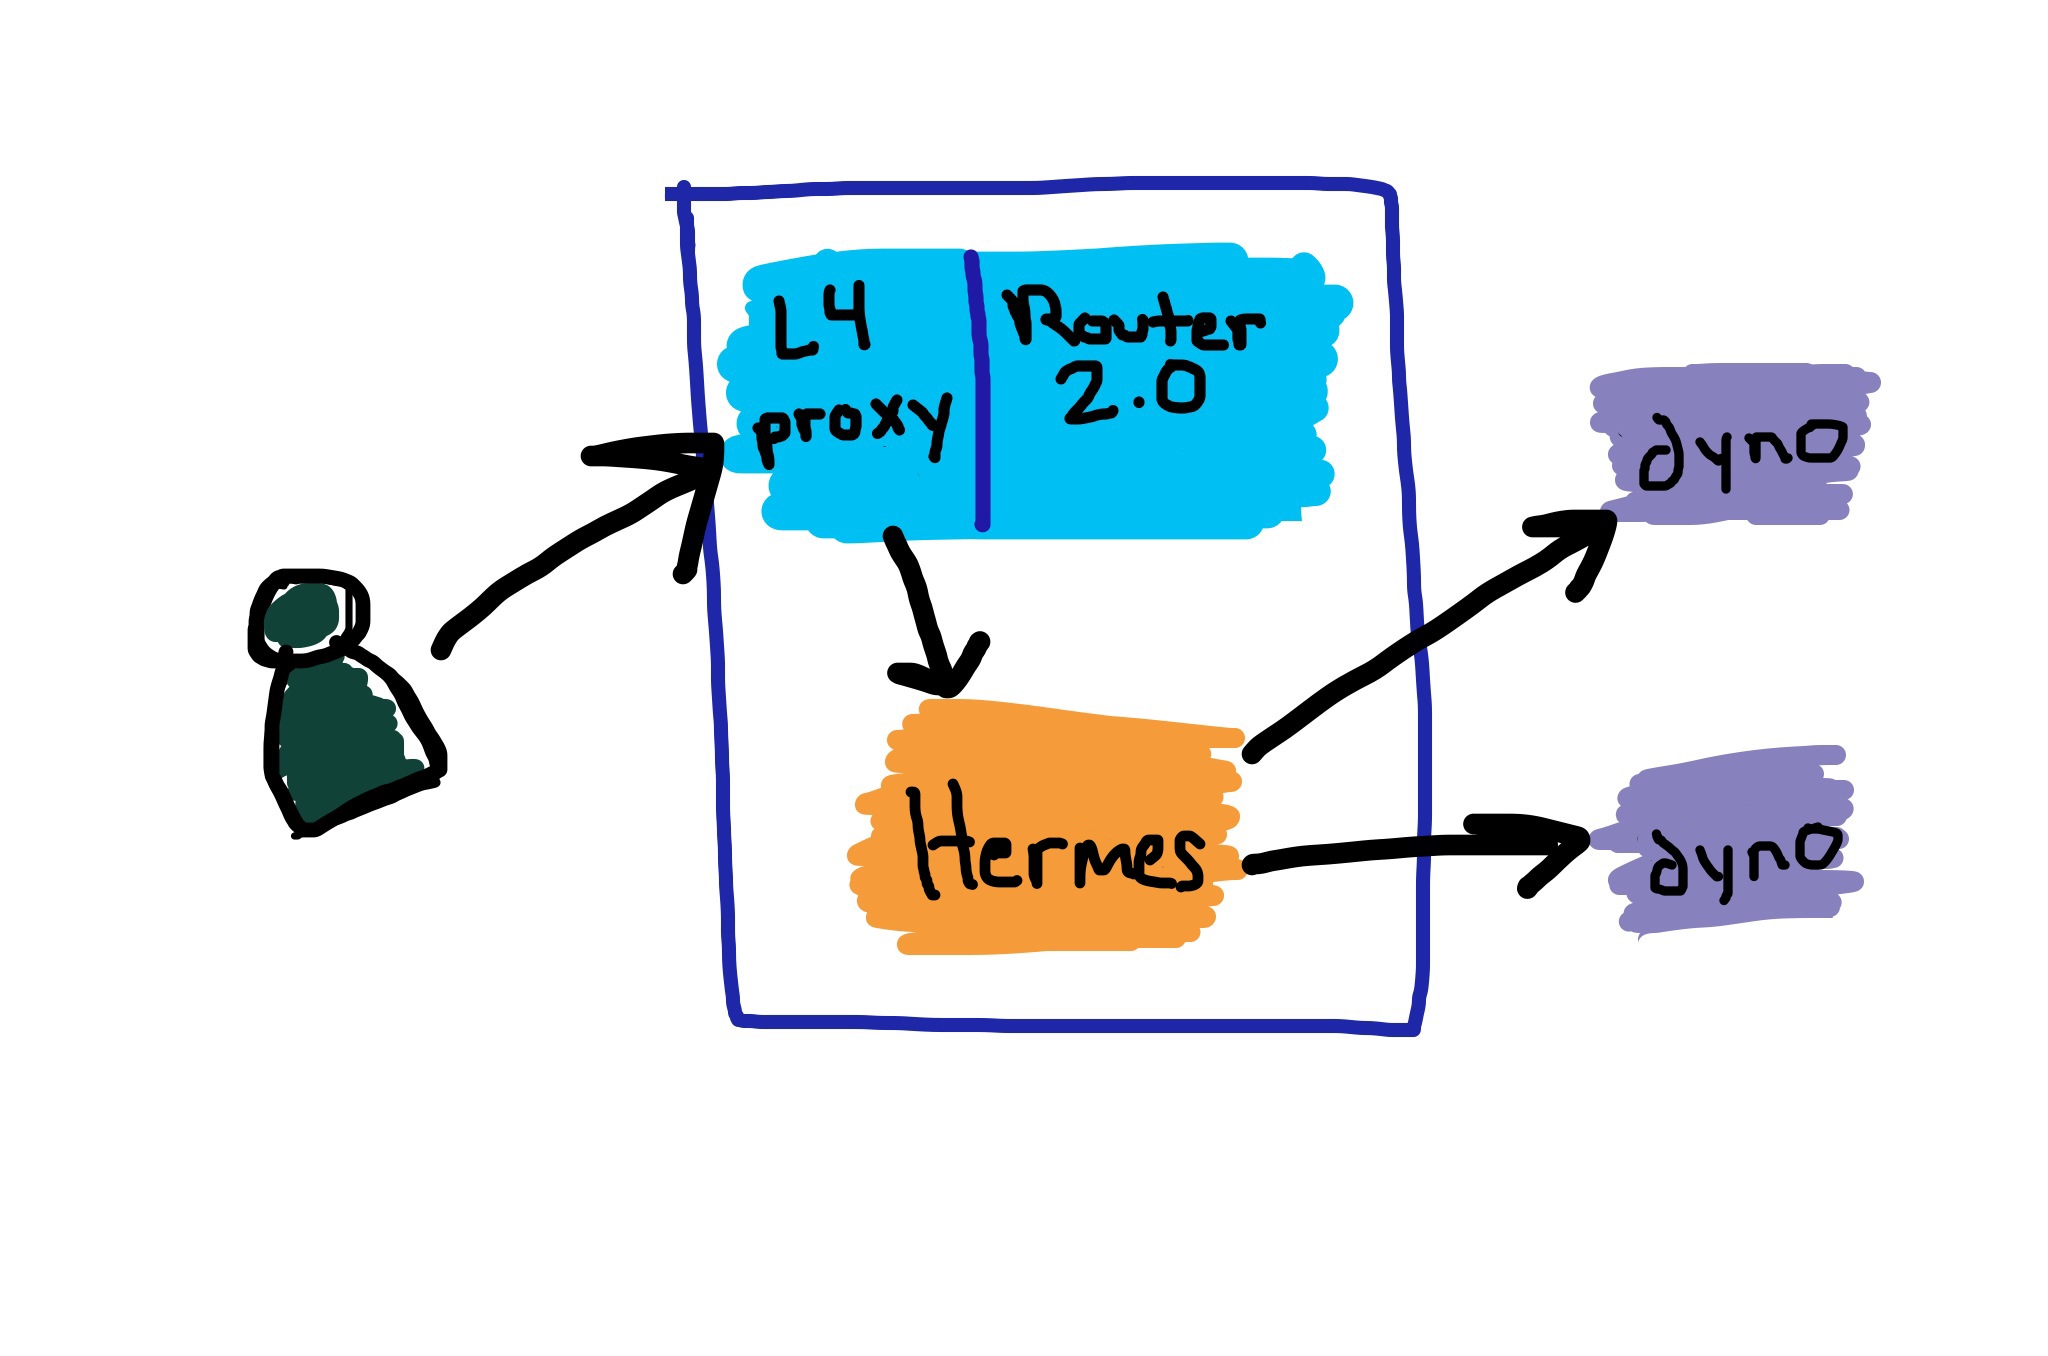
When an app has Router 2.0 enabled, the L4 proxy instead funnels traffic over an in-memory listener to Router 2.0, then out to the app’s web dynos. Hermes is cut out of the network path.

This sort of architecture has a particular name — the “Strangler pattern” — and it involves inserting a form of middleman between clients and the old system you want to replace. The middleman directs traffic, dividing it between the old system and a new system that is built out incrementally. The major advantage of such a setup is that “big bang” changes or “all-at-once” cut-overs are completely avoided. However, both the old and the new systems live on the same production hot path while the development of the new system is in progress. What has this meant for Router 2.0? Well, we had to lay a complete production-ready foundation early on.
Living on the Hot Path
Heroku has always been an opinionated hosting and deployment platform that caters to general use cases. In our products, we optimize for stability while delivering innovation. Within the framing of Router 2.0, this commitment to stability meant we had to do a few things before releasing beta.
Automate Router Deployments
Up until recently, deploying Router 2.0 meant creating a new release and manually triggering router fleet cycles across all our production clouds. This process wasn’t only tedious and time-consuming, but it was also really error prone. We fixed this by building out an automation pipeline, outfitted with gates on availability metrics, performance metrics, and smoke tests. Anytime a router release fails on just one of these health indicators, it doesn’t advance to the next stage of deployment.
Load Test Continuously
An important aspect of vetting the new sharded environments in 2021 was load testing the L4 proxy/Hermes combo. At the time, this was a significant manual undertaking. After manually running these tests, it became obvious that we would need a more practical load testing story while developing Router 2.0. In response, we built a load testing system to continuously push our staging routers to their limits and trigger scaling policies, so that we can also validate our autoscaling setup. This framework has been immensely valuable for Router 2.0 development, catching bugs and regressions before they ever hit production. The results of these load tests feed right back into our deployment pipeline, blocking any deploys that don’t live up to our internal service level objectives.
Introduce Network Error Logging
Traditionally, routing health has been measured through the use of “checkee” apps. These are web-server applications that we deploy across our production Common Runtime clouds and constantly probe from corresponding ”checker“ apps that run in Private Spaces. The checker-checkee duo allows us to mimic and measure our customers’ routing experience. In recent years, the gaps in this model have become more apparent. Namely, our checkees only represent the tiniest fraction of traffic pumping through the router at any given time. In addition, we can’t within our checkers possibly account for all the various client types and configurations that may be used to connect to the platform.
To address the gap, we introduced Network Error Logging (NEL) to both Hermes and Router 2.0. It’s an experimental W3C standard that enables the measurement of routing layer performance by collecting real-time data about network failures from web browsers. Google Chrome, Microsoft Edge, and certain mobile clients already support the spec. NEL ensures our engineers maintain a more holistic understanding of the routing experience actually felt by clients.
The Future
Completely retiring Hermes will take time. We’re only at the end of the beginning of that journey. As detailed in the Dev Center article, Router 2.0 isn’t complete yet because it doesn’t support the full list of features on our HTTP Routing page. We’re working on it. We’ll soon be adding HTTP/2 support, one of the most requested features, to both the Common Runtime and Private Spaces. However, in the Common Runtime, HTTP/2 will only be available when your app is using Router 2.0.
Our aim is to achieve feature parity with Hermes, plus a little more, over the next few months. Once we’re there, we’ll focus on a migration plan that involves flagging apps into Router 2.0 automatically. Much like in the migration from classic environments to sharded environments, we’ll break the process out into phases based on small batches of apps in similar dyno tiers. This approach gives us time to pause between phases and assess the performance of the new system.
Participating
We hope that you, our customers, can help us validate the new router well before it becomes the default. You can enable Router 2.0 for a Common Runtime app, by running:
heroku labs:enable http-routing-2-dot-0 -a <app>
If you choose to enroll, you can submit feedback by commenting on the Heroku Public Roadmap item or creating a support ticket.
Conclusion
Delivering new features to a platform like Heroku is never as simple as flipping an on/off switch. When we deliver something to our customers, there’s always a mountain of behind-the-scenes effort put into it. Simply stated, we write a lot of software to ensure the software that you see works the way it should.
We’re proud of the work we’ve done so far on Router 2.0, and we’re excited for what’s coming next. If you enroll your applications in the beta, keep an eye on the Router 2.0 Dev Center page and the Heroku Changelog. We’ll be posting updates about new features as they become available.
Thanks for reading and happy coding!
The post Router 2.0: The Road to Beta appeared first on Heroku.
]]>The post Enhancing Heroku Postgres with pgvector: Generating AI Insights appeared first on Heroku.
]]>CREATE EXTENSION vector; command in your client session. In this post, we look at how you can use pgvector and its potential applications to enhance your business operations.
Understanding pgvector and Its Significance
Heroku Postgres has evolved well beyond being “just” a relational database. It’s become an adaptable platform enriched with a range of extensions that add new functionalities. Like how we introduced PostGIS for efficient geospatial data handling, we now introduce pgvector, an innovative extension that turns your Heroku Postgres instance into a robust vector database. This enhancement allows you to effectively store vectorized data and execute advanced similarity searches, a capability that can drive innovation in your business.
Complex data can be reduced and represented as vectors. These vectors serve as coordinates in a multi-dimensional space, with hundreds or even thousands of dimensions to represent the data. Datasets that are similar are translated as vectors that are close together, making mathematical similarity calculations simple. For example, characterizing fruits through vectors based on attributes such as color, shape, size, and taste. Vectors that are close to each other share substantial similarities in fruit characteristics, a powerful insight enabled by pgvector.
For AI inference applications, data transformed into its vector representation is called an "embedding". An AI embedding model commonly creates the embeddings. A vector database is a specialized system designed to store these "vectors" or "embeddings". It can quickly find vectors that are close in direction and magnitude across a spectrum of attributes.
Building on this concept, imagine you have a database full of various fruits, each embedded with its unique vector through a machine learning model. Now, let’s say you’re on a quest to find the perfect substitutes for red apples in your fruit salad, with emphasis on their taste and texture. By deploying a vector similarity search, you’ll find alternatives such as green apples and pears, but not fruits like bananas and tomatoes.
Potential Use Cases for pgvector Extension
Using pgvector lets you:
-
Run Prompt Engineering with Retrieval Augmented Generation (RAG): You can populate the database with embedded text segments, such as the latest product documentation for a specific domain, like your business. Given a prompt, RAG can retrieve the most relevant text segments, which are then augmented or “pasted” into the prompt for generative AI. The AI can then generate responses that are both accurate and contextually relevant.
-
Recommend Products: With a vector database containing various attributes, searching for alternatives based on the search criteria is simple. For example in the world of fashion, you can make recommendations based on similar products like dresses or shirts, or match the style and color to offer pants or shoes. You can further extend this with collaborative filtering where the similar preferences of other shoppers enhance the recommendations.
-
Search Salesforce Data: Use Heroku Connect to synchronize Salesforce data into Heroku, then create a new table with the embeddings since Heroku Connect can’t synchronize vector data types. This unlocks a whole new possibility to extend Salesforce like searching for similar support cases with embeddings from Service Cloud cases.
-
Search Multimedia : Search across multimedia contents, like image, audio, and video. You can embed the content directly or work with transcriptions and other attributes to perform your search. For example, generating a music playlist by finding similar tracks based on embedded features like tempo, mood, genre, and lyrics.
-
Categorize and Segment Data: In a variety of fields, from healthcare to manufacturing, data segmentation and categorization are key to successful data analysis. For example, by converting patient records, diagnostic data, or genomic sequences into vectors, you can identify similar cases, aiding in rare disease diagnosis and personalized treatment recommendations.
-
Detect Anomalies: Detect anomalies in your data by comparing vectors that don’t fit the regular pattern. This can be useful in analyzing and detecting problematic or suspicious patterns in areas such as network traffic data, industrial sensor data, transactions data, or online behavior.
For more details on how to actually prepare a database for vector search, look for a post coming soon on our engineering blog!
A Glimpse into the AI Future of Heroku
The pgvector extension adds a whole new dimension to Heroku Postgres. We hope this post was helpful in sparking your interest to start experimenting with vector databases. This introduction to pgvector marks the first step in our journey towards AI-enabled offerings on Heroku. We plan on unveiling much more in the near future, so stay tuned for upcoming innovations that we hope will continue to transform how you build and deploy applications.
We extend our appreciation to the community for their support in advocating for the significance of pgvector. Your engagement has played a vital role in prioritizing this addition to Heroku Postgres. If you have questions, challenges, or require assistance, our dedicated Support team is available to assist you on your journey into this exciting new frontier.
The post Enhancing Heroku Postgres with pgvector: Generating AI Insights appeared first on Heroku.
]]>Since we introduced this program in April 2023 , we’ve made significant strides to enhance our product offerings and engage more effectively with you. Here’s a glimpse of the impact we’ve achieved together in…
The post Heroku User Research Program: A Catalyst for Collaboration and Growth appeared first on Heroku.
]]>
Your Participation Matters
Since we introduced this program in April 2023, we’ve made significant strides to enhance our product offerings and engage more effectively with you. Here’s a glimpse of the impact we’ve achieved together in just six months:
- 60+ in-depth interviews with unique customers
- Three large-scale UX studies
- A series of workshops and feedback sessions at TrailblazerDX and Dreamforce
- Direct impact and influence on our public roadmap based on your feedback
Outcomes of Customer Collaboration
This program enhanced how we include your feedback in both product development and planning. Your feedback led to platform improvements such as:
Your feedback also helped prioritize possible future work, such as:
- New regions for Common Runtime
- Official support for .NET on Heroku
- Support for HTTP/2
- Support for pgvector to Heroku Postgres
While there's no guarantee that we'll complete open roadmap items, continuous customer feedback helps us prioritize the most impactful work.
Join Our User Research Program Today
Signing up is easy! Simply fill out the form, and we’ll keep you informed about upcoming research opportunities. Your voice makes a difference, which is why we invite all current, former, and prospective customers to sign up and participate.
We’re committed to creating a more collaborative relationship with our customers, where your insights and experiences drive our innovations. Your participation in the Heroku User Research Program is a crucial step toward this shared goal.
In conclusion, the Heroku User Research Program is a catalyst for collaboration and growth. We continue to achieve remarkable outcomes thanks to your valuable insights and contributions. Don't miss the opportunity to interact with us by visiting our public roadmap, submitting your ideas, or commenting on others' suggestions. We look forward to working with you to create products that not only meet, but exceed your expectations.
Thank you for being a valued member of the Heroku community. Let’s shape the future of Heroku together!
The post Heroku User Research Program: A Catalyst for Collaboration and Growth appeared first on Heroku.
]]>In May 2023, we announced our limited release of two new Heroku Private Spaces regions: India (Mumbai) and Canada (Montreal). This month, we’re announcing the full general availability of those two regions, along with new Heroku Private Spaces regions for the United Kingdom (London) and Singapore. This expansion enables customers to maintain greater control over where their data is stored and processed. These four new regions fully support Heroku Private Spaces , Heroku Shield Private Spaces , Heroku Postgres , Apache Kafka on Heroku , Heroku Data for Redis , Heroku Connect , and most Heroku Add-ons…
The post Global Expansion for Heroku Private Spaces: Canada, India, Singapore, and the United Kingdom appeared first on Heroku.
]]>
In May 2023, we announced our limited release of two new Heroku Private Spaces regions: India (Mumbai) and Canada (Montreal). This month, we’re announcing the full general availability of those two regions, along with new Heroku Private Spaces regions for the United Kingdom (London) and Singapore. This expansion enables customers to maintain greater control over where their data is stored and processed. These four new regions fully support Heroku Private Spaces, Heroku Shield Private Spaces, Heroku Postgres, Apache Kafka on Heroku, Heroku Data for Redis, Heroku Connect, and most Heroku Add-ons.
Private Spaces provide a dedicated virtual network environment for running Heroku applications. They are now supported in the following regions, with the new regions highlighted in bold:
| name | location |
|---|---|
| dublin | Dublin, Ireland |
| frankfurt | Frankfurt, Germany |
| oregon | Oregon, United States |
| sydney | Sydney, Australia |
| tokyo | Tokyo, Japan |
| virginia | Virginia, United States |
| mumbai | Mumbai, India |
| montreal | Montreal, Canada |
| london | London, United Kingdom |
| singapore | Singapore |
Why is Heroku Expanding Its Platform to New Regions?
Heroku Private Spaces let you deploy and run apps in network-isolated environments for improved security and resource isolation. With Private Spaces in these four new regions, we can now serve more customers who want greater control over where their data is processed and stored.
Having more Private Spaces regions can also improve performance. By running apps in specific regions, customers can reduce latency and improve speed and reliability. This capability is especially beneficial for apps that serve users in different regions, providing a better experience for end users. In addition, all new regions utilize three availability zones as announced earlier this year. With the combination of these releases, Private Spaces are even more performant and reliable for our customers.
What’s Our Regional Expansion Strategy?
We carefully considered several factors when deciding which new regions to support for Private Spaces.
Our main goal is to give Heroku customers more options to effectively address their data governance challenges. With the growing number of data sovereignty regulations and privacy laws, our customers value a foundation of trust when handling their data and that of their end users.
Additionally, we analyzed the geographical distribution of our customer base. This assessment revealed a greater need in the Asia-Pacific (APAC) region, and different requirements between our current Europe (Frankfurt and Dublin) Private Spaces customers and those in the UK.
Lastly, we took into account the valuable input from our community via the GitHub public roadmap. This feedback played a pivotal role in shaping our decisions.
Going forward, we will continue researching what it takes to further our expansion efforts and continue to build off the (now!) 10 regions we support. Among other roadmap items, you can follow our progress on deciding where to bring Heroku next on the public roadmap item.
How Do I Access the New Regions?
The new regions are now part of our core Heroku Private Spaces offering. To use Private Spaces in a new region, follow the normal steps for space creation from the Heroku Dashboard, or use the CLI with the --region flag:
$ heroku spaces:create my-space-name --team my-team-name --region london
Creating space my-space-name in team my-team-name... done
=== my-space-name
Team:   my-team-name
Region: london
State:  allocating
See the Heroku Dev Center for more details about creating or migrating a Private Space.
Conclusion
We’re excited to add new Private Spaces regions for customers who want to improve app performance and have more control over their data and infrastructure. We look forward to releasing more features that expand the Heroku platform and serve more customers.
If you have any further feedback, feature requests, or suggestions, check out the Heroku public roadmap on GitHub to join the conversation.
Disclosure: Any unreleased services or features referenced in this or other posts or public statements are not currently available and may not be delivered on time or at all. Customers who purchase Salesforce applications should make their purchase decisions based upon features that are currently available. For more information please visit www.salesforce.com, or call 1-800-667-6389.
The post Global Expansion for Heroku Private Spaces: Canada, India, Singapore, and the United Kingdom appeared first on Heroku.
]]>Heroku is entering a new phase of investment, and as a part of this initiative, we are opening up new positions for individuals who would like to join us in driving this effort. Our goal is to expand our offerings across the platform, catering to both our customers and ecosystem partners.
Our mission remains clear: we aim to assist developers in creating their best…
The post Join us for a New Chapter of Growth and Innovation appeared first on Heroku.
]]>
Focused Growth and Progress
Heroku is entering a new phase of investment, and as a part of this initiative, we are opening up new positions for individuals who would like to join us in driving this effort. Our goal is to expand our offerings across the platform, catering to both our customers and ecosystem partners.
Our mission remains clear: we aim to assist developers in creating their best code yet, enabling them to build more substantial and AI-enabled applications. Similarly, for our partners, we're dedicated to supporting the creation of tightly integrated experiences. We're also committed to enhancing integrations, particularly with regards to Salesforce, which seamlessly connects Heroku Dynos with CRM data.
Heroku DX streamlines application development and deployment, and our intention is to deliver the same value in incorporating AI within customer applications. Additionally, while Heroku provides managed application support, we recognize that AI can elevate the Heroku DX experience further, aiding developers in refining their application code and effectively managing resources and optimization strategies. This is just a glimpse of what we have planned; our public roadmap reflects our collaborative journey.
Exploring New Opportunities with Heroku
We're in search of talented individuals to join our product, engineering, and operations teams. We're interested in individuals with expertise in AI, DX, Tooling, Data, Operational Excellence, Operations, and more. Whether you're a skilled developer, a strategic engineering manager, or a detail-oriented operator, there's a place for you in our journey.
Feel free to share your thoughts and referrals with us directly on LinkedIn. Are you prepared to contribute to how Heroku is shaping the technology landscape? This is just the beginning, so make sure to regularly visit our careers page to explore the diverse array of open roles and find your next career move.
The post Join us for a New Chapter of Growth and Innovation appeared first on Heroku.
]]> Your account will no longer be charged the $10 monthly fee for Heroku CI .
Your account will no longer be charged the $10 monthly fee for Heroku Teams with over five members.
We've improved our pricing page to include hourly expenses alongside the maximum monthly costs.
Why is the Heroku pricing page changing? The Heroku team is simplifying pricing for clarity and a better customer…
The post Heroku CI and Heroku Teams Now Free for Card Paying Customers appeared first on Heroku.
]]>- Your account will no longer be charged the $10 monthly fee for Heroku CI.
- Your account will no longer be charged the $10 monthly fee for Heroku Teams with over five members.
- We’ve improved our pricing page to include hourly expenses alongside the maximum monthly costs.
Why is the Heroku pricing page changing? The Heroku team is simplifying pricing for clarity and a better customer experience.
What about Heroku Enterprise customers? Heroku CI has always been included, and the creation and maintenance of teams with fewer than 25 members has always been — and remains — free for Heroku Enterprise customers.
Scale App Testing and Delivery with Heroku CI Pipelines
Heroku CI integrates with any Heroku Pipeline effortlessly, executing your app’s test suite automatically with each push to the linked GitHub repository. Enabling this feature is simple: just activate it within the Settings tab of your pipeline.
Starting September 1, 2023 we will no longer charge the $10 monthly fee for Heroku CI Pipelines for card paying customers. But remember, even though we’re removing the cost for Heroku CI pipelines, you’ll still see charges for any dyno and add-on use during the test run – which is still charged on a prorated basis, down to the second.
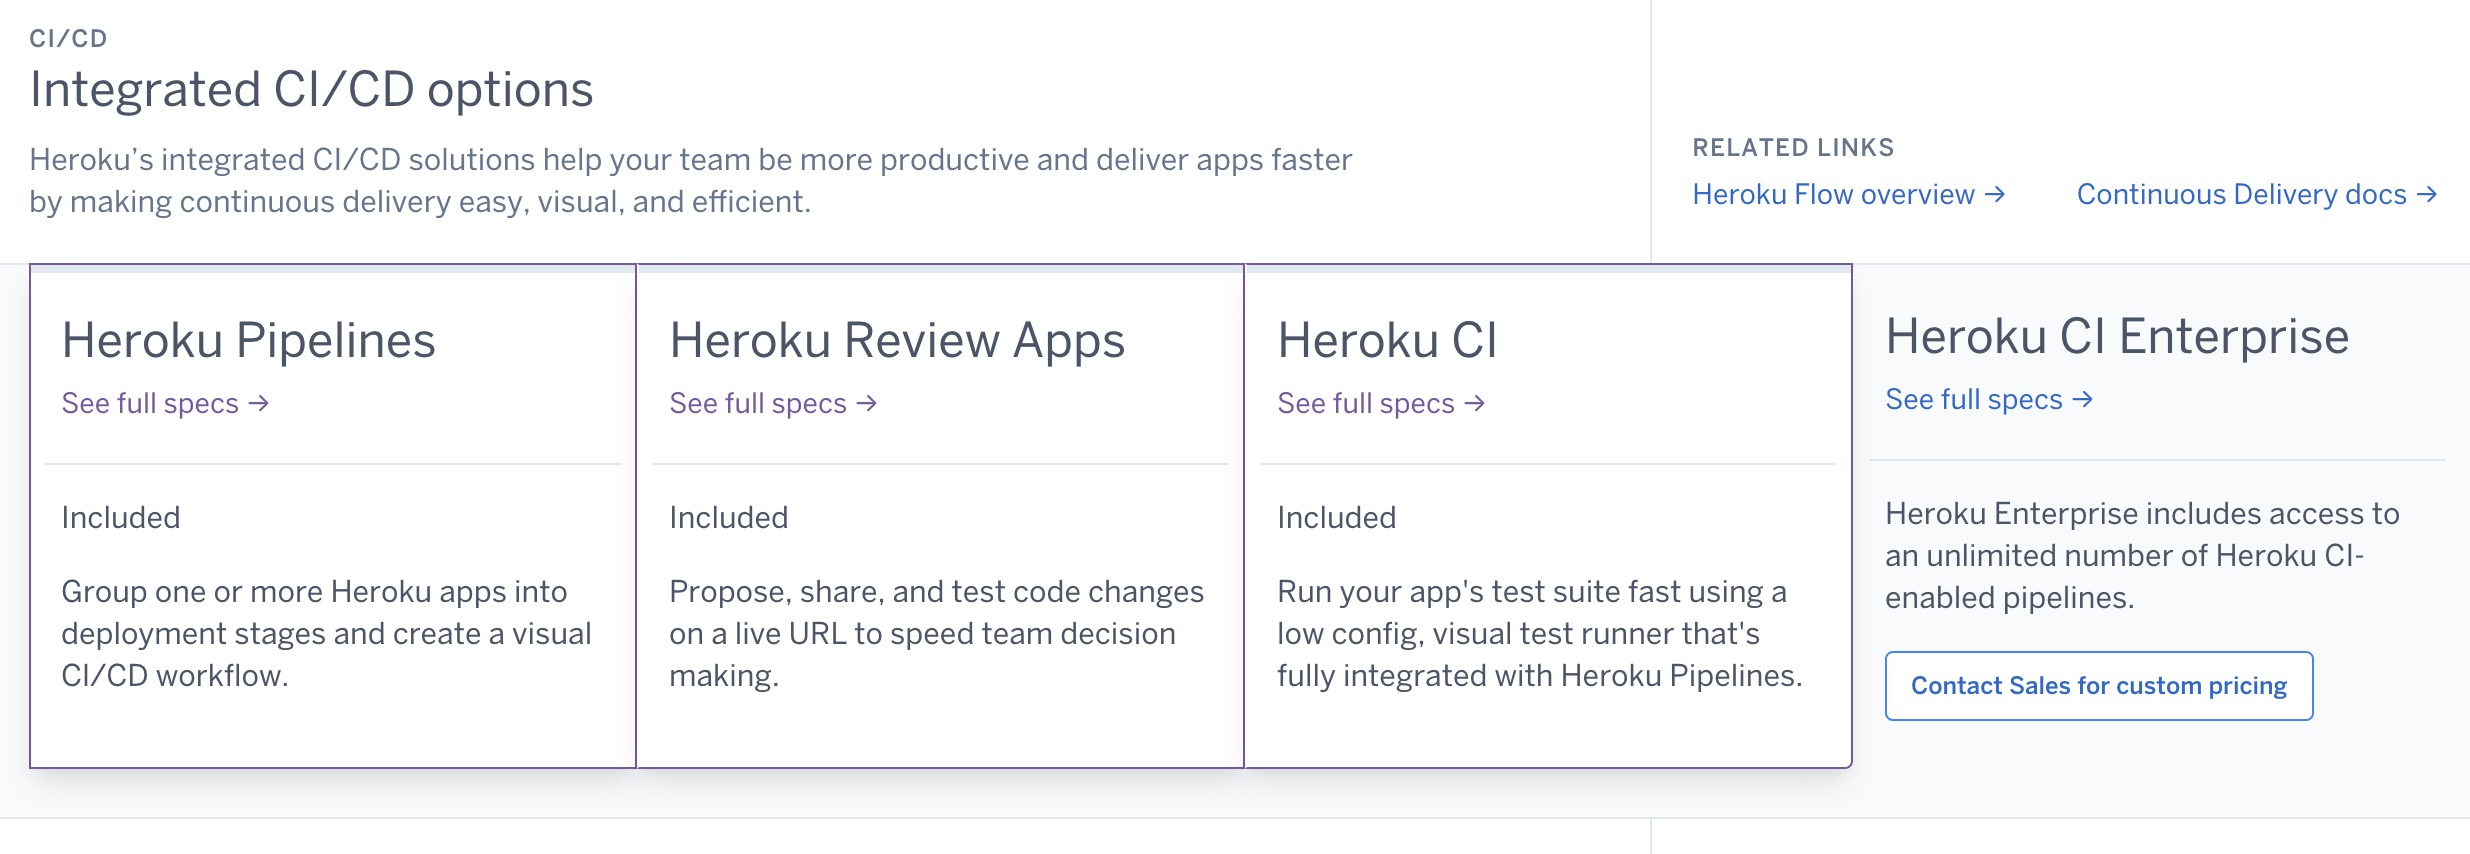
Invite Your Entire Team — No Additional Fee
Here at Heroku, we’ve been providing free access to teams with up to five members all along. Starting September 1, 2023 we’re taking it a step further by waving goodbye to the $10 monthly fee that card paying customers had for bigger teams. Now, within your Heroku account, you can create up to five teams, each accommodating a maximum of 25 members. If you need more teams, or you need to manage access to teams, you can always consider upgrading to a Heroku Enterprise plan. It’s all about giving you more flexibility and options to partner with developers and make magic happen on Heroku.

Improved Cost Transparency
The Heroku community has given us valuable feedback about our pricing on our public roadmap, and we’re happy to close out the roadmap item for these changes. To clear up any confusion about our hourly rates, we’ve made updates to our pricing pages and the Heroku CLI. Now, we not only display the maximum monthly charge, but also the cost per hour, prorated to the second. The only exception is our Eco Dynos, which give you 1,000 dyno hours for a flat fee of $5/month.
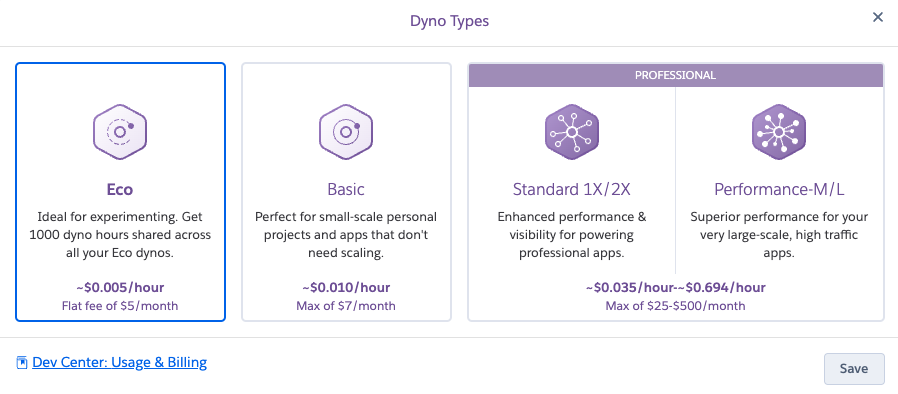
Heroku Listens to Customer Feedback
We continue to invest in Heroku to bring more value to our customers. We’ve expanded Private Spaces to Montreal and Mumbai (with plans to make London and Singapore available starting August 31, 2023) and re-enabled card payments in India. In addition to our pricing transparency above, we have also recently introduced new Heroku Postgres plans. Customer satisfaction continues to be a top priority for Heroku, and we look forward to continuing to deliver new features and functionality moving forward.
The post Heroku CI and Heroku Teams Now Free for Card Paying Customers appeared first on Heroku.
]]>From the engagement on our public roadmap , we know that there are many developers in India eager to get back on the platform. We want to address the work done to re-enable this functionality, and why Heroku stopped accepting payments from India in the first place.
We started by enabling 3D Secure (3DS) on our platform. 3D Secure is a protocol that prompts a user to use a dynamic authentication methods such…
The post Heroku Card Payments Are Back in India appeared first on Heroku.
]]>From the engagement on our public roadmap, we know that there are many developers in India eager to get back on the platform. We want to address the work done to re-enable this functionality, and why Heroku stopped accepting payments from India in the first place.
We started by enabling 3D Secure (3DS) on our platform. 3D Secure is a protocol that prompts a user to use a dynamic authentication methods such as biometrics or token-based authentication to confirm their purchases.

3D Secure is the additional factor of authentication that establishes e-mandates now required by the Reserve Bank of India. An e-mandate is a form of authorization provided by cardholders to issuing banks that grants permission for collecting recurring payments. For Heroku, e-mandates allow us to charge the payment method on file for our Indian customers while the user is off-session, as they are not on our website when their card is charged.
It’s important to call out that while most e-mandate webhooks are returned quickly, in some cases it can take up to 30 minutes. Because Heroku users can’t provision resources until their payment method is verified, we built out a series of email and Heroku Dashboard notifications. These notifications ensure that users are alerted as soon as their card is verified or if they need to take an action.

Heroku Adopts RBI Regulations
On October 1, 2021, new Reserve Bank of India (RBI) regulations came into effect. These new rules stated that automatic, off-session recurring payments using India-issued credit cards now require an e-mandate via an additional factor of authentication, for example, 3D Secure. For Heroku, enabling 3DS allows us to charge the payment method on file for Indian customers while the user is off-session.
Due to the unexpected administrative and technical burdens associated with complying with this unique mandate, Heroku had to make the tough decision to temporarily suspend the acceptance of India-issued debit and credit cards for Heroku customers.
We want to acknowledge the most common feedback we have received from our customers with respect to this change: “This is taking too long!” They’re right, and we completely agree. The solution was not as simple as just enabling this functionality in a dashboard or with a few lines of code. We did the work to support 3DS and establish e-mandates for our users which took time. Getting it right was important to us, and had to be done before we could bring back our Indian customers.
In addition to adopting the RBI regulations, utilizing 3DS also allows us to meet the Strong Customer Authentication (SCA) requirements in Europe. We already rolled out 3DS support to all EU, UK, and Australian customers on our platform. We will continue to monitor this rollout and expand the security 3DS provides to our customers in additional countries.
Trust in Heroku
We are so grateful to our customers for their patience with us throughout this process. With the re-launch of payments from our Indian customers, as well as the recent expansion of Private Spaces to Mumbai, our customers can trust that Heroku continues to keep their privacy, safety, and security needs a top priority.
The post Heroku Card Payments Are Back in India appeared first on Heroku.
]]>Subdomain reuse, also known as subdomain takeover, is a security vulnerability that occurs when an attacker claims and takes control of a target domain. Typically, this happens when an application is deprecated and an attacker directs residual traffic to a host that they control.
As of 14 June 2023, we changed the format of the built-in herokuapp.com domain for Heroku apps. This change improves the security of the platform by preventing subdomain reuse. The new format is <app-name>-<random-identifier>.herokuapp.com. Previously, the format was <app-name>.herokuapp.com. The new format for built-in herokuapp.com domains is on by default…
The post Security Improvement: Subdomain Reuse Mitigation appeared first on Heroku.
]]>Subdomain reuse, also known as subdomain takeover, is a security vulnerability that occurs when an attacker claims and takes control of a target domain. Typically, this happens when an application is deprecated and an attacker directs residual traffic to a host that they control.
As of 14 June 2023, we changed the format of the built-in herokuapp.com domain for Heroku apps. This change improves the security of the platform by preventing subdomain reuse. The new format is <app-name>-<random-identifier>.herokuapp.com. Previously, the format was <app-name>.herokuapp.com. The new format for built-in herokuapp.com domains is on by default for all users.
Why It's Important
When you delete a Heroku application, its globally unique name immediately becomes available to other users. Previously, the app name was the same as the app’s herokuapp.com subdomain, which serves as the default hostname for the application.
With subdomain takeovers, attackers can search the Internet for Heroku application names that are no longer in use. They can create new apps using the freed-up names with the hope that some party still directs traffic to the application. An attacker can also create an app at that URL to intercept the traffic and provide their own content.
A successful subdomain takeover can lead to a wide variety of other potential attack vectors. The attacker who impersonates the original owner can then attempt any of the following attacks.
Stealing cookies
It’s common for web apps to expose session cookies. An attacker can use the compromised subdomain to impersonate a website formerly registered to an app. This impersonation can permit an attacker to harvest cookies from unsuspecting users who visit and interact with the rogue webpage(s).
Phishing
Using a legitimate subdomain name makes it easier for phishers to leverage the former domain name to lure unsuspecting victims.
OAuth Allowlisting
The OAuth flow has an allowlisting mechanism that specifies which callback URIs to accept. A compromised subdomain that is still allowlisted can redirect users during the OAuth flow. This redirection can leak their OAuth token.
The new format prevents these vulnerabilities because — even if an attacker creates an app with a freed-up name — the subdomain of the app now has a random identifier appended.
We always recommend using a custom domain for any kind of production or security-sensitive app. However, with this change, even customers that use default herokuapp.com domain names can do so safely. If those apps are deleted later, the built-in default domains can’t be taken over.
Nothing needs to be set on your account to enable this. The new format for built-in herokuapp.com domains is on by default for all users.
Conclusion
Over the years, we improved the safety of domain management on Heroku to prevent domain hijacks and similar attacks. For example, we removed the <appname>.heroku.com redirects and introduced random CNAME targets.
The introduction of a new format for herokuapp.com domains, which includes a random identifier appended to the subdomain, mitigates the risk of subdomain takeovers. This change prevents attackers from easily impersonating the original app URL and intercepting traffic meant for the deprecated or deleted app. Best of all, there’s no action required on your part to enable this protection.
The post Security Improvement: Subdomain Reuse Mitigation appeared first on Heroku.
]]>We’re pleased to announce a change to the Heroku Postgres extension experience. You can once again install Heroku Postgres extensions in the public schema or any other!
Previously, in response to incident…
The post Improving the Heroku Postgres Extension Experience appeared first on Heroku.
]]>We’re pleased to announce a change to the Heroku Postgres extension experience. You can once again install Heroku Postgres extensions in the public schema or any other!
Previously, in response to incident 2450, we required all PostgreSQL extensions to be installed to a new schema: heroku_ext. We’ve listened to our customers, who let us know that this change broke many workflows. We’ve been focusing our recent engineering efforts on restoring the previous functionality. Our goal is to offer our users more flexibility and a more familiar Postgres experience. With this release, we are closing the public roadmap item.
At the moment, installing extensions on schemas other than heroku_ext is an opt-in configuration. We plan on making this the default at a later date. Note that this feature is available for non-Essential-tier databases.
Enable any schema
To enable any schema on new databases, you simply pass the --allow-extensions-on-public-schema flag at provisioning. You can also use the Heroku Data Labs feature to enable any schema on existing databases. Any forks or followers you create against that database will automatically have this support enabled.
To enable any schema for new add-ons:
$ heroku addons:create heroku-postgresql:standard-0 --allow-extensions-on-any-schema
To enable any schema for existing add-ons (this may take up to 15 minutes to apply):
$ heroku data:labs:enable extensions-on-any-schema --addon DATABASE_URL
Once either of these steps are complete, you can verify extensions are installed to public. To do this, first install a new extension:
demo::DATABASE => CREATE EXTENSION address_standardizer;
Then check the output of dx, which is a command in PostgreSQL to view all installed extensions. The Schema value for address_standardizer will be set to public.
         Name         | Version |   Schema
----------------------+---------+------------
 plpgsql              | 1.0     | pg_catalog
 pg_stat_statements   | 1.10    | heroku_ext
 address_standardizer | 3.3.3   | public
(3 rows)
Previously, Postgres extensions were installed to heroku_ext by default. After enabling this support, extensions install to the first schema in your search_path, which in most cases is public.
Enabling the feature does not change existing extensions or anything about your database structure. If an extension is already installed to heroku_ext, it remains there unless you relocate it to another schema. You can reinstall or relocate your extension to any schema you want after enabling the Heroku Data Labs feature. Once enabled, extensions going forward will have their types and functions go to their appropriate schemas (usually public) and nothing new will be added to heroku_ext.
Verify your apps
If your application code assumes extensions will always be in heroku_ext, this change could potentially impact loading your database schema into new add-ons for review apps or developer setups. The following steps ensure your apps continue to work after this change is made:
- Check your code for hard-coded references to
heroku_extand remove them. - Ensure your automated tests pass and all tables, indexes, views, etc. load correctly into a local database with
heroku_extremoved. - Provision a new app with a Postgres database using either of the methods listed above.
- Deploy your code and run through some test workflows to ensure no errors.
- Update your code accordingly.
Timing
This behavior will be the default for all Heroku Postgres add-ons in three phases:
- July 10th, 2023: The
extensions-on-any-schemaHeroku Data Labs feature became the default on new Heroku Postgres add-ons. - July 24th, 2023: All Essential tier databases will be updated to permit extensions to be installed to any schema.
- August 7th, 2023: We enable extensions-on-any-schema on existing Heroku Postgres add-ons and retire the Labs feature.
You can test for issues by enabling the feature using Heroku Data Labs before July 10th, or by creating a new database after that date. If you have any concerns about how this change can impact your existing database, make sure to verify your database before August 7th, 2023.
We want to hear from you
Heroku’s mission is to provide customers with a great platform and take the headache out of running your apps in the cloud. We prioritize keeping your data, and our platform, safe above all else. As we say at Salesforce, Trust is our #1 value.
We value your feedback and never want to make changes that harm the customer experience. After we made the initial change with the heroku_ext schema, we listened to users like Justin Searls, who made this comment in his blog post:
"[It’s] disappointing that this change rolled out without much in the way of change management. No e-mail announcement. No migration tool. No monkey patches baked into their buildpacks."
We agree. Unforeseen situations can arise which force difficult decisions. Although the user experience took a backseat in the short term, we worked hard to restore the seamless Heroku Postgres experience you’d expect without compromising on security. We always welcome feedback and never stop looking for ways to make your experience as great as we safely can.
Thanks to all of you for your continued support over the years. Some really exciting things are in the pipeline, and we can’t wait to show them to you. In case you don’t already know, we maintain a public roadmap on GitHub and encourage you to comment on planned enhancements and offer suggestions.
The post Improving the Heroku Postgres Extension Experience appeared first on Heroku.
]]>We released new Heroku Postgres plans that give you more flexibility when scaling up your database storage needs on Heroku. We heard from our customers that they want to be able to upgrade disk space without adding other resources like vCPU or memory. In response, we created new L and XL plans with increased disk limits for premium , private , and…
The post Introducing New Heroku Postgres Plans appeared first on Heroku.
]]>We released new Heroku Postgres plans that give you more flexibility when scaling up your database storage needs on Heroku. We heard from our customers that they want to be able to upgrade disk space without adding other resources like vCPU or memory. In response, we created new L and XL plans with increased disk limits for premium , private , and shield tiers at the -6 and -9 levels.
These new plans continue to have the same compute, memory, and IOPS characteristics as other plans on the same level. With these changes, our largest database plan now has a 6TB disk limit instead of 4TB. As long as the workload stays fairly constant, you can upgrade to private-l-9 for 5TB or private-xl-9 for 6TB of disk, for example.
This table summarizes the new offerings as of today. You can always check the latest technical information on our Dev Center page. You can find pricing info in the Elements Marketplace.
| Plan Name | Provisioning Name | vCPU | Memory (GB) | IOPS | Disk (TB) | Existing or New |
|---|---|---|---|---|---|---|
| Premium-6 | premium-6 | 16 | 122 | 6000 | 1.5 | Existing |
| Premium-L-6 | premium-l-6 | 16 | 122 | 6000 | 2 | New |
| Premium-XL-6 | premium-xl-6 | 16 | 122 | 6000 | 3 | New |
| Premium-9 | premium-9 | 96 | 768 | 16000 | 4 | Existing |
| Premium-L-9 | premium-l-9 | 96 | 768 | 16000 | 5 | New |
| Premium-XL-9 | premium-xl-9 | 96 | 768 | 16000 | 6 | New |
| Private-6 | private-6 | 16 | 122 | 6000 | 1.5 | Existing |
| Private-L-6 | private-l-6 | 16 | 122 | 6000 | 2 | New |
| Private-XL-6 | private-xl-6 | 16 | 122 | 6000 | 3 | New |
| Private-9 | private-9 | 96 | 768 | 16000 | 4 | Existing |
| Private-L-9 | private-l-9 | 96 | 768 | 16000 | 5 | New |
| Private-XL-9 | private-xl-9 | 96 | 768 | 16000 | 6 | New |
| Shield-6 | shield-6 | 16 | 122 | 6000 | 1.5 | Existing |
| Shield-L-6 | shield-l-6 | 16 | 122 | 6000 | 2 | New |
| Shield-XL-6 | shield-xl-6 | 16 | 122 | 6000 | 3 | New |
| Shield-9 | shield-9 | 96 | 768 | 16000 | 4 | Existing |
| Shield-L-9 | shield-l-9 | 96 | 768 | 16000 | 5 | New |
| Shield-XL-9 | shield-xl-9 | 96 | 768 | 16000 | 6 | New |
You can provision a database on a new plan with the same command used for existing plans:
heroku addons:create heroku-postgresql:private-l-6
Or to upgrade an existing database to a new plan:
heroku addons:upgrade heroku-postgresql:private-l-9
Why Did We Do This?
We had strong engagement and community support to prioritize this feature on our roadmap. We want to highlight how important our public roadmap is for us and how seriously we take suggestions. You too can create a feature request on the public roadmap GitHub page, so please share what you would like to see on Heroku or what pain points you faced!
Where We Are Headed
Our public roadmap isn’t only the place to share your thoughts, but it’s a great place to see what we’re working on and where we are headed. There are many exciting products and features in development with the Heroku Data team that you may find useful. For example, increasing the connection limits on Postgres, adding additional Private Space regions (and their respective data products), and improving disk performance on lower-level plans (i.e. -0 through -4). In the long run, we aim to provide even more flexibility by offering “grow on demand” elastic data services to match your database needs.
Although we expect some changes to roadmap items as we make progress, you can be assured that we’re actively dedicated to the future of the Heroku platform and its data products.
Disclosure: Any unreleased services or features referenced in this or other posts or public statements are not currently available and may not be delivered on time or at all. Customers who purchase Salesforce applications should make their purchase decisions based upon features that are currently available. For more information please visit www.salesforce.com, or call 1-800-667-6389.
The post Introducing New Heroku Postgres Plans appeared first on Heroku.
]]>What are availability zones and how…
The post Heroku Adds Third Availability Zone for Private Spaces appeared first on Heroku.
]]>
What are availability zones and how does Heroku use them?
All AWS regions have multiple availability zones. An availability zone is an isolated location within a region. Each has its own redundant and separate power, networking, and connectivity to reduce the likelihood of multiple zones failing simultaneously. One or more physical data centers back each zone.
Previously, Heroku Private Spaces spread dynos over only two availability zones. When Private Spaces launched, many AWS regions only had two availability zones, so that was the lowest common denominator we settled on. All AWS regions now have three availability zones, and Heroku takes full advantage of that.
Why did we make this change?
In the case of an AWS availability zone issue, Heroku automatically rebalances your application’s dynos and associated data resources to an alternative zone to prevent downtime. In July 2022, AWS experienced an outage that ultimately impacted two availability zones, and some Heroku Private Spaces apps were degraded as a result. We added a third availability zone to ensure that Heroku Private Spaces apps can better withstand future infrastructure incidents and provide the best experience for our customers and their users.
What should I know about this change?
Now that the change has rolled out to all Private Spaces customers, there’s no action required and no additional costs to start utilizing the third availability zone. There are also no changes to the way you deploy apps in Private Spaces.
Prior to the addition of a third availability zone, Heroku published four stable outbound IP addresses for each space. Only two were used to connect your Private Space to the public internet, while the other two were held in reserve for product enhancements, such as the addition of a third availability zone. With the change to three availability zones, a third address is now used to allow outbound connections from your dyno in the third availability zone. We’re still holding the fourth address in reserve. You can see the stable outbound IPs in the Network tab on your Heroku Dashboard or with the CLI:
heroku spaces:info --space example-space
Conclusion
We’re committed to providing our customers with the best possible computing and data platform. The addition of a third availability zone is just one of the ways that we’re delivering on the promises outlined in the blog last summer. We believe a focus on mission-critical features is instrumental to helping our customers achieve greater business value and an increased return on investment from Heroku. You can read about it in this Total Economic Impact of Salesforce Heroku report.
If you have any feedback, feature requests, or suggestions, check out the Heroku public roadmap on GitHub to join the conversation about the future Heroku roadmap.
For more information about this change, see the Heroku Help site for details on Privates Spaces and Availability Zones.
The post Heroku Adds Third Availability Zone for Private Spaces appeared first on Heroku.
]]>Private Spaces provide a dedicated and virtual network environment for running Heroku applications. They are now supported in the following regions, with new regions highlighted in bold below:
name
location
dublin
Dublin,…
The post Heroku Private Spaces Expand to Mumbai and Montreal appeared first on Heroku.
]]>Private Spaces provide a dedicated and virtual network environment for running Heroku applications. They are now supported in the following regions, with new regions highlighted in bold below:
| name | location |
|---|---|
| dublin | Dublin, Ireland |
| frankfurt | Frankfurt, Germany |
| oregon | Oregon, United States |
| sydney | Sydney, Australia |
| tokyo | Tokyo, Japan |
| virginia | Virginia, United States |
| mumbai | Mumbai, India |
| montreal | Montreal, Canada |
We plan to make these two new regions generally available to all Heroku Enterprise customers later this year. Initially, only customers participating in the Limited Release program (see details below) will be able to create Private Spaces in Mumbai and Montreal.
See below for more details on participating in the limited release, or read the Dev Center article on the limited release. For more details on specifying specific regions when creating a Private Space, please reference the Dev Center article on Heroku Private Spaces.
What's a Limited Release?
A limited release is a controlled introduction of a new product to ensure a smooth and consistent customer experience. To ensure a seamless rollout, Heroku has decided to gradually introduce these two new regions — Mumbai and Montreal — to specific customer cohorts. Private Spaces in these new regions will include the same product features as all the other regions that Heroku supports. Access to the new regions is limited to make sure that we can match demand with available resources in the newer regions and ensure the customer experience is at parity with existing Private Spaces regions.
To provision a Private Space in either Mumbai or Montreal, you must be a current Heroku Private Spaces customer and you must be accepted into the Limited Release program. You can begin the onboarding process by filing a support ticket requesting access. More information about the program can be found in this Dev Center article.
Why is Heroku Expanding Its Platform to New Regions?
Heroku Private Spaces lets you deploy and run apps in network-isolated environments for improved security and resource isolation. With Private Spaces in Mumbai and Montreal, we can now serve more customers who want greater control over where their data is processed and stored.
Another benefit of additional Private Spaces regions is improved performance. By running applications in specific geographic regions, customers can reduce latency and improve the speed and reliability of their applications. This is especially useful for customers with Heroku apps that serve users in different regions, as it allows those apps to provide a better user experience to their customers.
Ultimately, adding these two new regions will enable us to better serve our Indian and Canadian customers.
Conclusion
We are excited to expand Private Spaces to new regions for our customers who are looking for additional control over their data and infrastructure and who want to improve the performance of their applications. We look forward to releasing more features that will continue to expand the Heroku platform and serve more customers. Alongside this change, we are working to unblock Heroku Online India customers by supporting RBI-compliant recurring payments. Also, we are researching new pricing models for Heroku Private Spaces.
If you have any further feedback, feature requests, or suggestions, check out the Heroku public roadmap on GitHub to join the conversation.
Disclosure: Any unreleased services or features referenced in this or other posts or public statements are not currently available and may not be delivered on time or at all. Customers who purchase Salesforce applications should make their purchase decisions based upon features that are currently available. For more information please visit www.salesforce.com, or call 1-800-667-6389.
The post Heroku Private Spaces Expand to Mumbai and Montreal appeared first on Heroku.
]]>The Heroku Common Runtime is one of the best parts of Heroku. It’s the modern embodiment of the principle of computing resource time-sharing pioneered by John McCarthy and later by UNIX, which evolved into the underpinnings of much of modern-day cloud computing. Because Common Runtime resources are safely shared between customers, we can offer dynos very efficiently, participate in the GitHub Student Program , and run the Heroku Open…
The post More Predictable Shared Dyno Performance appeared first on Heroku.
]]>The Heroku Common Runtime is one of the best parts of Heroku. It’s the modern embodiment of the principle of computing resource time-sharing pioneered by John McCarthy and later by UNIX, which evolved into the underpinnings of much of modern-day cloud computing. Because Common Runtime resources are safely shared between customers, we can offer dynos very efficiently, participate in the GitHub Student Program, and run the Heroku Open Source Credit Program.
We previously allowed individual dynos to burst their CPU use relatively freely as long as capacity was available. This is in the spirit of time-sharing and improves overall resource utilization by allowing some dynos to burst while others are dormant or waiting on I/O.
Liberal bursting has worked well over the years and most customers got excellent CPU performance at a fair price. Some customers using shared dynos occasionally reported degraded performance, however, typically due to “noisy neighbors”: other dynos on the same instance that, because of misconfiguration or malice, used much more than their fair share of the shared resources. This would manifest as random spikes in request response times or even H12 timeouts.
To help address the problem of noisy neighbors, over the past year Heroku has quietly rolled out improved resource isolation for shared dyno types to ensure more stable and predictable access to CPU resources. Dynos can still burst CPU use, but not as much as before. While less flexible, this will mean fairer and more predictable access to the shared resources backing eco, basic, standard-1X, and standard-2X Dynos. We’re not changing how many dynos run on each instance, we’re only ensuring more predictable and fair access to resources. Also note that Performance, Private, and Shield type Dynos are not affected because they run on dedicated instances.
Want to see what we’re working on next or suggest improvements for Heroku? Check out our roadmap on GitHub! Curious to learn about all the other recent enhancements we’ve made to Heroku? Check out the ‘22 roundup and Q1 ’23 News blog posts.
The post More Predictable Shared Dyno Performance appeared first on Heroku.
]]>If you are new to Heroku, great! Your new database defaults to Postgres 15. If you already have a Heroku Postgres database on an older version, we make the upgrade process simple. And if you are still on one…
The post Announcing PostgreSQL 15 on Heroku appeared first on Heroku.
]]>If you are new to Heroku, great! Your new database defaults to Postgres 15. If you already have a Heroku Postgres database on an older version, we make the upgrade process simple. And if you are still on one of the deprecated versions, such as 9.6 and 10, we urge you to upgrade off of them as soon as possible. We strongly recommend using the latest versions of the software for better performance and security. We keep up with the latest developments and actively support its current versions to make it easy for you to do the same.
Postgres 15 comes with notable performance improvements, as well as new features. You can also review the official documentation, as well docs for Postgres 14 and 13. Meanwhile, our engineering team has curated a short summary of some of the key Postgres 15 features below for you.
Performance Improvements
Sorting Improvements
Sorting functionality is an essential part of Postgres query execution, especially when you use queries like ORDER BY, GROUP BY, and UNION. With Postgres 15, single-column sorting gets a huge boost in performance by switching from tuple-sort to datum-sort. It also has better memory management while sorting which avoids rounding up memory allocation for tuples. This means that unbounded queries use less memory, avoid disk spills, and have better performance. The creators also switched from the polyphase merge algorithm to the k-way merge algorithm. Overall, sorting improvements have up to 400% performance gain.
DISTINCT runs in parallel
To remove duplicate rows from the result, you can use the DISTINCT clause in the SELECT statement, which is a standard operation in SQL. With Postgres 15, you can now perform the operation in parallel instead of doing so in a single process.
Nothing looks different here:
SELECT DISTINCT * FROM table_name;
However, you can adjust the number of workers by changing the value of the max_parallel_workers_per_gather parameter. The expected performance gain can be significant, but it depends on factors such as table size, if an index scan was used, and workload vs. available CPU. This is a welcomed addition to the family of operations that can leverage parallelization, which has been the trend since Postgres 9.6.
Window Function for Performance Gains
Window functions are built into Postgres and it’s similar to an aggregate function, but it avoids grouping the rows into a single output row. They become especially handy when you are trying to analyze the data for reporting. With Postgres 15, you should see performance improvements on the following window functions: row_number(), rank(), dense_rank(), and count().
New Features
Introducing MERGE
A long-awaited command, MERGE, is now available on Postgres 15. From the documentation, “MERGE lets you write conditional SQL statements that can include INSERT, UPDATE, and DELETE actions within a single statement.“ This is the command on Postgres that essentially allows you to “upsert” based on condition, so you no longer need to come up with a workaround using INSERT with ON CONFLICT.
Regular Expressions Enhancement
New functions were added to work with more regular expression patterns. The following four regular expressions were added to Postgres 15: regexp_count(), regexp_instr(), regexp_like(), and regexp_substr(). They all work differently for their own use cases, but here’s an example to perform a count using Postgres 15:
SELECT regexp_count(song_lyric, ‘train’, ‘ig’);
Instead of this example in previous versions:
SELECT count(*) FROM regexp_matches(song_lyric, ‘train’, ‘ig’);
The examples result in the count of how many times the word “train” was mentioned in song lyric(s).
Summary
Postgres 15 brings many benefits to developers. Heroku continues to add value by providing a fully managed service with an array of additional features, giving developers maximum focus on building amazing applications. Please do not hesitate to contact us through our Support team if you encounter issues. As always, we welcome your feedback and suggestions on the Heroku public roadmap.
The post Announcing PostgreSQL 15 on Heroku appeared first on Heroku.
]]>Feedback: What is Heroku investing in? What has shipped?
We had a very busy 2022! We just published the product retrospective for last year here .
You’ve given us really positive feedback on the openness of our public roadmap , and many customers have told us they love it. Our top voted ideas…
The post Heroku Feedback and News – Q1 Edition appeared first on Heroku.
]]>
Feedback: What is Heroku investing in? What has shipped?
We had a very busy 2022! We just published the product retrospective for last year here.
You’ve given us really positive feedback on the openness of our public roadmap, and many customers have told us they love it. Our top voted ideas around more fine grained security features, GitHub integration and larger compute and data plans are now integral to our roadmap planning. We will continue to use and refine this. Thank you so much for all the engagement.
Feedback: Clarify Account Suspension Policy
We’ve heard customer concerns about our account suspension policy for acceptable use violations. Our policy is that we do not suspend paying customers without giving them recourse, humans are in the loop, and we do not delete accounts, apps, or data when we suspend a customer for violations of terms of service, pending resolution of the suspension. However, we will continue to terminate dynos running apps that violate our terms of use, as we have a commitment to our customers to keep everyone safe.
For clarity and as a reminder to customers currently on Postgres v9.6, if no action is taken by February 25, 2023, we will begin revoking access to databases running PostgreSQL 9.6. Non-compliant databases are subject to deletion in accordance with our customer agreements. It is critical to your safety to move off of versions of Postgres that are out of community support which includes security patching. For more information refer to this article.
Feedback: Improve Status Postings
We’ve heard that our status postings at status.heroku.com could be more actionable and useful. You should expect to see more helpful and actionable information when we make posts there. However, this comes with a tradeoff: we will take the time and care to ensure we understand the potential impacts to customers and to give actionable guidance. We are also going to reach out to customers directly via email when we have smaller numbers of customers impacted so that the impacted customers know more concretely that they are affected, and customers that are not affected are not wondering if they are impacted when they are not.
Feedback: Please Help Open Source Projects
Heroku is built on open source, and home to a wide range of open source applications. We want to give back by providing free capabilities for qualifying open source projects. We are announcing a Heroku credits program for open source projects starting in March 2023. The program grants a platform credit every month for 12 months to selected projects. Credits are applicable to any Heroku product, including Heroku Dynos, Heroku Postgres, and Heroku Data for Redis®; and cannot be applied to paid third-party Heroku add-ons. An application process is open now, with applications reviewed monthly starting in March 2023. We have more info here on how to apply, as well as the terms and conditions of the program.
Please keep talking to us….
As always, if you want to send me a gift of feedback directly, you can find me here. If you prefer to use Twitter, please DM to Andy Fawcett (@andyinthecloud, https://www.linkedin.com/in/andyfawcett/) who runs Heroku product, or Gail Frederick (@screaminggeek, https://www.linkedin.com/in/gfred/) who runs Heroku engineering. The Heroku team will be at TDX in March, we hope to see some of you in person there. Last but not least, we are excited to open invites to join our Heroku customer research program to help shape the future of our platform. As a participant, you’ll have a direct impact on our roadmap and help us build better solutions for you and our community.
-Bob Wise
The post Heroku Feedback and News – Q1 Edition appeared first on Heroku.
]]>As part of our commitment to increase transparency, the Heroku roadmap went live on GitHub in August 2022. The public roadmap has grown with the participation of many of our customers. Thank you for engaging with us about the future…
The post Heroku 2022 Roundup appeared first on Heroku.
]]>
Public Roadmap
As part of our commitment to increase transparency, the Heroku roadmap went live on GitHub in August 2022. The public roadmap has grown with the participation of many of our customers. Thank you for engaging with us about the future of Heroku. We want to hear from you! Today, we have approximately 70 active roadmap cards, most of which have an assigned product owner. We have 24 cards in-flight and have shipped 28 projects. Please continue to contribute and share your ideas. The roadmap is your direct line to Heroku.
Focus on Mission-Critical Stability
At Salesforce and Heroku, Trust is our #1 value. To us, trust means being transparent with you about the security incident in April 2022 that affected Heroku and our customers. After taking necessary remediation steps to bring Heroku back to a stable state, we committed to invest in Heroku to improve resilience and strengthen our security posture. We did invest, are investing, and will continue to invest in operational stability in order to maintain your trust. Here is a sampling of our 2022 highlights in this area:
- Adopting a data deletion program
- Improved internal access restrictions
- Infrastructure availability and hardening
- Credential handling improvements
- Observability improvements
- Partner and vendor changes
As part of operational stability, we instituted an inactive account data deletion program. Customers who go a year or more without logging into their Heroku account and are not on any paid plans will receive a notification giving them 30 days to log in to prevent their account’s deletion. Prior to launching this program, millions of stale Heroku accounts and apps were no longer in use, but we were still keeping the lights on, which came with a cost. Deleting inactive accounts also reduces the risks associated with storing our customer’s data, which sometimes includes personal data and other data customers want to keep private. This change allows us to better maintain effective data hygiene practices and safeguard our customers’ data so it doesn’t sit online indefinitely. It also aligns with Salesforce’s commitment to data minimization and other important global privacy principles.
Mission-critical changes for Heroku are always added to our changelog.
Ending Free Plans
In 2022, ending our free plans was an intentional change to focus Heroku on mission-critical availability for our paid customers. We ended our free plans for Heroku Dynos, Heroku Postgres, and Heroku Data for Redis®. We completed this work in December 2022. We understand that adapting to this change wasn’t easy for many of you and there was work required for you to accommodate the low-cost plans into your development cycles. We appreciate your support and loyalty during this transition.
We know that we affected many users of our platform with this change. We want Heroku to stay available for free to students and learners, so we partnered with GitHub to add free Heroku to their Student Developer Pack. We want to give back to the open source community, so we are announcing a Heroku free credits program for qualifying open source projects starting in March 2023.
New Low-Cost Plans – Eco and Mini
Based on your feedback, Heroku introduced new, lower-cost options for dyno and data plans in November 2022. We announced our new Eco Dynos plan, which costs $5 for 1,000 compute hours a month, shared across all of your eco dynos. We are calling these dynos “Eco“ because they sleep after 30 minutes of no web traffic. They only consume hours when active, so they are economical for you.
To match our new Eco Dynos plan, we also introduced low-cost data plans. We announced new Mini plans for Heroku Postgres (10K rows, $5/month) and Heroku Data for Redis® (25 MB, $3/month). You can find complete pricing details for these plans and others at https://www.heroku.com/pricing.
Improvements to Heroku Data
To help our customers who manage data resources in both Heroku and AWS, we provide additional flexibility with the ability to connect AWS VPCs to your Postgres PgBouncer connection pools and manage them using PrivateLink.
Heroku Data Labs CLI, an extension of the Heroku Data client plugin, debuted with two features that allow you to make configuration changes to your Heroku Postgres add-ons. You can now enable or disable WAL Compression and Enhanced Certificates. Previously, you could only enable these features by opening a ticket with Heroku Support.
MFA Enforced for Heroku
On the security side, Salesforce began requiring multi-factor authentication (MFA) in February 2022. Heroku gave its customers time to adopt this new authentication standard and to opt-in when ready. After nearly a year, Heroku is now enforcing MFA for all its customers.
On their own, usernames and passwords no longer provide sufficient protection against cyberattacks. MFA is one of the simplest, most effective ways to prevent unauthorized account access and safeguard your data and your customers’ data. We now require all Heroku customers to enable MFA.
Heroku Joins GitHub Student Program
We realize that Heroku’s free plans were essential to learners. In October 2022, we announced a new partnership with GitHub, which adds Heroku to the GitHub Student Developer Pack. Heroku gives students a credit of $13 USD per month for 12 months. Students can apply this credit to any Heroku product offering, except third-party Heroku add-ons. To date, we’re supporting over 17,000 students on Heroku through the program.
This is an exciting first step as we explore additional program options that include easier access and longer availability to support student developer growth and learning on the Heroku platform. We are also working on a longer-term solution for educators to support a cohesive classroom experience.
For additional questions about the Heroku for GitHub Students program, see our program FAQ.
Supporting Open Source Projects
Heroku is built on open source, and home to a wide range of open source applications. We want to give back by providing free capabilities for qualifying open source projects. We are announcing a Heroku credits program for open source projects. The program grants a platform credit every month for 12 months to selected projects. Credits are applicable to any Heroku product, including Heroku Dynos, Heroku Postgres, and Heroku Data for Redis®; and cannot be applied to paid third-party Heroku add-ons. An application process is open now, with applications reviewed monthly. We have more info here on how to apply, as well as the terms and conditions of the program.
Nightscout
Over 20,000 Nightscout users with diabetes or parents of a child with diabetes choose Heroku to host their Nightscout application that enables remote monitoring of blood glucose levels and insulin dosing/treatment data. Most of these apps were hosted in Heroku free plans. Prior to ending our free plans, we partnered with Nightscout to ensure a smooth transition for all their users, including posting an advisory with instructions on how to continue using this vital service. To further solidify our long-standing relationship and stand alongside an organization that provides critical health information, Salesforce made a corporate donation to Nightscout.
Add-on Providers
Heroku partners enjoy easier management of their add-ons using our latest Add-on Partner API v3. Partners can obtain a full list of apps where your add-on is installed by using a new endpoint. Previously, partners needed to use the Legacy Add-on Partner App Info API, as requests made to Platform API for Partners are scoped to a single add-on resource linked to the authorization token on the request.
We also announced the general availability of Webhooks for Add-ons. All partners can use Webhooks for their add-ons to subscribe to notifications relating to their apps, domains, builds, releases, attachments, dynos, and more. This can now be done without logging a ticket to request access to this feature.
Continuing our Focus and Delivery
We are energized by our focus as your mission-critical hosting provider. Heroku is just getting started on our operational stability and security improvements, and you’ll also see us deliver innovations in 2023. We will continue to keep you informed about the important changes ahead for the Heroku platform. We will continue to post feature briefs on the latest Heroku updates our customers love.
We really want to hear from you, our customers. Join us at TrailblazerDX for more about all the things we are delivering. We invite you to engage with us on our public roadmap to share your feedback, feature requests, and suggestions. Thank you for your loyalty and trust in Heroku.
The post Heroku 2022 Roundup appeared first on Heroku.
]]>For customers paying by credit or debit card, the Eco dynos and Mini data plans are free until November 30th, 2022. While our free dyno and data plans will no longer be available starting November 28th, 2022, you can upgrade to our new plans early, without extra cost. You begin accruing charges for these plans on December 1st, 2022.
To make the…
The post Eco and Mini Plans Now Generally Available appeared first on Heroku.
]]>For customers paying by credit or debit card, the Eco dynos and Mini data plans are free until November 30th, 2022. While our free dyno and data plans will no longer be available starting November 28th, 2022, you can upgrade to our new plans early, without extra cost. You begin accruing charges for these plans on December 1st, 2022.
To make the upgrade from free to paid plans easier, we’ve launched a new tool in the Heroku Dashboard. You can quickly see your free resources and choose the ones you want to upgrade. Visit our Knowledge Base for instructions on using the upgrade tool.

Subscribing to Eco automatically converts your free dynos for all your apps to Eco, along with any Scheduler jobs that were using free dynos. When our free plans end, any Heroku Scheduler jobs that use free dynos will fail. You must reconfigure any existing Scheduler jobs that use free dynos to use another dyno type.
For Heroku Enterprise accounts, we will automatically convert your free databases to the Mini plan starting November 28th, 2022. No action is required. You can contact your account executive with any questions.
We have a robust set of frequently asked questions about these new plans. We’ve also published a new Optimizing Resource Costs article with guidance on the most cost-efficient use of Heroku resources.
If you have any questions, feel free to reach out via a support ticket, so we can help get you answers. As always, we welcome feedback and ideas for improvement on the Heroku public roadmap.
The post Eco and Mini Plans Now Generally Available appeared first on Heroku.
]]>heroku data:labs features are experimental beta features . Upon its release, you can enable and disable two features, and we plan to add more in the future. The initial features are: WAL Compression - Write-Ahead Log (WAL) compression is a feature of Postgres databases that shrinks the…
The post Announcing Heroku Data Labs CLI appeared first on Heroku.
]]>heroku data:labs, an extension of the Heroku Data client plugin. This plugin allows you to make configuration changes to your Heroku Postgres addons. Previously, you could only enable these features by opening a ticket with Heroku Support. With heroku data:labs, you’ll save time by turning these features on and off yourself.
heroku data:labs features are experimental beta features. Upon its release, you can enable and disable two features, and we plan to add more in the future. The initial features are:
- WAL Compression – Write-Ahead Log (WAL) compression is a feature of Postgres databases that shrinks the size of write-ahead logs in your Postgres database. This compression trades off I/O load on your database for increased CPU load. The benefit of WAL compression on your database is dependent on a variety of factors including how your database is used, the amount of used disk space, and if your database has followers. Make sure to monitor your database to understand if WAL compression is right for you.
- Enhanced Certificates – Enhanced Certificates is a feature of Postgres databases that provides protection against man-middle-attacks and eavesdropping by using SSL-secured connections. The Enhanced Certificates feature enables the SSL mode of
verify-full, which ensures that data is encrypted and server connections are made between trusted and verified entities. Enhanced Certificates provide many benefits for your Heroku Postgres add-ons.
You can easily enable an experimental feature by using the heroku data:labs:enable command
 $ heroku data:labs:enable wal-compression -a example-app --addon=ADDON_NAME
 $ heroku data:labs:enable enhanced-certificates -a example-app --addon=ADDON_NAME
Similarly, you can disable the feature on your Heroku add-on using the heroku data:labs:disable command
  $heroku data:labs:disable wal-compression -a example-app --addon=ADDON_NAME
  $ heroku data:labs:disable enhanced-certificates -a example-app --addon=ADDON_NAME
You can read more about this feature in our documentation here. If you have any questions or concerns about this feature, feel free to reach out and also engage with us on our roadmap website.
Happy coding!
The post Announcing Heroku Data Labs CLI appeared first on Heroku.
]]>We are hiring for both product and engineering, from developers to engineering managers working across our product suite, including Runtime, API, DX, and our Data products. Additionally, we have opened roles in our Research, TPM, Documentation, and Product Management teams. Check out all our open roles .
Our public roadmap continues to evolve, and I am delighted to…
The post Heroku is Hiring! appeared first on Heroku.
]]>We are hiring for both product and engineering, from developers to engineering managers working across our product suite, including Runtime, API, DX, and our Data products. Additionally, we have opened roles in our Research, TPM, Documentation, and Product Management teams. Check out all our open roles.
Our public roadmap continues to evolve, and I am delighted to see significant customer engagement there. Please do come participate with us there in the open. With the introduction of our recent low-cost plans and student program, we continue to listen and incorporate your feedback.
As always, you can also offer me comments and any referrals directly. Thank you!
The post Heroku is Hiring! appeared first on Heroku.
]]>One of the things I value about being a Salesforce employee is our commitment to community. We support education through giving , mentoring, and many other programs .
That commitment extends through our work on Heroku. Heroku is a powerful way to enter the Salesforce ecosystem, and we are proud of the number of students who have used the Heroku platform to build their careers.
GitHub Partnership
…
The post Heroku Partners with GitHub to Offer Student Developer Program appeared first on Heroku.
]]>One of the things I value about being a Salesforce employee is our commitment to community. We support education through giving, mentoring, and many other programs.
That commitment extends through our work on Heroku. Heroku is a powerful way to enter the Salesforce ecosystem, and we are proud of the number of students who have used the Heroku platform to build their careers.
GitHub Partnership
Today, we are announcing a new partnership with GitHub, which adds Heroku to their Student Developer Pack and gives students a credit of $13 USD per month for 12 months. This credit can be applied to any Heroku product offering, except for third-party Heroku Add-ons.
There's no substitute for hands-on experience, but for most students, real-world tools can be cost-prohibitive. That's why GitHub launched GitHub Education in 2014 to provide the education community with free access to the tools and events they need to shape the next generation of software development.
Through the Student Developer Pack, we will offer our students a credit of $13 USD per month for 12 months*. This credit can be applied to any Heroku product offering, including our new Eco Dynos, Mini Postgres, and Mini Heroku Data for Redis® plans. The $13 USD will cover the monthly cost of Eco dyno hours and one instance each of Mini Postgres and Mini Heroku Data for Redis®, or it can be used towards any Heroku Dynos and Heroku Add-on plans (except for third-party add-ons).
To sign up for the student program:
- Individuals applying for the offering must sign up for a Heroku account. If you already have an account, log in with your Heroku credentials.
- The Student Developer Pack is available for all verified students ages 13+, and anywhere in the world where GitHub is available. In order to use Heroku products, students must be 18 years of age. You can join at https://www.heroku.com/github-students/signup which prompts you to verify your GitHub Student status with your academic email address. Only current registrants at qualifying institutions will be approved.
- If the domain is questionable, or the school does not provide academic email, GitHub requires supporting documentation of current student status, such as a dated student ID or course registration for the current semester.
- After validating your student status, verify your Heroku account by providing a valid credit or debit card and verifying your billing information.
- After submitting billing and credit card information, your platform credits will be applied monthly per the program terms ($13/mo for 12 months*).
In addition to this new student program, we are actively working on a more inclusive, long-term Heroku solution to better support educational use cases. We are hoping to launch this for educators before the next school year.
For additional questions about the Heroku for GitHub Students program, please see our program FAQ.
Share Your Feedback
We are grateful to our community members for taking the time to interact with us on our new Heroku Roadmap. The Heroku product and engineering teams are excited to engage more deeply on areas we are researching or delivering soon, as well as thoughts on what we have recently delivered.
Please stop by and share your comments, feedback, or even new inspiration! This will be incredibly valuable as we chart the next chapter of Heroku. Meanwhile, if you have any questions, please feel free to reach out to our team. You can also refer to the roadmap FAQ for additional information.
*After 12 months, accounts will be charged for active services or they must spin down their resources to avoid charges.
Any unreleased services or features referenced in this or other posts or public statements are not currently available and may not be delivered on time or at all. Customers who purchase Salesforce applications should make their purchase decisions based upon features that are currently available. For more information please visit www.salesforce.com, or call 1-800-667-6389.
The post Heroku Partners with GitHub to Offer Student Developer Program appeared first on Heroku.
]]>When we announced Heroku’s Next Chapter last month, we received a lot of feedback from our customers. One of the things that stood out was interest in a middle ground between our retired Heroku free plan and our current Hobby dyno and data plans, a lower-cost option. We’ve also fielded requests to keep a dyno that “sleeps” when not receiving requests, which is an integral feature for non-production apps.
The post Heroku Pricing and Our New Low-Cost Plans appeared first on Heroku.
]]>When we announced Heroku’s Next Chapter last month, we received a lot of feedback from our customers. One of the things that stood out was interest in a middle ground between our retired Heroku free plan and our current Hobby dyno and data plans, a lower-cost option. We’ve also fielded requests to keep a dyno that “sleeps” when not receiving requests, which is an integral feature for non-production apps.
Eco Dynos: Free While Sleeping
With that in mind, we’re thrilled to announce our new Eco Dynos plan, which will cost $5 for 1,000 compute hours a month, shared across all of your eco dynos. We are calling these dynos Eco because they sleep after 30 minutes of no web traffic and only consume hours when active, so they are economical for you.
Having dynos sleep while not in use is also friendly to our environment by reducing power usage. When Eco dynos are available, you’ll be able to use a one-click conversion of all your free dynos to eco, saving you time and clicks!
Eco dynos are ideal replacement for the Heroko free plans. They provide cheap cloud hosting for personal projects and small applications that don’t benefit from constant uptime. Eco dynos support up to two process types.
New Low-Cost Database Plans
We also heard your feedback to provide a lower-cost data offering. We’re very excited to announce new Mini plans for Heroku Postgres ($5/month) and Heroku Data for Redis® (25 MB, $3/month).
Our new plans will be available before we end our Heroku free plans on November 28, 2022. We will provide more information about upgrades and any steps you need to take in early November. See our FAQ for more info.
Introducing Basic Dynos
We’re also renaming our existing Hobby plans to Basic. This change is in name only and was done to indicate the flexibility and production-ready power of these small-but-reliable plans. Basic dynos don’t sleep. They are always on and they support up to ten process types.
We want to thank the passionate developer community that continues to stick with us as we make hard but necessary decisions for our business, and hope that you’ll continue to offer feedback that we can integrate into our public roadmap.
Heroku Pricing for Low-Cost Dynos
| Product Plan | Cost | Features |
|---|---|---|
| Eco Dynos | $5 for 1000 dyno hours/month | Ideal for experimenting in a limited sandbox. Dynos sleep during inactivity and don’t consume hours while sleeping. |
| Basic (formerly Hobby) Dynos | ~$0.01 per hour, up to $7/month | Perfect for small-scale personal projects and apps that don’t need scaling. |
| Essential 0 Postgres | ~$0.007 per hour, $5/month | No row limit, 1GB of storage |
| Essential 1 (formerly Hobby-Basic) Postgres | ~$0.012 per hour, up to $9/month | No row limit, 10 GB of storage |
| Mini Heroku Data for Redis® | ~$0.004 per hour, $3/month | 25 MB of storage |
Any unreleased services or features referenced in this or other posts or public statements are not currently available and may not be delivered on time or at all. Customers who purchase Salesforce applications should make their purchase decisions based upon features that are currently available. For more information please visit www.salesforce.com, or call 1-800-667-6389. This page is provided for information purposes only and subject to change. Contact your sales representative for detailed pricing information.
The post Heroku Pricing and Our New Low-Cost Plans appeared first on Heroku.
]]>The post Heroku’s Next Chapter appeared first on Heroku.
]]>Salesforce has never been more focused on Heroku's future. Today, we're announcing:
- Public roadmap: launch of our interactive product roadmap for Heroku on GitHub.
- Focus on mission critical: discontinue free product plans and delete inactive accounts.
- Student and nonprofit program: an upcoming program to support students and nonprofits in conjunction with our nonprofit team.
- Open source support: we will continue to contribute to open source projects, notably Cloud Native Buildpacks. We will be offering Heroku credits to select open source projects through Salesforce’s Open Source Program Office.
Public Roadmap
You asked us to share our plans on Heroku’s future, and we committed to greater transparency. Today we are taking another step by sharing the Heroku roadmap live on GitHub! We encourage your feedback on this new project, and welcome your comments on the roadmap itself. We’ll be watching this project closely and look forward to interacting with you there.
Focus on Mission Critical
Customers love the magically easy developer experience they get from Heroku today. Going forward, customers are asking us to preserve that experience but prioritize security innovations, reliability, regional availability, and compliance. A good example of security innovation is the mutual TLS and private key protection we announced in June.
As a reminder:
As we believe RFC-8705 based mutual TLS and private key protection for OAuth, as well as full fidelity between the Heroku GitHub OAuth integration and the GitHub App model provides more modular access privileges to connected repositories, we intend to explore these paths with GitHub.
Our product, engineering, and security teams are spending an extraordinary amount of effort to manage fraud and abuse of the Heroku free product plans. In order to focus our resources on delivering mission-critical capabilities for customers, we will be phasing out our free plan for Heroku Dynos, free plan for Heroku Postgres, and free plan for Heroku Data for Redis®, as well as deleting inactive accounts.
Starting October 26, 2022, we will begin deleting inactive accounts and associated storage for accounts that have been inactive for over a year. Starting November 28, 2022, we plan to stop offering free product plans and plan to start shutting down free dynos and data services. We will be sending out a series of email communications to affected users.
We will continue to provide low-cost solutions for compute and data resources: Heroku Dynos starts at $7/month, Heroku Data for Redis® starts at $15/month, Heroku Postgres starts at $9/month. See Heroku Pricing Information for current details. These include all the features of the free plans with additional certificate management and the assurance your dynos do not sleep to help ensure your apps are responsive.
If you want a Heroku trial, please contact your account executive or reach us here.
Students and Nonprofit Program
We appreciate Heroku’s legacy as a learning platform. Many students have their first experience with deploying an application into the wild on Heroku. Salesforce is committed to providing students with the resources and experiences they need to realize their potential. We will be announcing more on our student program at Dreamforce. For our nonprofit community, we are working closely with our nonprofit team, too.
Open Source Support
We are continuing our involvement in open source. Salesforce is proud of the impactful contribution we’ve made with Cloud Native Buildpacks. We are maintainers of the Buildpacks project, which takes your application source code and produces a runnable OCI image. The project was contributed to the CNCF Sandbox in 2018 and graduated to Incubation in 2020. For most Heroku users, Buildpacks remove the worry about how to package your application for deployment, and we are expanding our use of Buildpacks internally in conjunction with our Kubernetes-based Hyperforce initiative. For a more technical Hyperforce discussion, click here.
If you are a maintainer on an open source project, and would like to request Heroku support for your project, contact the Salesforce Open Source Program office.
Feedback Please
As always, you can offer me feedback directly. I also look forward to reading your contribution to the Heroku public roadmap project on GitHub. Refer to FAQ for additional information.
The post Heroku’s Next Chapter appeared first on Heroku.
]]>Starting October 17, 2022, we will stop accepting new deploy hooks. Existing hooks will continue working until the product is sunset on February 17, 2023 , but we encourage you to migrate your hooks as soon as possible.
There are many benefits to moving from Deploy Hooks to app webhooks, including:
App webhooks are more secure — You can…
The post Sunsetting Deploy Hooks appeared first on Heroku.
]]>Starting October 17, 2022, we will stop accepting new deploy hooks. Existing hooks will continue working until the product is sunset on February 17, 2023, but we encourage you to migrate your hooks as soon as possible.
There are many benefits to moving from Deploy Hooks to app webhooks, including:
App webhooks are more secure — You can verify that the messages you receive were made by Heroku and that the information contained in them was not modified by anyone. Refer to the Securing webhook
requests section of the official documentation for more information on how to achieve this.
With webhooks, you are in control of the notifications! — If you subscribed at the sync notification level, Heroku retries failed requests until they succeed or until the retry count is exhausted. Additionally, each notification has a status that you can check to monitor the current health of notification deliveries.
More than 20 events are currently supported by app webhooks — This includes release events. You can be notified every time a Heroku Add-on is created, when a build starts, or when the formation changes, among many other things. See the webhook events article for example HTTP request bodies for all event types.
Below you will find a quick migration guide and some differences to note between the two alternatives.
Steps to migrate from HTTP post hooks to webhooks
-
List your current add-ons.
heroku addons --all -
For each deploy hook with the HTTP plan, open the Add-on page.
heroku addons:open <add-on name>
You will be presented with a page like this:

-
Copy the URL shown on the Add-on page.
-
Create a webhook using the URL.
heroku webhooks:add -i api:release -l notify -u <URL> -a <your app name> -
Verify your webhook (you can use the releases:retry plugin to trigger a release).
heroku releases:retry -a <your app name> -
Remove the deploy hook.
heroku addons:destroy -a <your app name> <your add-on name>
App webhooks only support calling an HTTP(S) endpoint, so if you have deploy hooks using email or IRC plans, you will need to build an intermediate app to receive the webhook and send an email or post an IRC message.
Keep in mind that webhooks do not support adding dynamic parameters, such as revision={{head}}, to the webhook URL. If your HTTP post hook made use of this feature, you will need to build an app to receive the webhook, extract the needed values from the payload, and call your URL passing the parameters you need.
Another difference between app webhooks and Deploy Hooks is that you will receive a message when the deploy starts and a follow up message when it is finished. You may receive a third message if you have a release phase command. Please read this KB article for more info about this behavior.
Lastly, you should consider the differences on the payload sent by Deploy Hooks and webhooks, and update your receivers accordingly.
To ease this transition, we have made an app that handles most of these differences, and you can check it out on GitHub.
To learn more, please see the app webhooks article or try the app webhooks tutorial.
If you have any questions or concerns about this transition, please feel free to reach out to us.
Happy coding!
The post Sunsetting Deploy Hooks appeared first on Heroku.
]]>On April 13, 2022, GitHub notified…
The post April 2022 Incident Review appeared first on Heroku.
]]>On April 13, 2022, GitHub notified Salesforce of a potential security issue, kicking off our investigation into this incident. Less than three hours after initial notification, we took containment action against the reported compromised account.
As the investigation continued, we discovered evidence of further compromise, at which point we engaged our third-party response partner. Our analysis, based on the information available to us, and supported by third-party assessment, led us to conclude that the unauthorized access we observed was part of a supply-chain type attack. We are continuing to review our third-party integrations and removing any that are not aligned with our security standards and commitment to improving the shared security model.
At Salesforce, Trust is our #1 value, and that includes the security of our customers' data. We know that some of our response and containment actions to secure our customer’s data, in particular cutting off integration with GitHub and rotating credentials, impacted our customers. We know that these actions may have caused some inconvenience for you, but we felt it was a critical step to protect your data.
We continue to engage with the GitHub security and engineering teams to raise the bar for security standards. As we believe RFC-8705 based mutual TLS and private key protection for OAuth, as well as full fidelity between the Heroku GitHub OAuth integration and the GitHub App model provides more modular access privileges to connected repositories, we intend to explore these paths with GitHub.
We also continue to invest in Heroku, strengthen our security posture, and strive to ensure our defenses address the evolving threat landscape. We look forward to your feedback on both the report and our future roadmap. If you would like to offer me feedback directly, please contact me here: www.linkedin.com/in/bobwise.
Incident 2413 – Summary of Our Investigation
The following is a summary, including known threat actor activity and our responses, of our investigation into unauthorized access to Heroku systems taking place between April 13, 2022, and May 30, 2022.
Incident Summary
On April 13, 2022, GitHub notified our security team of a potential security issue they identified on April 12, 2022, and we immediately launched an investigation. Within three hours, we took action and disabled the identified compromised user’s OAuth token and GitHub account. We began investigating how the user’s OAuth token was compromised and determined that, on April 7, 2022, a threat actor obtained access to a Heroku database and downloaded stored customer GitHub integration OAuth tokens.
According to GitHub, the threat actor began enumerating metadata about customer repositories with the downloaded OAuth tokens on April 8, 2022. On April 9, 2022, the threat actor downloaded a subset of the Heroku private GitHub repositories from GitHub, containing some Heroku source code. Additionally, according to GitHub, the threat actor accessed and cloned private repositories stored in GitHub owned by a small number of our customers. When this was detected, we notified customers on April 15, 2022, revoked all existing tokens from the Heroku Dashboard GitHub integration, and prevented new OAuth tokens from being created.
We began investigating how the threat actor gained initial access to the environment and determined it was obtained by leveraging a compromised token for a Heroku machine account. We determined that the unidentified threat actor gained access to the machine account from an archived private GitHub repository containing Heroku source code. We assessed that the threat actor accessed the repository via a third-party integration with that repository. We continue to work closely with our partners, but have been unable to definitively confirm the third-party integration that was the source of the attack.
Further investigation determined that the actor accessed and exfiltrated data from the database storing usernames and uniquely hashed and salted passwords for customer accounts. While the passwords were hashed and salted, we made the decision to rotate customer accounts on May 5, 2022, out of an abundance of caution due to not all of the customers having multi-factor authentication (MFA) enabled at the time and potential for password reuse.
As the investigation continued, we confirmed that on the same day the threat actor exfiltrated the GitHub OAuth tokens, they also downloaded data from another database that stores pipeline-level config vars for Review Apps and Heroku CI. Once detected on May 16, 2022, we notified impacted customers privately on May 18, 2022, and provided remediation instructions. During this time, we placed further restrictions on token permissions, database access, and architecture changes.
Over the course of our investigation we implemented a production moratorium and disabled or rotated credentials of other critical accounts. We engaged our third party incident response partner for additional assistance on April 14, 2022. We worked with our threat intelligence partners across the industry to gain additional insight into this actor’s activity, which allowed us to expand our investigation, improve detection, and implement additional security controls that were targeted at preventing the threat actor from gaining any further unauthorized access. We engaged GitHub on an ongoing basis for information and checked for other potentially compromised assets, credentials, and tokens. We took further proactive measures, including additional credential and key rotation, re-encryption, disabling internal automation, installing more threat detection tools, and shutting down non-essential systems.
The diligent response efforts, including enhanced detection, comprehensive mitigation, and detailed investigation effectively disrupted the threat actor’s established infrastructure and eliminated their ability to continue their unauthorized access. We have continuous monitoring in place and have no evidence of any unauthorized access to Heroku systems by this actor since April 14, 2022.
Per our standard incident response process, we leveraged this incident to intensely scrutinize our security practices, both offensively and defensively, identified improvements, and have prioritized these actions over everything else.
Security Best Practices for Our Customers
In addition to the actions that have already been communicated to our customers and the additional security enhancements we are making, please keep the following best practices in mind:
- Never re-use your passwords across Heroku and other websites. Password re-use increases the probability of your Heroku account being compromised due to a security issue in another service. We suggest using password managers such as the one available in your operating system, your browser, or open source and commercial password managers.
- Enable MFA on your Heroku account to significantly reduce the probability of password based compromise. Here are some resources to help with your MFA journey:
- For guidance on setting up MFA, visit the MFA article in the Heroku Dev Center .
- Set up recovery codes so you have a backup to your primary MFA verification method.
- For additional details, bookmark the Heroku Multi-Factor Authentication FAQ. This resource is updated regularly with the latest information.
- Audit your GitHub repositories and organizations against GitHub best practices and consider enabling GitHub repository security policies when possible. Review any integration that you connect to your GitHub repositories and ensure that the integration is trusted.
The post April 2022 Incident Review appeared first on Heroku.
]]>We know you are waiting for us to re-enable our integration with GitHub, and we've committed to you that we would only do so following a security review. We are happy to report that the review has now been completed.
One of the areas of focus was a review of the scope of tokens we request from GitHub and store on your behalf. Currently, when…
The post Plans to Re-enable the GitHub Integration appeared first on Heroku.
]]>We know you are waiting for us to re-enable our integration with GitHub, and we’ve committed to you that we would only do so following a security review. We are happy to report that the review has now been completed.
One of the areas of focus was a review of the scope of tokens we request from GitHub and store on your behalf. Currently, when you authenticate with GitHub using OAuth, we request repo scope. The repo scope gives us the necessary permissions to connect a Heroku pipeline to your repo of choice and also allows us to monitor your repos for commits and pull requests. It also enables us to write commit status and deploy status to your repo on GitHub. As GitHub OAuth integration is designed, it provides us with greater access than we need to get the integration working.
In an effort to improve the security model of the integration, we are exploring additional enhancements in partnership with GitHub, which include moving to GitHub Apps for more granular permissions and enabling RFC8705 for better protection of OAuth tokens. As these enhancements require changes by both Heroku and GitHub, we will post more information as the engagement evolves.
Meanwhile, we are working quickly to re-enable the integration after running through a detailed checklist with the current permissions in place. Once the integration is re-enabled, you will be able to reconnect with GitHub and restore the Heroku pipeline functionality, including review apps, with newly generated tokens. We will be turning the integration back on next week and will notify you via a Heroku status post when it is available again for use.
When we re-enable the integration next week, you will be able to re-connect to GitHub or choose to wait for us to improve on our integration with GitHub as described earlier. The choice is yours. Either way, we recommend git push heroku to keep your services up and running until you choose to re-connect with GitHub on Heroku.
Thank you for your patience. We are as excited as you are to re-enable the GitHub integration as we know you are eager to start using it again.
The post Plans to Re-enable the GitHub Integration appeared first on Heroku.
]]>I’ve been deeply impressed by the skills and dedication of the Heroku team, and the commitment of Salesforce to Trust as our #1 value. I’m also energized because it is clear that the Heroku team does not stand alone inside Salesforce. To respond to this incident, Salesforce colleagues from around the company…
The post We’ve Heard Your Feedback appeared first on Heroku.
]]>I’ve been deeply impressed by the skills and dedication of the Heroku team, and the commitment of Salesforce to Trust as our #1 value. I’m also energized because it is clear that the Heroku team does not stand alone inside Salesforce. To respond to this incident, Salesforce colleagues from around the company have augmented the Heroku team in every way possible. The Heroku team and their colleagues have worked around the clock, including nights and weekends. It’s often during a crisis when a team really comes together, and it has been inspiring to see that happen here.
Based on our investigation to date, and the hard work of our team, supported by a third-party security vendor, and our extensive threat detection systems, we have no evidence of any unauthorized access to Heroku systems since April 14, 2022. We continue to closely monitor our systems and continually improve our detection and security controls to prevent future attempts. Additionally, we have no evidence that the attacker has accessed any customer accounts or decrypted customers’ environment variables.
We’ve heard your feedback on our communications during this incident. You want more transparency, more in-depth information, and fewer “we are working on it” posts. It is a hard balance to strike. While we strive to be transparent, we also have to ensure we are not putting our customers at risk during an active investigation. Our status post on May 5, 2022, was part of our effort to get the balance right. Based on your feedback, we are going to start publishing only when we have new relevant information to share. Once the incident is resolved, we will publish details regarding the incident to provide a more complete picture of the attacker’s actions.
We know that the integration between Heroku and GitHub is part of the magic of using Heroku. We heard loud and clear that you are frustrated by how long it has taken us to re-enable the GitHub integration that simplifies your deployment workflows. We hope to reinstate the integration in the next several weeks, but we will only do that when we are sure that integration is safe and secure for our customers. Until then, please rely on git push heroku or one of the alternative approaches that utilize our Platform API. As we progress through our response, we will provide updates as they are available.
We can be better, and we will be. In the course of responding to this incident, we have significantly added to our overall security posture. We will work to rebuild your trust through more meaningful communications and bringing the integration with GitHub back online.
I have a lifelong enthusiasm for developers and the experience they have building software together, and I could not be more thrilled to be part of the Heroku family as we chart our course in the coming years. If you would like to offer me feedback directly, please contact me here: www.linkedin.com/in/bobwise
Revised on May 10, 2022, with updated links to documentation for GitHub integration and temporary alternatives.
The post We’ve Heard Your Feedback appeared first on Heroku.
]]>Today, we’re happy to tell you that we’ve added a new feature that enables stateful function invocation using Heroku Data products. It’s a simple feature that lets your functions securely access Heroku Data products, including Heroku Postgres, Heroku Kafka, and Heroku Redis directly from your function.
Access to…
The post Heroku Data in Salesforce Functions appeared first on Heroku.
]]>Today, we’re happy to tell you that we’ve added a new feature that enables stateful function invocation using Heroku Data products. It’s a simple feature that lets your functions securely access Heroku Data products, including Heroku Postgres, Heroku Kafka, and Heroku Redis directly from your function.
Access to Heroku Data is enabled through collaboration between your Salesforce org and a Heroku account. It’s easy to enable collaboration and Functions developers can access data stores running in Heroku by adding a Heroku account as a collaborator:
sf env compute collaborator add --heroku-user username@example.com
The Heroku account can then share the data store with a Functions compute environment. Simply get the name of the compute environment you want to give access to, then attach the data store to the environment.
Get the name of the compute environment from the sf cli:
sf env list
Then attach it:
heroku addons:attach <example-postgres-database> --app <example-compute-environment-name>
This currently works only for data stores running in the Common Runtime, for example Standard and Premium Postgres plans. We hope to expand this to allow existing private data stores to be securely exposed to Functions. If you are new to functions, see Get Started with Salesforce Functions for an overview and quick start.
Connecting Heroku Data and Functions opens up many new use cases:
- Create a function to easily iterate across data in Heroku Postgres, including data managed by Heroku Connect.
- Produce messages into an Apache Kafka on Heroku stream, making it easier to deploy Apache Kafka on Heroku as a orchestration layer for microservices on the Heroku platform.
- Sharing a job queue or cache based on Heroku Redis.
We can’t wait to hear your feedback.
The post Heroku Data in Salesforce Functions appeared first on Heroku.
]]>The post Improving User Experience with Long-Lived Dashboard Sessions appeared first on Heroku.
]]>We've learned a lot on our journey of implementing MFA, which has been available on Heroku since 2014. Last year, we introduced enhancements to our MFA implementation including additional verification methods and administrative controls like managing MFA for Enterprise Account users. In addition, we now require MFA for all Heroku customers which mitigates the risk of phishing and credential stuffing attacks.
Feedback is Important
At Heroku we take customer feedback seriously and incorporate it into our product plans. We got a lot of feedback that the 12-hour session timeout and resulting daily logins seriously degraded the Heroku Dashboard user experience, and we appreciate the opportunity to use that feedback to improve Heroku. The new, longer Dashboard sessions strike a better balance between security and user experience: If you’re a frequent Heroku user you now only have to log in every 10 days and the inactivity-based timeout ensures that inactive or abandoned sessions do not pose a security risk.
We hope you enjoy this improvement as much as we do!
The post Improving User Experience with Long-Lived Dashboard Sessions appeared first on Heroku.
]]>This following story outlines a recent issue we saw with migrating one of our internal systems over to a new EC2 substrate and in the process breaking one of our customer’s use cases. We also outline how we went about discovering the root of the issue, how we fixed it, and how we enjoyed solving a complex problem that helped keep the Heroku customer experience as simple and straightforward as possible!
…
The post The Adventures of Rendezvous in Heroku’s New Architecture appeared first on Heroku.
]]>
Summary
This following story outlines a recent issue we saw with migrating one of our internal systems over to a new EC2 substrate and in the process breaking one of our customer’s use cases. We also outline how we went about discovering the root of the issue, how we fixed it, and how we enjoyed solving a complex problem that helped keep the Heroku customer experience as simple and straightforward as possible!
History
Heroku has been leveraging AWS and EC2 since the very early days. All these years, the Common Runtime has been running on EC2 Classic and while there have always been talks about moving to the more performant and feature rich VPC architecture that AWS offers, we hadn’t had the time and personnel investment to make it a reality until very recently. The results of that effort were captured in a previous blog post titled Faster Dynos for All
While our Common Runtime contains many critical components, including our instance fleet to run app containers, our routers and several other control plane components, one of the often overlooked but yet critical components is Rendezvous, our bidirectional proxy server that enables Heroku Run sessions to containers. This is the component that lets customers run what are called one-off dynos that are used for a wide range of use-cases ranging from a simple prompt to execute/test a piece of code to complex CI scenarios.
Architecture of Rendezvous
Rendezvous has been a single-instance server from time immemorial. It is a sub-200 line Ruby script that runs on an EC2 instance with an EIP attached to it. The ruby process receives TLS connections directly, performs TLS termination and proxies bidirectional connections that match a given hash.
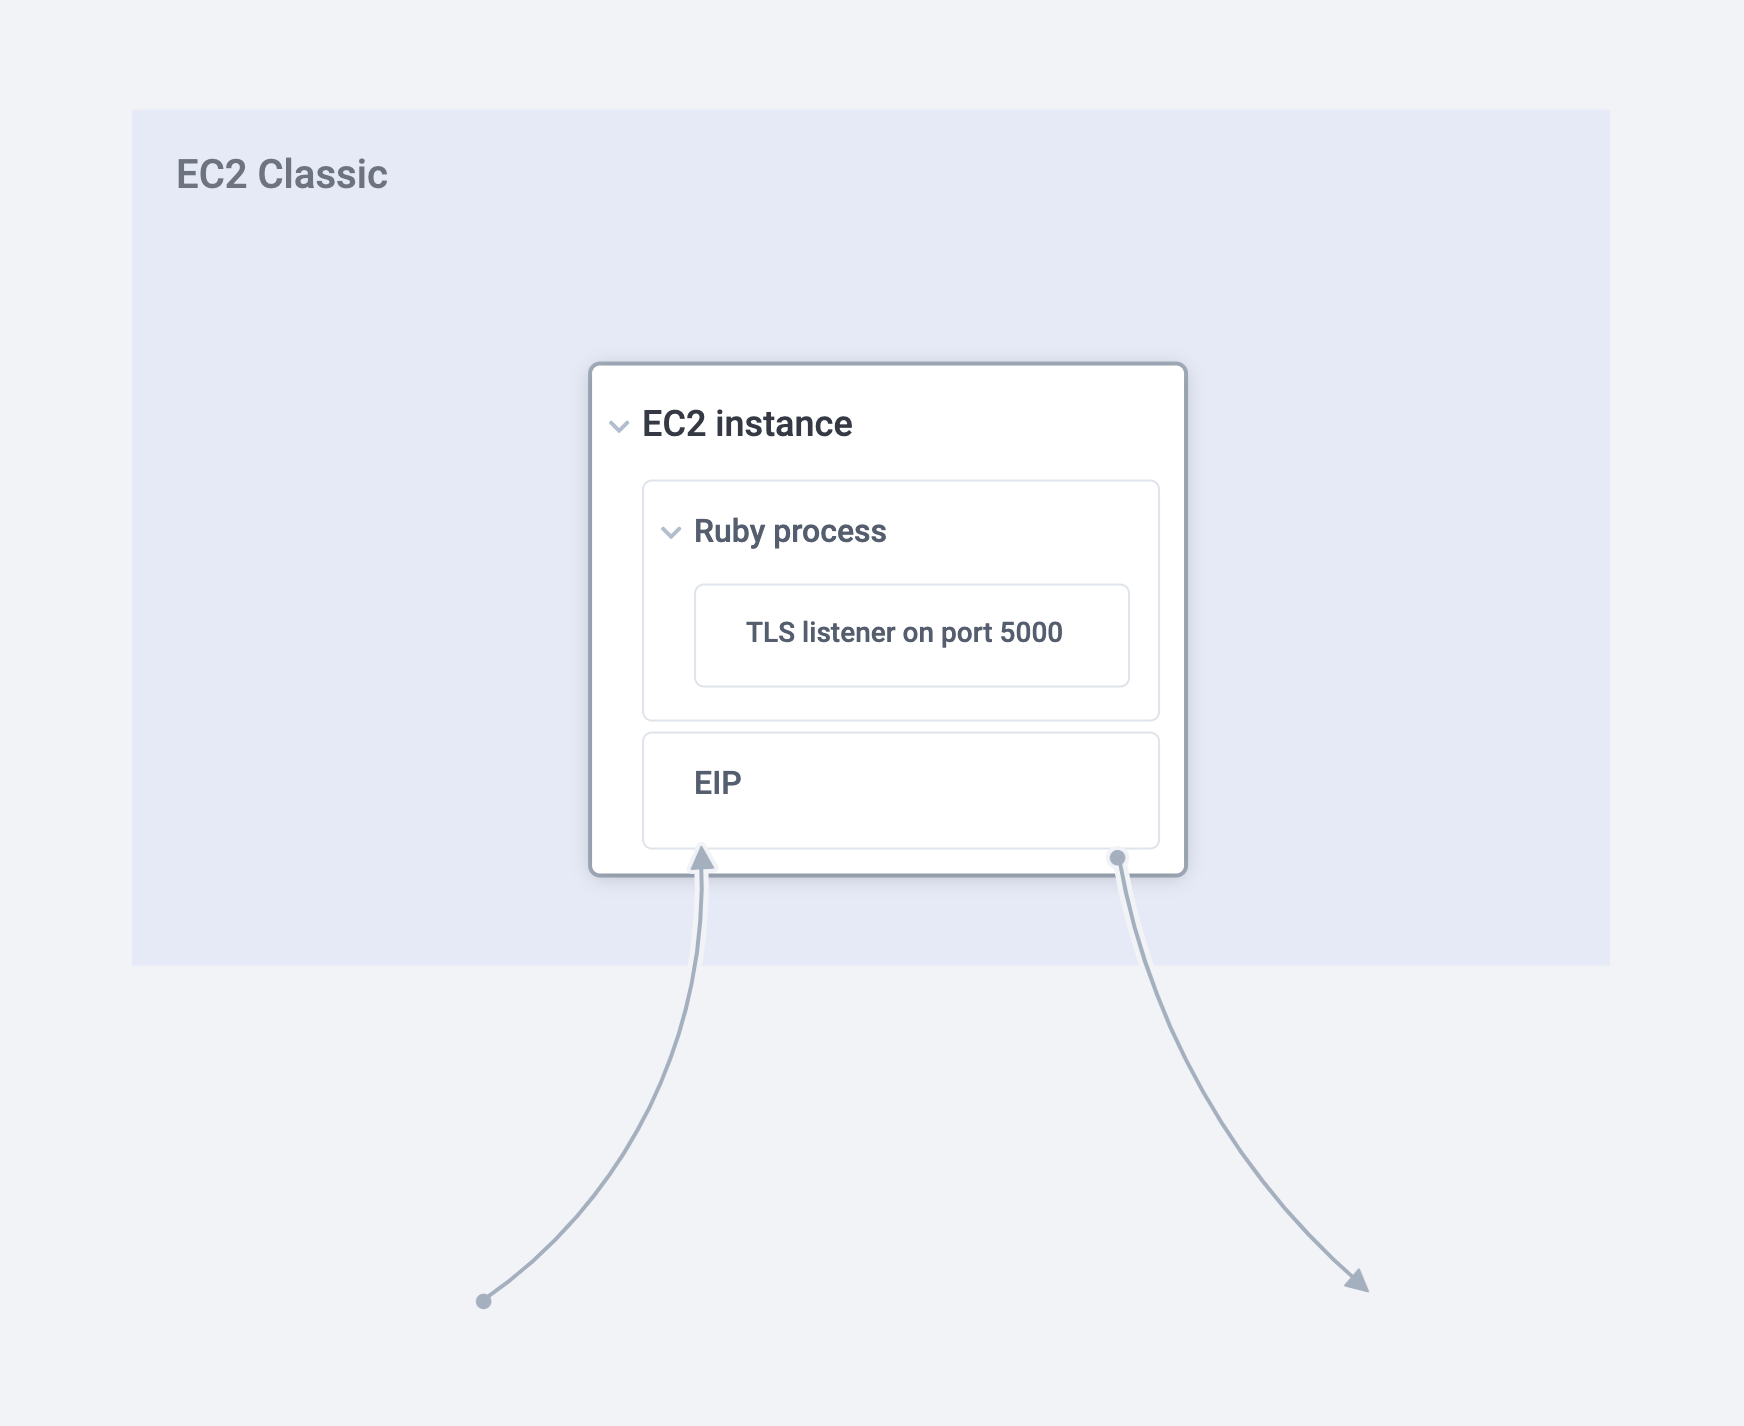
Every Heroku Run/One-off dyno invocation involves two parties – the client which is usually the Heroku CLI or custom implementations that use the Heroku API and the dyno on one of Heroku’s instances deep in the cloud. The existence of Rendezvous is necessitated by one of the painful yet essential warts of the Internet – NATs.
Both the client and the dyno are behind NATs and there’s no means for them to talk to each other through these pesky devices. To combat this, the Heroku API returns an attach_url as part of the create_dyno request which lets the client reach the dyno. The attach_url also contains a 64 bit hash to identify this specific session in Rendezvous. The same attach_url with the exact hash is passed on by our dyno management system to an agent that runs on our EC2 instance fleet which is responsible for the lifecycle of dynos.
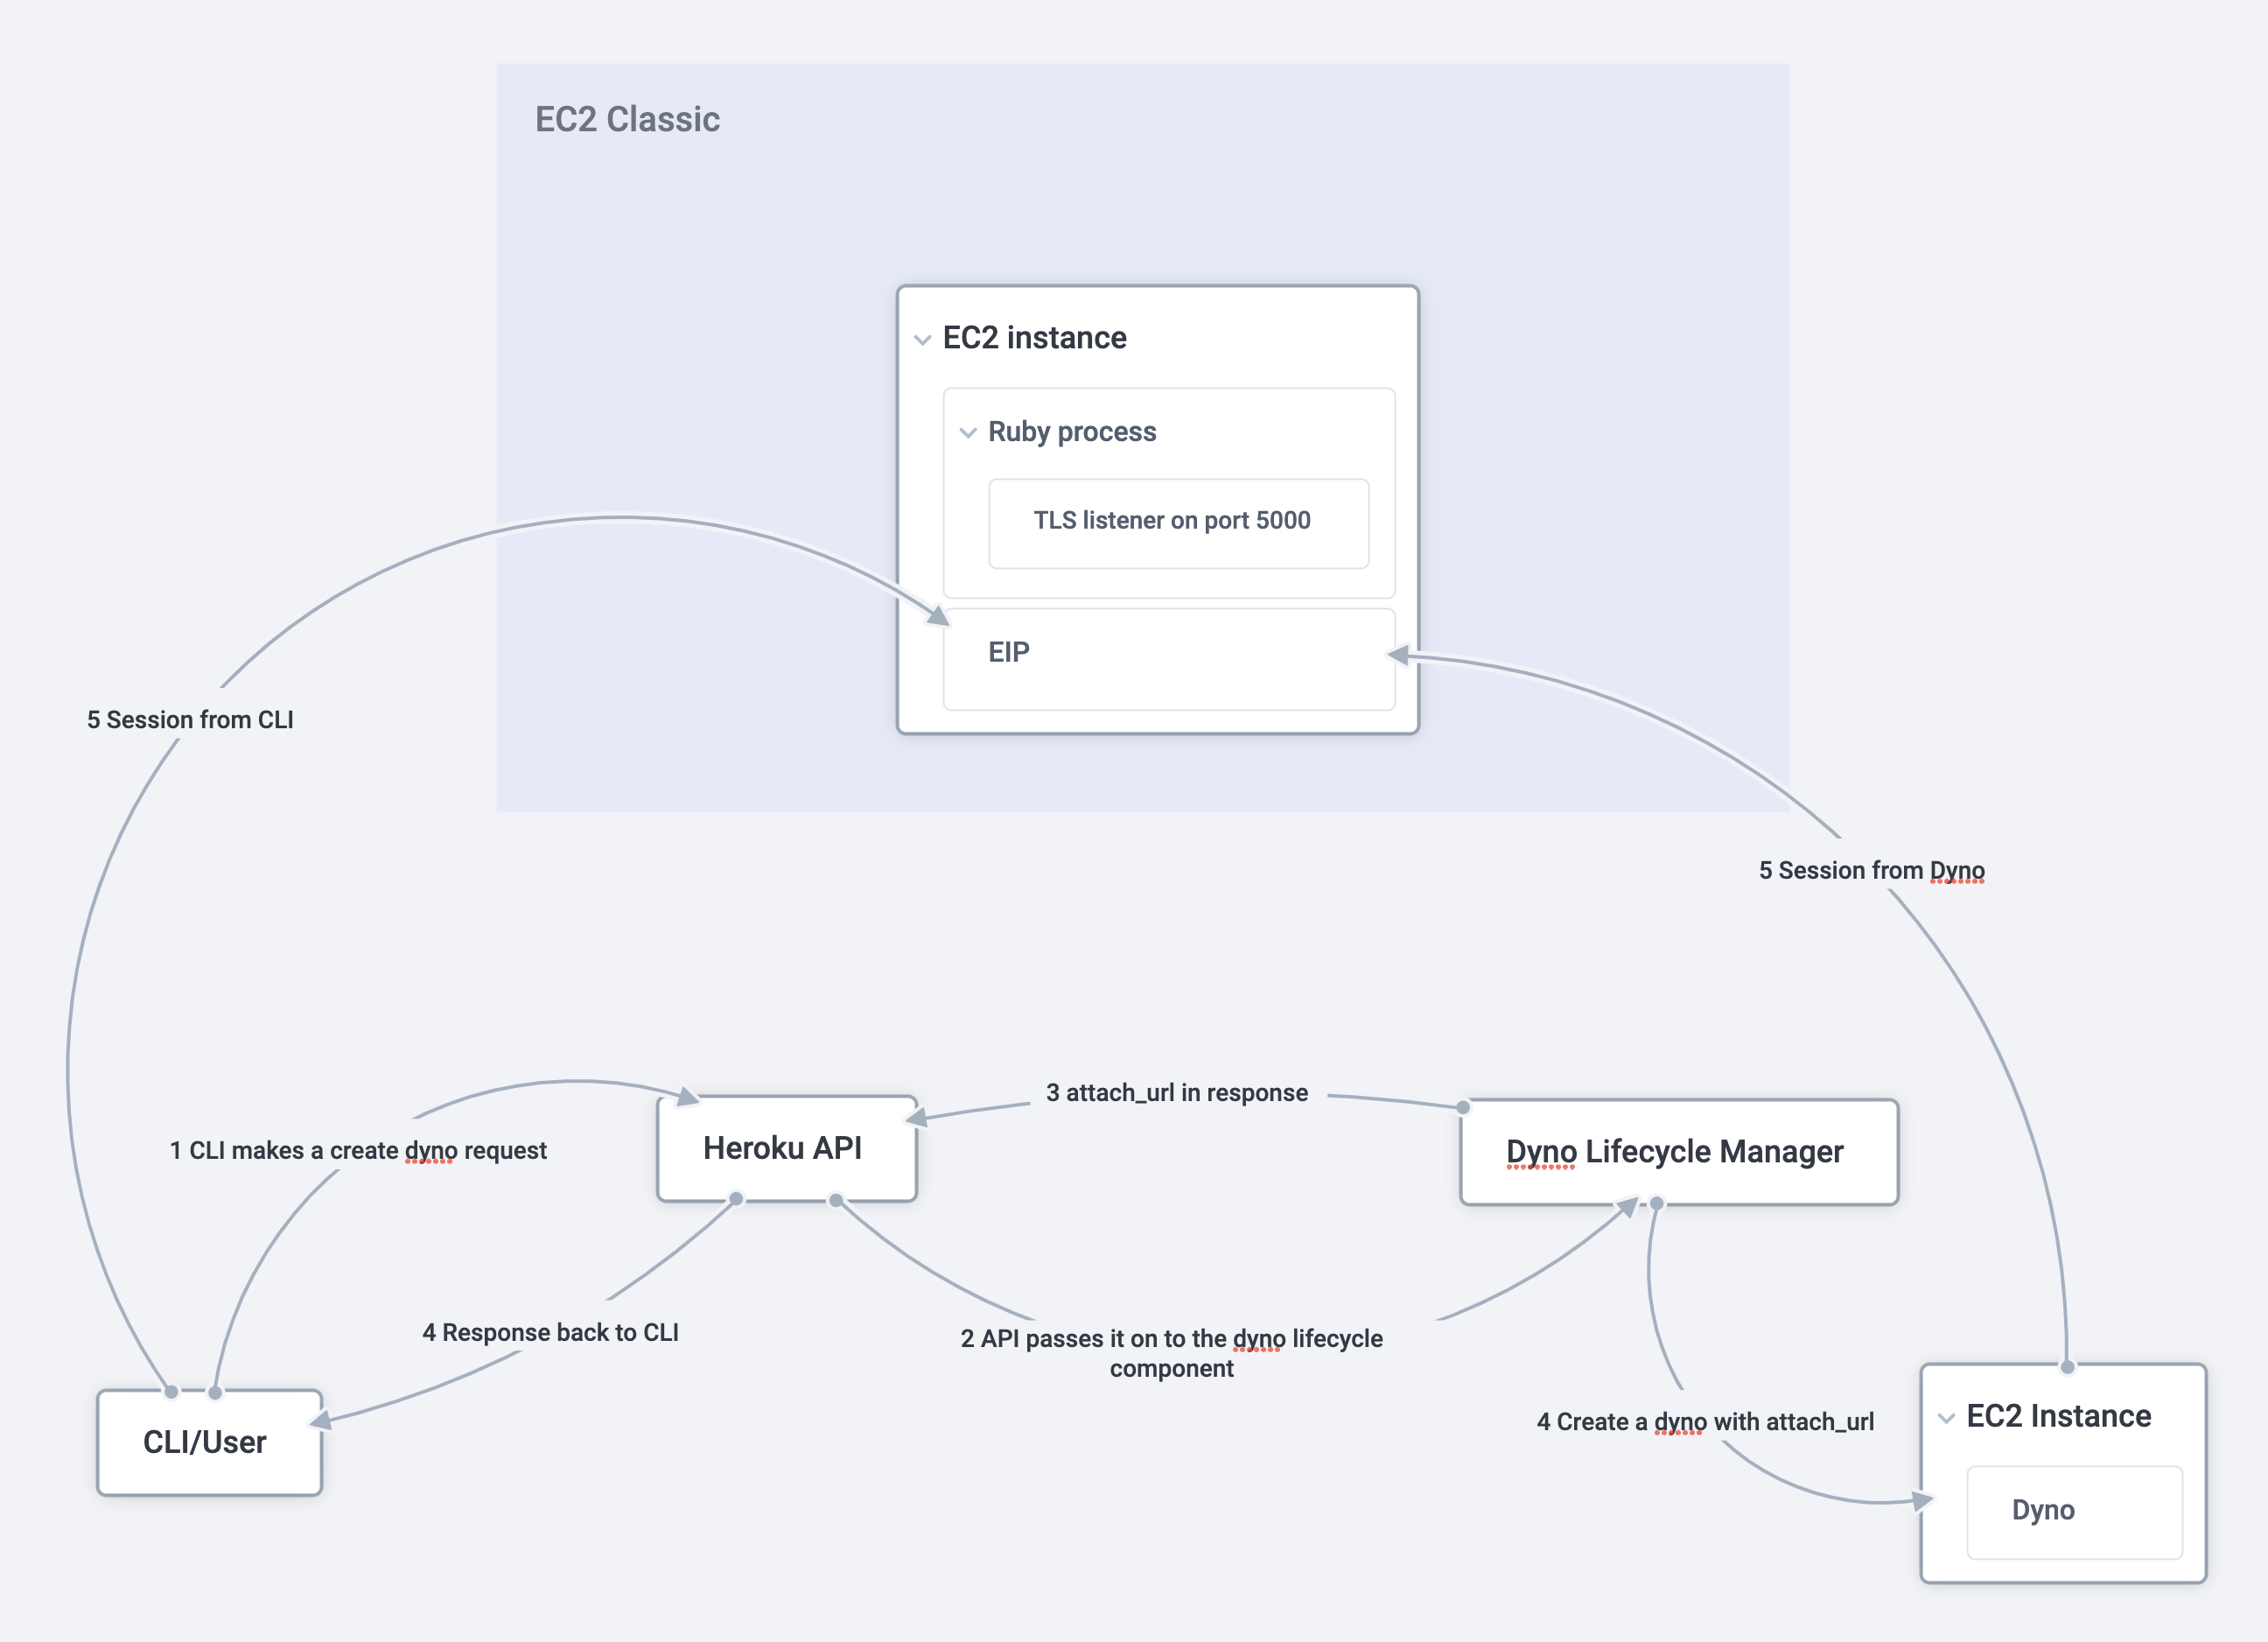
Once both the systems receive the attach_url with the same hash, they make a TLS request to the host, which is a specific instance of Rendezvous. Once the TLS session is established, both sides send the hash as the first message which lets Rendezvous identify which session the connection belongs to. Once the two sides of the session are established, Rendezvous splices them together, thus creating a bi-directional session between the CLI/user and the dyno.
A unique use-case of Rendezvous
While the majority of customers use Rendezvous via heroku run commands executed via the CLI, some clients have more sophisticated ways of needing containers to be started arbitrarily via the Heroku API. These clients programmatically create a dyno via the API and also establish a session to the attach_url.
One of our customers utilized Rendezvous in a very unique way by running an app in a Private Space that received client HTTP requests and within the context of a request, issued another request to the Heroku API and to Rendezvous. They had a requirement to support requests across multiple customers and to ensure isolation between them, they opted to run each of their individual customer’s requests inside one-off dynos. The tasks in the one-off dyno runs are expected to take a few seconds and were usually well within the expected maximum response time limit of 30s by the Heroku router.
Oh! Something’s broken!
In July 2021, we moved Rendezvous into AWS VPCs as part of our effort to evacuate EC2 classic. We chose similar generation instances for this as our instance in classic. As part of this effort, we also wanted to remove a few of the architectural shortcomings of rendezvous – having a single EIP ingress and also manual certificate management for terminating TLS.
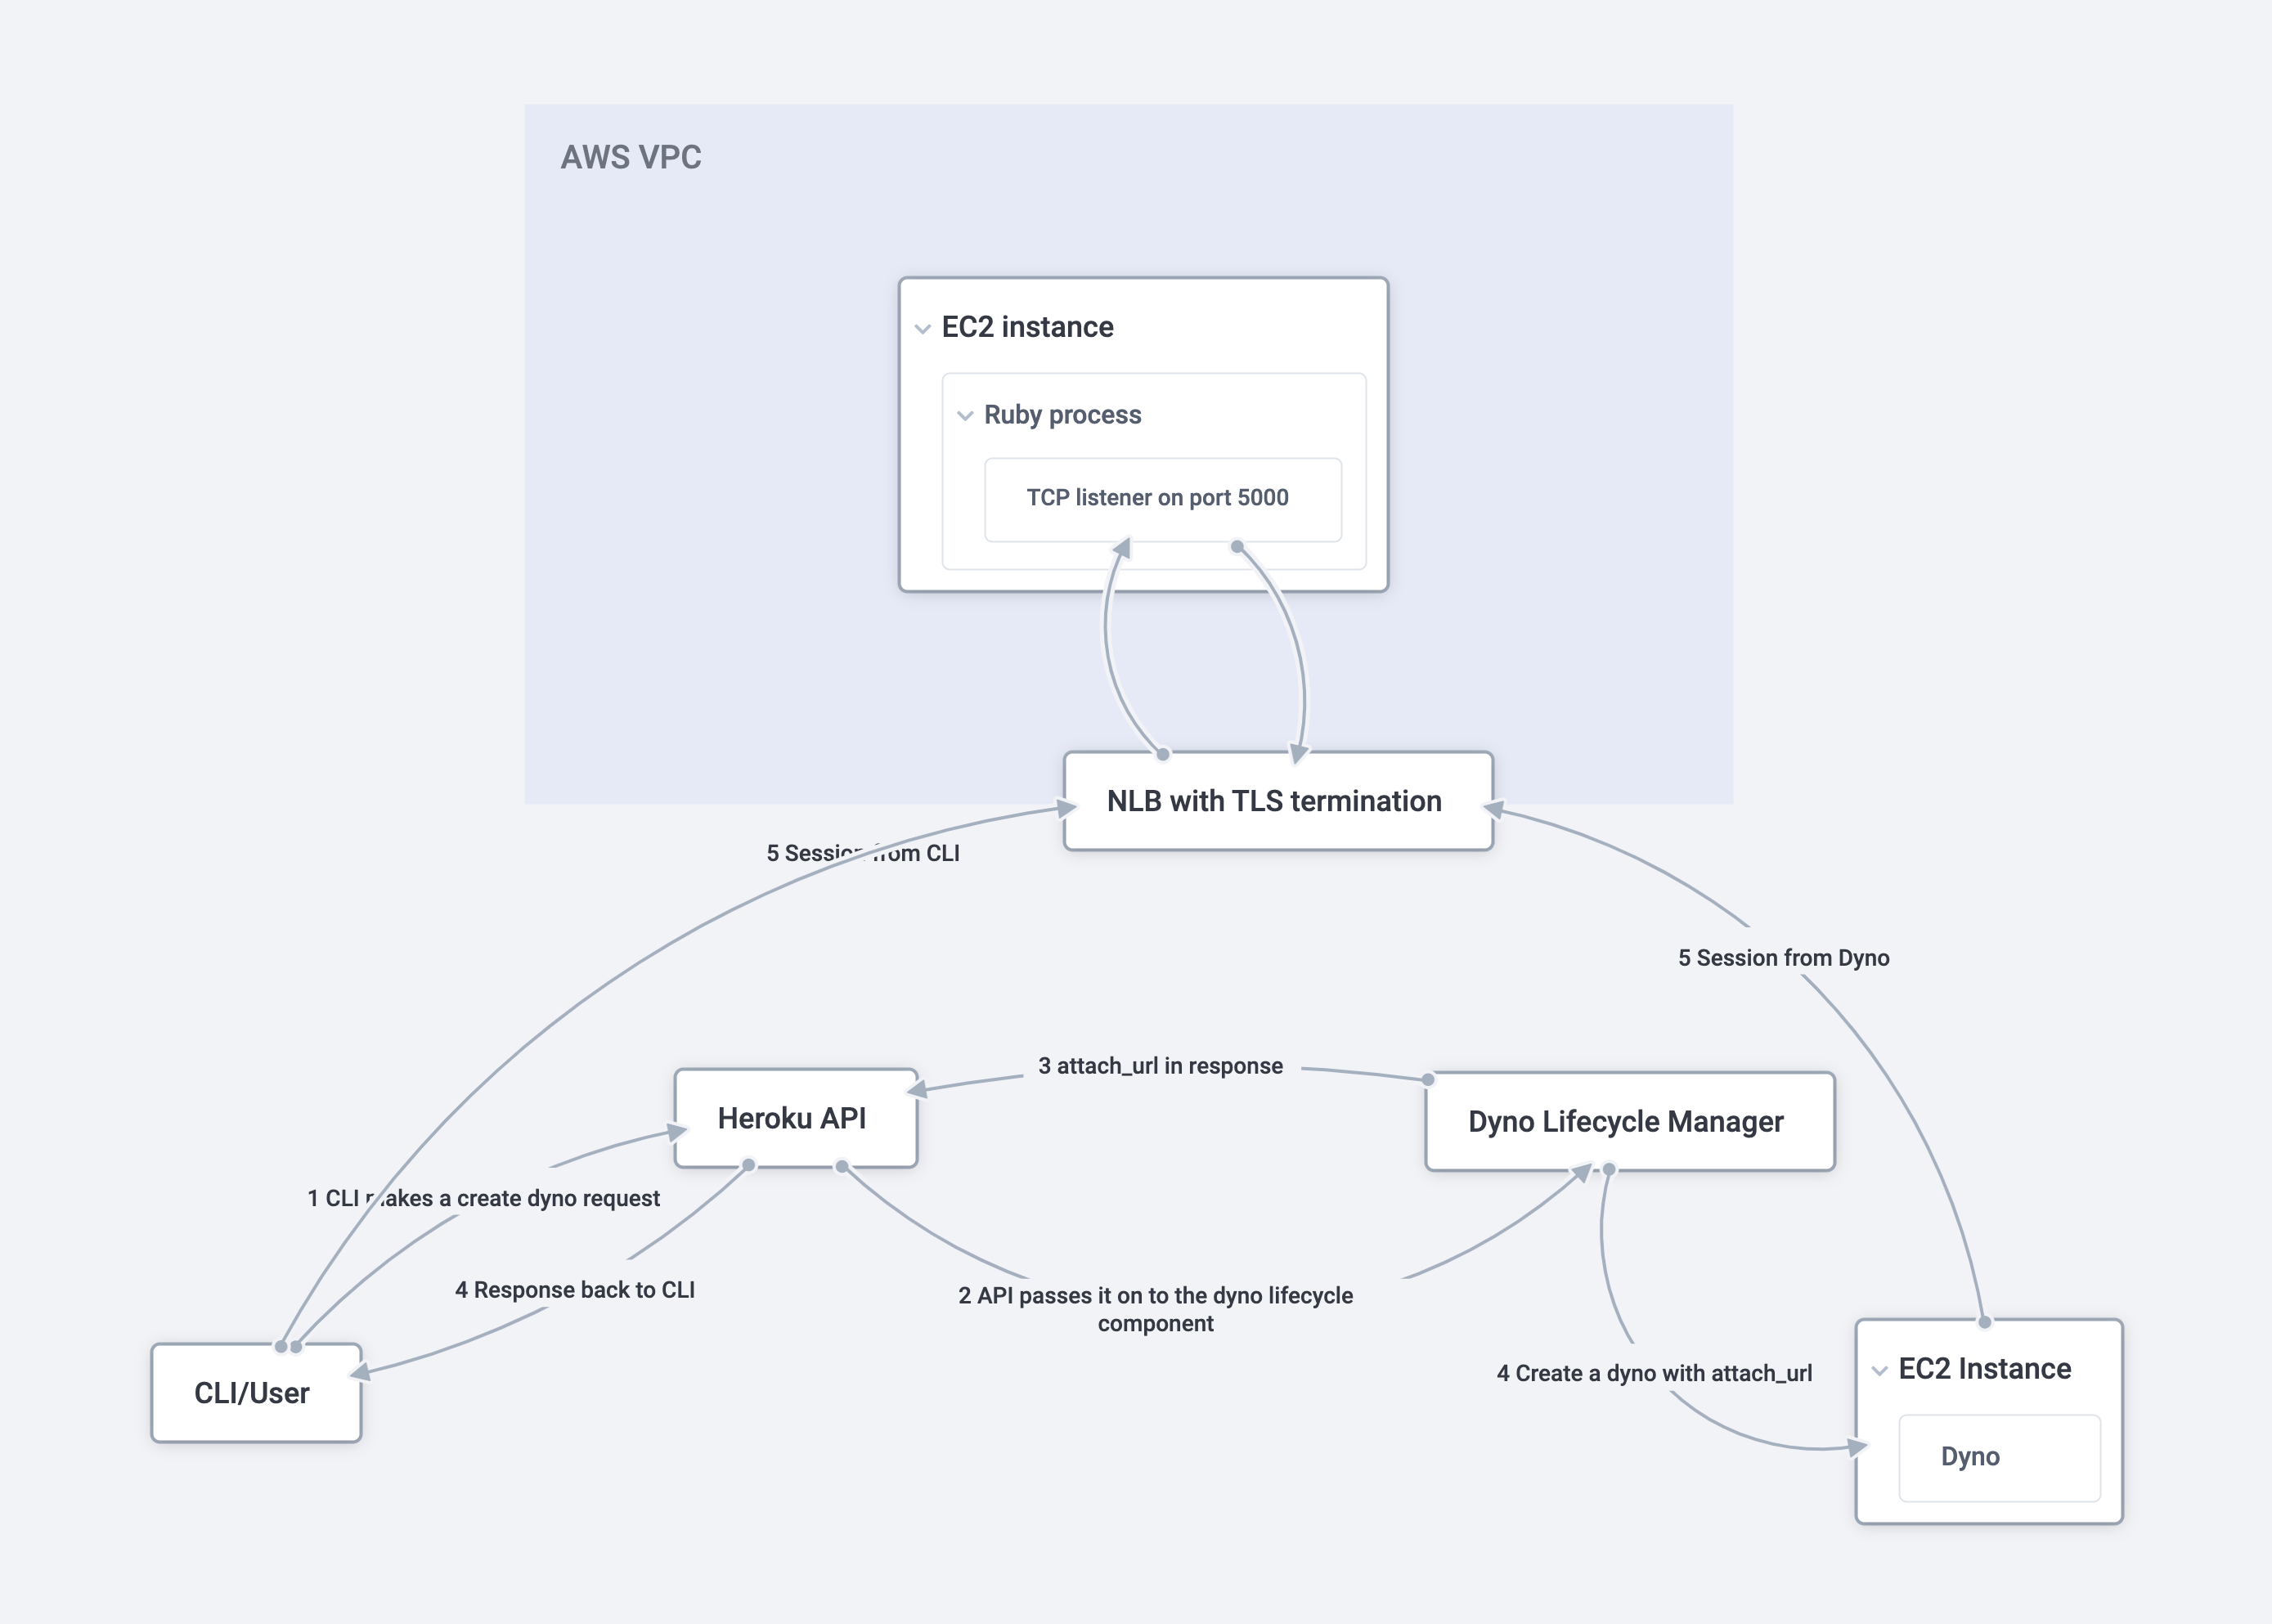
Based on experience with other routing projects, we decided to leverage Network Load Balancers that AWS offers. From a performance perspective, these were also significantly better – our internal tests revealed that NLBs offered 5-7x more throughput in comparison to the EIP approach. We also decided to leverage the NLB’s TLS termination capabilities which allowed us to stop managing our own certificate and private key manually and rely on AWS ACM to take care of renewals in the future.
While the move was largely a success and most customers didn’t notice this and their heroku run sessions continued to work after the transition, our unique customer immediately hit H12s on their app that spawns one-off dynos. Almost immediately, we identified this issue to Rendezvous sessions taking longer than the 30s limit imposed by the Heroku Router. We temporarily switched their app to use the classic path and sat down to investigate.
Where’s the problem!
Our first hunch was that the TLS termination on the NLB wasn’t happening as expected but our investigations revealed that TLS was appropriately terminated and the client was able to make progress following that. The next line of investigation was in Rendezvous itself. The new VPC-based instances were supposed to be faster, so the slowdown was something of a mystery. We even tried out an instance type that supported 100Gbps networking but the issue persisted. As part of this effort, we also had upgraded the Ruby version that Rendezvous was running on – and you guessed it right – we attempted a downgrade as well. This proved to be inconclusive as well.
All along we also suspected this could possibly be a problem in the language runtime of the recipient of the connection, where the bytes were available in the userspace buffer of the runtime but the API call was not notified or there is a race condition. We attempted to mimic the data pattern between the client and the process in the one-off dyno by writing our own sample applications. We actually built sample applications in two different languages with very different runtimes. Both these ended up having the same issues in the new environment as well.
We even briefly considered altering the Heroku Router’s timeout from 30s, but it largely felt like spinning a roulette wheel since we weren’t absolutely sure where the problem was.
Nailing it down!
As part of the troubleshooting effort, we also added some more logging on the agent that runs on every EC2 instance that is responsible for maintaining a connection with Rendezvous and the dyno. This agent negotiates TLS with Rendezvous and establishes a connection and sets up a pty terminal connection on the dyno side and sets up stdin/stdout/stderr channels with the same. The client would send requests in a set-size byte chunks which would be streamed by this agent to the dyno. The same agent would also receive bytes from the dyno and stream it back to Rendezvous to send it back to the client. Through the logs on the agent, we determined that there were logs back and forth indicating traffic between the dyno and Rendezvous when connections worked. However, for the abnormal case, there were no logs indicating traffic coming from the dyno after a while and the last log was bytes being sent to the dyno.
Digging more, we identified two issues with this piece of code:
- This piece of code was single threaded – i.e. a single thread was performing an
IO.selecton the TCP socket on the Rendezvous side and the terminal reader on the dyno. - While #1 itself is not a terrible problem, it became a problem with the use of NLBs which are more performant and have different TLS frame characteristics.
#2 meant that the NLB could potentially send much larger TLS frames than the classic setup where the Rendezvous ruby process would have performed TLS.
The snippet of code that had the bug was as follows.
# tcp_socket can be used with IO.select
# ssl_socket is after openssl has its say
# pty_reader and pty_writer are towards the dyno
def rendezvous_channel(tcp_socket, ssl_socket, pty_reader, pty_writer)
    if o = IO.select([tcp_socket, pty_reader], nil, nil, IDLE_TIMEOUT)
        if o.first.first == pty_reader
            # read from the pty_reader and write to ssl_socket
        elsif o.first.first == tcp_socket
            # read from the ssl_socket and write to pty_writer
        end
    end
end
Since the majority of the bytes were from the client, this thread would have read from the ssl_socket and written them to the pty_writer. With classic, these would have been small TLS frames which would mean that an IO.select readability notification would correspond to a single read from the SSL socket which would in-turn read from the TCP socket.
However, with the shards, the TLS frames from the NLB end up being larger, and a previous read from the ssl_socket could end up reading more bytes off of the tcp_socket which could potentially block IO.select till the IDLE_TIMEOUT has passed. It’s not a problem if the IDLE_TIMEOUT is a relatively smaller number but since this was larger than the 30s limit imposed by the Heroku Router, IO.select blocking here resulted in that timer elapsing resulting in H12s.
In fact, the Ruby docs for IO.select specifically talk about this issue.
The most likely situation is that OpenSSL::SSL::SSLSocket buffers some data. IO.select doesn't see the buffer. So IO.select can block when OpenSSL::SSL::SSLSocket#readpartial doesn't block.
According to the Linux kernel on the instance, there were no bytes to be read from the tcp_socket while there were still bytes being left to read from the buffers in openssl since we only read partially the last time around.
The fix
Once we had identified the issue, it was rather straightforward for us to fix this. We made the code dual threaded – one each for one side of the connection and also fixed the way we read from the sockets and did an IO.select. With this code change, we ensured that we wouldn’t perennially block where there are bytes lying around to be read.
We deployed this fix to our staging environments and after thorough testing we moved the customer over to the VPC-based rendezvous. The customer subsequently confirmed that the issue was resolved and all our remote offices erupted in roars of cheer after that. It was time.
Conclusion
Computers are fun, computers are hard!
Try to run a platform and you’ll often say, oh my god!
Gratifying and inspiring it is, to run our stack
For if you lose their trust, it’s hard to get it back …
Running a platform makes you appreciate more of Hyrum’s Law, every day. Customers find interesting ways to use your platform and they sure do keep you on your toes to ensure you provide the best in class service. At Heroku we have always taken pride in our mission to make life easy for customers and we are grateful to have got the opportunity to demonstrate that yet again as part of this endeavor.
Thanks are in order for all the folks who tirelessly worked on identifying this issue and fixing it. In alphabetical order – David Murray, Elizabeth Cox, Marcus Blankenship, Srinath Ananthakrishnan, Thomas Holmes, Tilman Holschuh and Will Farrington.
The post The Adventures of Rendezvous in Heroku’s New Architecture appeared first on Heroku.
]]> Copado is an end-to-end, native DevOps solution that unites Admins, Architects and
Developers on one platform. DevOps is a team sport, and uniting all 3 allows you to focus on
what you need to focus on - getting innovation into the hands of the customer.
Q: Who are you and what does Copado do?
“My name is Morgan Shultz. I'm a team lead in the Professional Services division at Copado. My team is…
The post How Copado Uses Coralogix for Log Management on Heroku appeared first on Heroku.
]]>Copado is an end-to-end, native DevOps solution that unites Admins, Architects and
Developers on one platform. DevOps is a team sport, and uniting all 3 allows you to focus on
what you need to focus on – getting innovation into the hands of the customer.
Q: Who are you and what does Copado do?
“My name is Morgan Shultz. I'm a team lead in the Professional Services division at Copado. My team is responsible for implementing our software and maximizing the value that a customer receives when they decide to invest in our software.
Copado is DevOps software specifically for low-code platforms like Salesforce, but also Mulesoft, Heroku and soon even SAP. We bring structure and visibility to the development process on these platforms.”
Q: Can you tell us a little about your experience on Heroku, and why you chose it as your PaaS Solution?
“Our application consists of two parts. The front end is a Salesforce native app. Our customers all use Salesforce, so it makes sense for our app to be built on top of a platform that they're already familiar with.
But our software also integrates with external tools and requires more processing time and controls than what you can get out of Salesforce alone. So our backend processes need a separate compute platform and we run those backend processes on Heroku for the majority of our customers.”
Q: Can you describe your experience with Coralogix and why it was picked for your log management platform?
“We needed additional tools to help us parse our backend logs. Our developers initially selected Coralogix because it was super easy for them to integrate with Heroku. Now, years later, we're still using Coralogix because it continues to deliver what we need.
Our company has grown exponentially, and we rely on Coralogix to handle our logs. We can create and share dashboards and visualizations across the organization and build alerts to help us troubleshoot customer issues or even optimize our software performance.
We use data points like job duration to highlight customer health or keyword frequency in our logs to help identify configuration errors. We also use metrics to maximize our data retention and identify longer running patterns.”
Q: Are there any specific use cases you can share with us?
“My first use case with Coralogix was hoping to identify performance issues with our customers' software instances. We used the platform to define and build alerts around job latency and how long it takes for jobs to complete.
This is a big indicator of performance issues with the customer. Once the team identifies potential performance issues. We can use the dashboards to dive down further into the logs and provide a root cause analysis for performance issues at hand.”
About Coralogix
Coralogix is the leading stateful streaming data platform for log, metric, and security data. Using proprietary Streama© technology, Coralogix provides modern engineering teams with real-time insights and trend analysis with no reliance on storage or indexing.
This unique approach to monitoring and observability enables organizations to overcome the challenges of exponential data growth in large-scale systems.
Find Coralogix in the Heroku Add-Ons Marketplace
The post How Copado Uses Coralogix for Log Management on Heroku appeared first on Heroku.
]]>When this Changelog post was published in May introducing the changes, almost all Common Runtime apps had been migrated from what we internally called the “classic“ infrastructure to the new “sharded” architecture. In addition to performance enhancements, this migration is expected to result in lower latency across the platform.
Around 99.9% of customers didn’t have to make any changes to their Heroku apps…
The post Faster Dynos For All appeared first on Heroku.
]]>When this Changelog post was published in May introducing the changes, almost all Common Runtime apps had been migrated from what we internally called the “classic“ infrastructure to the new “sharded” architecture. In addition to performance enhancements, this migration is expected to result in lower latency across the platform.
Around 99.9% of customers didn’t have to make any changes to their Heroku apps to benefit from these upgrades, and dyno prices are unchanged.

Common Runtime Improvements
The new sharded architecture includes two major performance improvements:
First, we’ve upgraded to newer generation infrastructure instances, similar to the improvements we made to Heroku Private Spaces in 2020.
Second, we’ve updated our routing infrastructure and services. With this comes several improvements such as automatic TLS 1.2+ enforcement. More importantly, the new routing infrastructure will help us unlock further product enhancements in the coming months and years.
Thank You!
We tried (and mostly succeeded) to make the migration seamless for Heroku customers. As expected with any sweeping architecture change, we did uncover some unique use cases and situations that required assistance from customers to properly migrate.
If you’re subscribed to the Heroku Changelog you might have seen mention of a few of the DNS and SSL Endpoint changes. Those changes were required to let Heroku properly support apps on the improved platform without causing any downtime or degraded experience for you or your end users. We sincerely appreciate your patience and help as we made these changes in order to modernize and improve Heroku.
Customer Impact
Rolling out a massive change to millions of apps has taken many months. As apps have come online on the new infrastructure, we’ve seen improvements from both Heroku customers and their apps’ users.
When reading these graphs, keep in mind that every app is different and Common Runtime use cases are varied. In some cases, we’ve been able to see roughly 30% percent improvement in latency and CPU utilization. While such dramatic improvements are not guaranteed, we expect every customer to see improvements.
Check out a few of the examples below:
The changes @heroku have been rolling out to their standard runtime are legit. @railsautoscale was routinely running up to 20 std-1x web dynos. Now it's mostly just 3 dynos.
Can you tell when they made the switch? pic.twitter.com/BHfzXxK8Pg
— Adam McCrea (@adamlogic) August 26, 2021
And from Reddit:
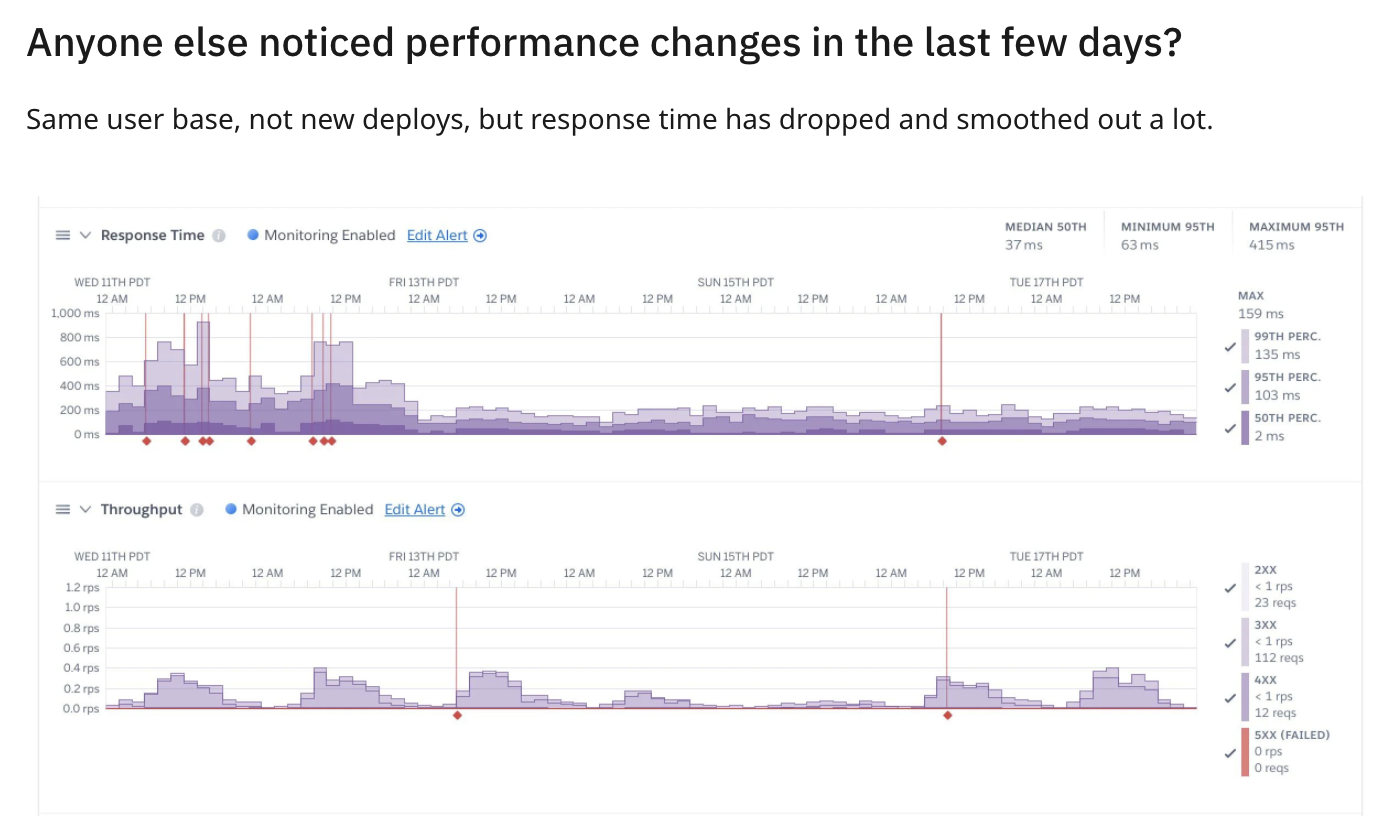
Some quotes from support tickets:
Request Latency Decrease
Since Wednesday June 2nd at 11pm GMT + 7 we experienced a lot of performance improvements, can be seen in ScoutAPM, Librato or Heroku metrics itself.
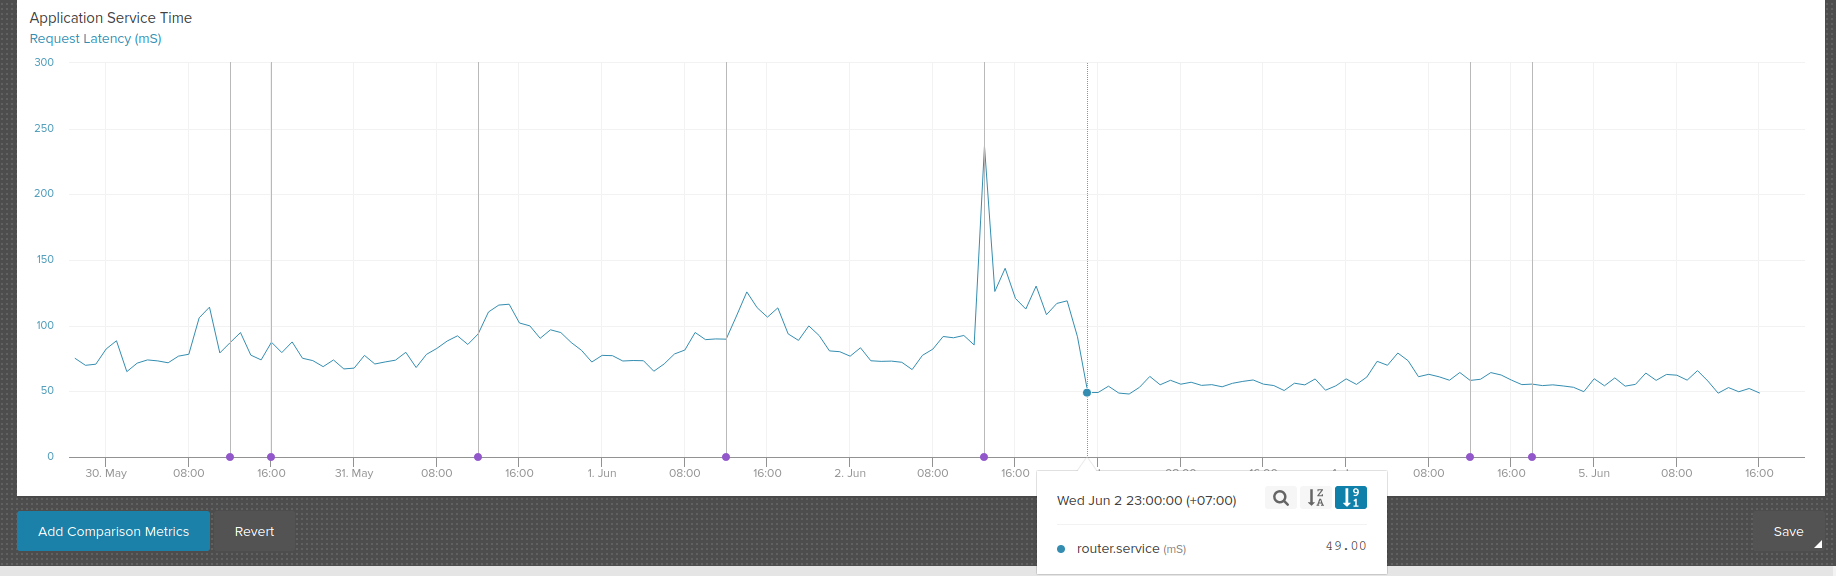
Dyno Performance Improved
It seems that our dynos are really FAST this morning, and it all started between 00:10 and 00:20 UTC+2… we are glad to know that this is the new normal for the platform. The performance we are obtaining right now are very good, and they improve the experience for our customers.
Faster Heroku Review Apps and Heroku CI
…our tests got much faster!
[Test 1] ran on August 9th and took about 11 minutes
[Test 2] ran on August 13th and took about 8 minutes
Summary
The Common Runtime performance enhancements rolled out over the summer are a great example of the benefits of relying on a managed PaaS like Heroku rather than running apps directly on un-managed infrastructure that has to be laboriously maintained and updated. Most Heroku Common Runtime customers should see meaningful performance improvements with no customer-action required.
The post Faster Dynos For All appeared first on Heroku.
]]>The post Salesforce Integration: Xplenty and Heroku Connect appeared first on Heroku.
]]>
Heroku Connect
Heroku Connect is a Salesforce component, built on the Heroku platform, that creates a real-time read/write connection between a Salesforce instance and a Heroku Postgres database. Each table in the Heroku Connect database corresponds with a Salesforce object. Once the Salesforce object data is in the database, it is available for integration:
Processes that read the database will access an up-to-date copy of the data in the corresponding objects. When an object instance is created or updated in Salesforce, a Heroku Connect UPDATE or INSERT command sends the data to Postgres.
When a process updates data or inserts a row into the Heroku Postgres database, Heroku Connect updates or inserts data into the Salesforce object that corresponds with the row in the Postgres database.
The ability to access a Postgres copy of Salesforce data opens that data to a wide variety of integration tools that don’t communicate directly with Salesforce. Any programming language or integration tool that supports Postgres — and that’s pretty much all of them — can be used to access your organization’s Salesforce data. Since Postgres’s interface is standard SQL, instead of the proprietary Salesforce API, your developer resources are able to access Salesforce using a familiar query language.
Heroku Connect opens the door to Salesforce integration, and if you have development resources, you can pass through that door and enter a world where Salesforce and your internal systems interchange data in near real time.
Xplenty
Xplenty is a data integration tool that supports over 100 different integration targets, including Postgres on the Heroku platform. Xplenty provides a drag-and-drop interface where non-programmers can create data pipelines connecting any of the different systems that Xplenty supports. Xplenty pipelines support a number of different data cleansing and transform operations, so you can standardize data, or weed out low quality data, without getting developers involved. Since Xplenty supports any system using the widely-used REST API, even systems that don’t have a direct interface to Postgres can access Heroku Connect data via a Xplenty data pipeline.

Xplenty can also address some of the security issues that prevent cloud data integration with on-premises systems (leveraging reverse SSH tunnels). The Xplenty security solution allows systems behind the firewall to access Salesforce data securely, without exposing those systems to the wider internet. Leveraging our SOC 2 certified and HIPAA-compliant tool eliminates both the security and development timeline risk associated with a roll-your-own interface to on-premises systems.
Common Heroku Connect use cases
Analytics — While the Heroku Postgres database is great for synchronization and transactions, it’s not optimized for analysis. Using Xplenty, you can quickly and easily transfer data to high performance data warehousing systems like Snowflake, Amazon Redshift, or Google BigQuery. The Xplenty data pipeline tool lets you schedule extracts for any timeline, starting at once per minute. Our data pipeline tool allows you to select only records meeting your data quality criteria (for example, leads with phone numbers and email addresses) for analysis, and publishing the results back into Salesforce.
Application Integration — If you have a customer-facing application hosted on another platform, an Xplenty data pipeline can feed that app customer data from your Salesforce system. This, in turn, powers a smooth end user experience, where signup for your app is much easier since the customer’s information is pre-populated in the application database. Again, the powerful Xplenty data pipeline tools give you the ability to select only specific customers (such as B2C but not B2B) for your customer-facing app. Our large set of database integrations let you insert customer data directly into the application database, or we can use your application’s REST API to push and pull data from your system.
Marketing — While Salesforce has powerful marketing tools, your organization may already have committed time and money to another marketing platform. Since Xplenty supports some marketing platforms natively, and almost any other via a pipeline, you can transfer data from Salesforce to your marketing system, and back again, using a Xplenty data pipeline. Our data pipeline allows you to select customers by any criteria stored in Salesforce, such as geographic location or products purchased.
Backup — Xplenty supports inexpensive cloud storage solutions like Amazon S3 and Google Cloud, so you can use a pipeline to push your data into cloud storage for a robust backup that won’t break the bank.
These are just a few of the possible use cases of Xplenty to enhance the capabilities of Heroku Connect.
Native Salesforce integration
While Heroku Connect’s near real-time connection to Salesforce is a powerful and compelling capability for a number of applications, it may be more than your organization needs for other common uses of Salesforce data.
Say, for instance, that you have a Salesforce custom object that stores data that is analyzed monthly or quarterly by your organization. Instead of keeping that data in a “live” state in the Heroku Postgres database, you can just as easily extract it directly from Salesforce using an Xplenty data pipeline. If your custom object is related to other data stored in Heroku Connect, your Xplenty pipeline can access that data in parallel with data stored in the Postgres database, and push that data into your analytic database. This allows you to use Heroku Connect for the data that you analyze regularly, while saving on Heroku and Salesforce cycles for rarely studied information.
Conclusion
Heroku and Xplenty make it easy to integrate many systems to and from Salesforce in near real time or in batch. A free trial of the Xplenty Heroku Add-on is available to help you explore further.
The post Salesforce Integration: Xplenty and Heroku Connect appeared first on Heroku.
]]>What felt like a sinking moment turned into more than a lifeline for the fledgling business — it entirely transformed their business model. In the year that followed the Shark Tank episode, Zoobean went from a consumer subscription service to an enterprise reading…
The post How a Shark Tank Pitch Led Zoobean’s Founders in an Unexpected Direction appeared first on Heroku.
]]>What felt like a sinking moment turned into more than a lifeline for the fledgling business — it entirely transformed their business model. In the year that followed the Shark Tank episode, Zoobean went from a consumer subscription service to an enterprise reading program platform loved by millions of readers of all ages.

From the mouths of babes to the scrutiny of sharks
Zoobean began in the simplest way: with a child’s comment. Felix and Jordan were looking for children’s books that could help their two-year-old son learn how to be a big brother, and they came across a book that featured an interracial, interfaith family like their own. For the first time, their son immediately recognized his own family in the pictures: “That’s mommy. That’s daddy. That’s me.” Felix recalls that pivotal moment: “We felt that everyone should have this experience of seeing themselves in a book. The problem was finding those books.”
Felix and Jordan set about solving that problem, and in 2013, Zoobean was born. The company’s mission was to help people discover books that were right for their family. To jumpstart the business, the couple participated in a weekend competition run by NewME, an entrepreneurship program for founders who were people of color and/or women. Zoobean won the competition and NewME featured the startup across its social channels.
What happened next was an entrepreneur’s dream come true. Felix and Jordan received a random email from a producer with Shark Tank — a show that could introduce their new service to the nation. Felix had been a long-time fan of the show from its early days, and he couldn’t believe his luck. “It was surreal,” he says. “The email came from a gmail address, so we didn’t believe it at first. We looked him up on IMDb before calling him.” Two months later, the couple were on the Shark Tank set in Hollywood.
The drama of the Shark Tank pitch
When Felix and Jordan arrived on set, it looked and felt like the familiar show — that is, until taping started. It was chaotic: everyone talked at once, the sharks made snide comments, and the entrepreneurs were struggling to hold their own. It was nothing like the edited version that appears on TV. “At one point, though,” says Felix, “it just felt like any conversation where you’re trying to pitch your business. But it was almost better, because we knew it would end with a “yes” or “no” rather than be left in limbo.”
However, their answer did not come easily. The founders received heavy critique for the modest size of Zoobean’s customer base at the time, and the company’s business category also lacked definition, which sparked heated debate between the sharks. Although Zoobean’s focus was on sending books to monthly subscribers, Mark Cuban insisted that it was actually a technology company. Kevin O’Leary argued that Zoobean was a marketing company that “sent people things in a box.” In the end, Mark Cuban would be proven right.
The Shark Tank experience was tough on Felix and Jordan, but they walked away with two invaluable wins. One was a “yes” from Mark Cuban, who invested $250k in the startup. “It was actually a benefit that we were so early in our business,” says Felix. “Mark seemed to understand and appreciate where we were with it.” The second was their new investor’s insight — maybe Zoobean really was a tech company? Felix and Jordan began to think more about their software’s potential and less about growing subscriptions.
Getting ready for scale at prime time
Once Mark Cuban decided to invest in Zoobean, Felix and Jordan teamed up with Tyler Ewing to lead technical development. The initial site had been built on Heroku by an agency, and when Tyler took the reins, he started by focusing on scalability. The Zoobean team didn’t know exactly when their episode would be aired, and they wanted to be ready for a surge in traffic to the site at showtime.
Zoobean’s Heroku technical account manager walked Tyler through the process of monitoring performance and scaling dynos on Heroku, as well as load testing and making any modifications needed. They were storing data in Heroku Postgres and background jobs in the Heroku Add-on Redis to Go, using Sidekiq to process background jobs asynchronously. Caching data using the MemCachier add-on also helped enable scale.
Another startup had experienced a crash during their Shark Tank episode, and the team was determined to avoid that scenario at all costs. Tyler load tested four times more traffic than expected — close to 200,000 requests per minute — and the site handled it well. Zoobean was ready.
Monitoring web traffic during the show
On April 18, 2014, six weeks after taping, the Zoobean episode aired. Sure enough, the expected traffic spike happened right when Felix and Jordan came on set and in the 15 minutes that followed. Throughout the show, Tyler kept a close eye on the Heroku Dashboard, as well as performance metrics coming in from Heroku Add-ons New Relic APM and Librato. “I think anytime you see that amount of traffic hit your site all of a sudden,” Tyler says, “it's always going to be scary.”
To help allay his fears, their Heroku technical account manager had set up a channel on HipChat so that he could be available to help Tyler troubleshoot if needed. This allowed the whole team to relax a bit knowing that they wouldn’t have to scramble to try and get support in the moment.
After the show aired on the East Coast, there was a second spike later that evening from West Coast viewers. Much to the team’s relief, the site held steady throughout with no issues, even as close to 25,000 concurrent users were eagerly exploring Zoobean as they watched Felix and Jordan pitch the business on TV.
Feedback leads to business transformation
For many startups, an appearance on Shark Tank results in millions of dollars in sales. For Zoobean, it was the opposite. The show sparked a tremendous amount of interest in the company, but sales were disappointing — yet another indicator that the business model needed a course correction. Undaunted, the founders responded quickly, which ultimately saved them time, energy, and resources. Felix says: “Our Shark Tank experience allowed us to see what wasn’t working. It would have otherwise taken us months, or maybe more, to figure that out.”
By the time the show aired, the startup had already begun to pivot. Zoobean was still focused on consumers, but it now included a personalized book recommendation system, which put more focus on the technology and app experience than on shipping books.
Soon, Zoobean was getting attention from libraries across the country, which opened entirely new opportunities for the business. The team worked with the Sacramento Public Library to develop a version of the app that allowed the library to recommend books in its collection to members. As more and more libraries followed suit, new ideas emerged, and Zoobean evolved even further. The team saw an unexpected spike in use from one library and discovered that it was using the app to run a summer reading program. They began promptly adding new features, such as tracking and incentives, that enabled libraries to engage readers in reading challenges.
The result was their flagship product Beanstack, a customizable reading challenge platform for libraries, schools, colleges and universities, and corporations. “That’s really where the business has grown,” says Felix. “Recommendations are still important, but we’re now more focused on motivating groups if readers of all ages to read more.”

Today, Zoobean is home to millions of readers
Seven years after Shark Tank, Zoobean is a thriving company that serves over 1,900 library systems (representing 10,000 library branches), 1,200 schools, and three million readers. It’s business model is now primarily enterprise-focused, but the company’s core mission remains the same: helping kids become lifelong readers. This continually inspires new, innovative ideas to make an impact, such as extending the challenge model to support reading fundraisers, where students can raise money for their school by reading. In another new direction, companies are using Beanstack to run team-building programs based on shared reading experiences.
Zoobean is also looking towards expanding Beanstack internationally and recently launched in Canada. To support Canadian data residency requirements, the team worked with Heroku to connect an AWS database in Canada to their Heroku Private Space using PrivateLink. “We're just really comfortable with Heroku,” says Tyler. “We didn't want to have to find another solution from a company in Canada or someone else. We wanted to try to keep as much consistent as possible, and Private Spaces offered us the way to do it.”
As Felix and Jordan look back on their journey, one thing is clear. The Shark Tank experience was the springboard to Zoobean’s success, and they are “eternally grateful to be a part of the Shark Tank family.”
The post How a Shark Tank Pitch Led Zoobean’s Founders in an Unexpected Direction appeared first on Heroku.
]]>Customer Trust is our highest priority at Salesforce and Heroku. It’s more important than ever to implement stronger security measures in light of increasing security threats that could affect services and apps that are critical to businesses and communities.
We’re pleased to announce that all Heroku customers can now take advantage of the security offered by Multi-Factor Authentication (MFA) . We encourage you to check out these new MFA features and add another layer of protection to your account by enabling MFA.
As we announced in February 2021, all Salesforce customers are required to enable…
The post Enhancing Security – MFA with More Options, Now Available for All Heroku Customers appeared first on Heroku.
]]>
Customer Trust is our highest priority at Salesforce and Heroku. It’s more important than ever to implement stronger security measures in light of increasing security threats that could affect services and apps that are critical to businesses and communities.
We’re pleased to announce that all Heroku customers can now take advantage of the security offered by Multi-Factor Authentication (MFA). We encourage you to check out these new MFA features and add another layer of protection to your account by enabling MFA.
As we announced in February 2021, all Salesforce customers are required to enable MFA starting Feb 1, 2022. There’s no reason to wait – it takes a couple of simple steps to enable MFA when prompted on your next login or from your Account Settings.
Heroku MFA – More Options, Better Security
You may be already familiar with Heroku 2FA using TOTP based code generator apps. Like 2FA, MFA requires an additional verification method after you enter your password. To meet your needs, we support several types of strong verification methods.
You can take advantage of push notifications and automatic verification from trusted locations for fast, frictionless MFA using Salesforce Authenticator as a verification method. You can also use WebAuthn security keys and on-device biometrics as verification methods. TOTP based code generator apps are also available. You don’t even need to limit yourself to just one type of verification method – use recovery codes or additional verification methods to always have a backup.
We are no longer offering SMS as a verification method for MFA due to Security risks associated with the use of SMS. If you had enabled Heroku 2FA in the past using a code generator app, you don’t need to take any further action to enable MFA. Your code generator app and any recovery codes will continue to work as MFA verification methods. Previously configured 2FA backup phone numbers will be usable for a limited time.
Check out Dev Center for additional details about MFA.
More Frequent Re-authentication
As part of our ongoing security improvements, we are changing how long users can stay logged in on the Heroku Dashboard. Starting in April 2021, all users that are not using SSO will be required to log in every 12 hours.
As always, SSO enabled users need to log in through their identity provider every 8 hours.
Coming Soon
Keep an eye on this space for more news in the coming months as we make it easier to use MFA for your teams and continue to make other improvements.
As always, we’d love to hear from you.
The post Enhancing Security – MFA with More Options, Now Available for All Heroku Customers appeared first on Heroku.
]]>The New Way: Snapshots for Heroku Data …
The post Announcing Heroku Postgres Enhancements: 40x Faster Backups appeared first on Heroku.
]]>
Today, we’re thrilled to announce backups of Heroku Postgres are now 40x faster by leveraging Snapshots in place of base backups. We’ve been hard at work focused on improving performance, speed, and capacity for the Heroku Data services you rely on. In the past forks and follows of a Premium-8 test database with 992 GB of data took 22 hours; now with Snapshots, the same process is reduced to 10 minutes. This makes the creation of forks and followers, and restoring the database, faster than ever, at no additional charge.
The New Way: Snapshots for Heroku Data
In November 2020 we introduced a performance improvement to our physical backup and restore functionality for our Heroku Postgres customers. We now take snapshots in place of base backups. When we restore, we restore instances using the last snapshot taken. WAL replay from that point is still as before (using WAL-E).
- Forks and followers creation that used take sometimes up to 24 hours, now can take under 30 minutes
- The gap in HA availability during failovers or follower promotion that used to take anywhere up to 12 hours now takes under 15 minutes
Snapshots are faster than base backups, occur at the storage level, and are incremental so we can take them more frequently.
Overall, this means restoring a database is much faster now. Now with Snapshots, the rate at which we capture is dynamic. For average or low change databases we try to capture at least every 24 hours. For databases that change more frequently, however, we capture more frequently. Restoring to a snapshot that is closest to the transaction we want to restore to means less WAL replay, and a lower mean-time-to-restore.
The Old Way: Backups Was Not Built for Speed
In the past backups of Heroku Postgres relied on a WAL-E for primary backup and restoration. WAL-E is a convenience wrapper for the two conceptual parts required for disaster recovery in a PostgreSQL world:
- Base backups are required when a database is first created. This is a copy of the full existing state of the database at the time it was taken.
- WAL records are changes to the database that can be archived elsewhere, using WAL records. These are smaller pieces of data that reflect changes to a database on a low level.
To replay or restore a PostgreSQL service, we used to restore from a base backup first, then replay the WAL previously archived until the closest possible restore point is achieved. The combined processes of base backups and WAL record changes means it can take a long time to upload when new backups are made, and a long time to restore, which includes downloading the base backup from servers and replaying WAL record changes between base backups. You can read more about this backup and restore methodology in our Dev Center article on Heroku Postgres Data Safety and Continuous Protection. But clearly, this process was not built for speed, so we made it better!
Feedback Welcome
Snapshots are one of many improvements we’re making to improve your experience with Heroku Data Services. We’d love to hear from you on how this enhancement improves your workflow.
The post Announcing Heroku Postgres Enhancements: 40x Faster Backups appeared first on Heroku.
]]>As applications become more complex, so do the data requirements to support them. At Heroku we have been working hard on enabling these workloads, while maintaining the same level of abstraction, developer experience, and compliance you’ve come to expect.
Today, we’re excited to announce new, larger Heroku Postgres Plans . These new plans will allow for applications on the Heroku Platform to expand in data size and complexity. The new plans in the Heroku Postgres offering have generous resource allocations, providing the horsepower to power today’s most demanding workloads. These plans come with 768 GB of…
The post Announcing Larger Heroku Postgres Plans: More Power, More Storage appeared first on Heroku.
]]>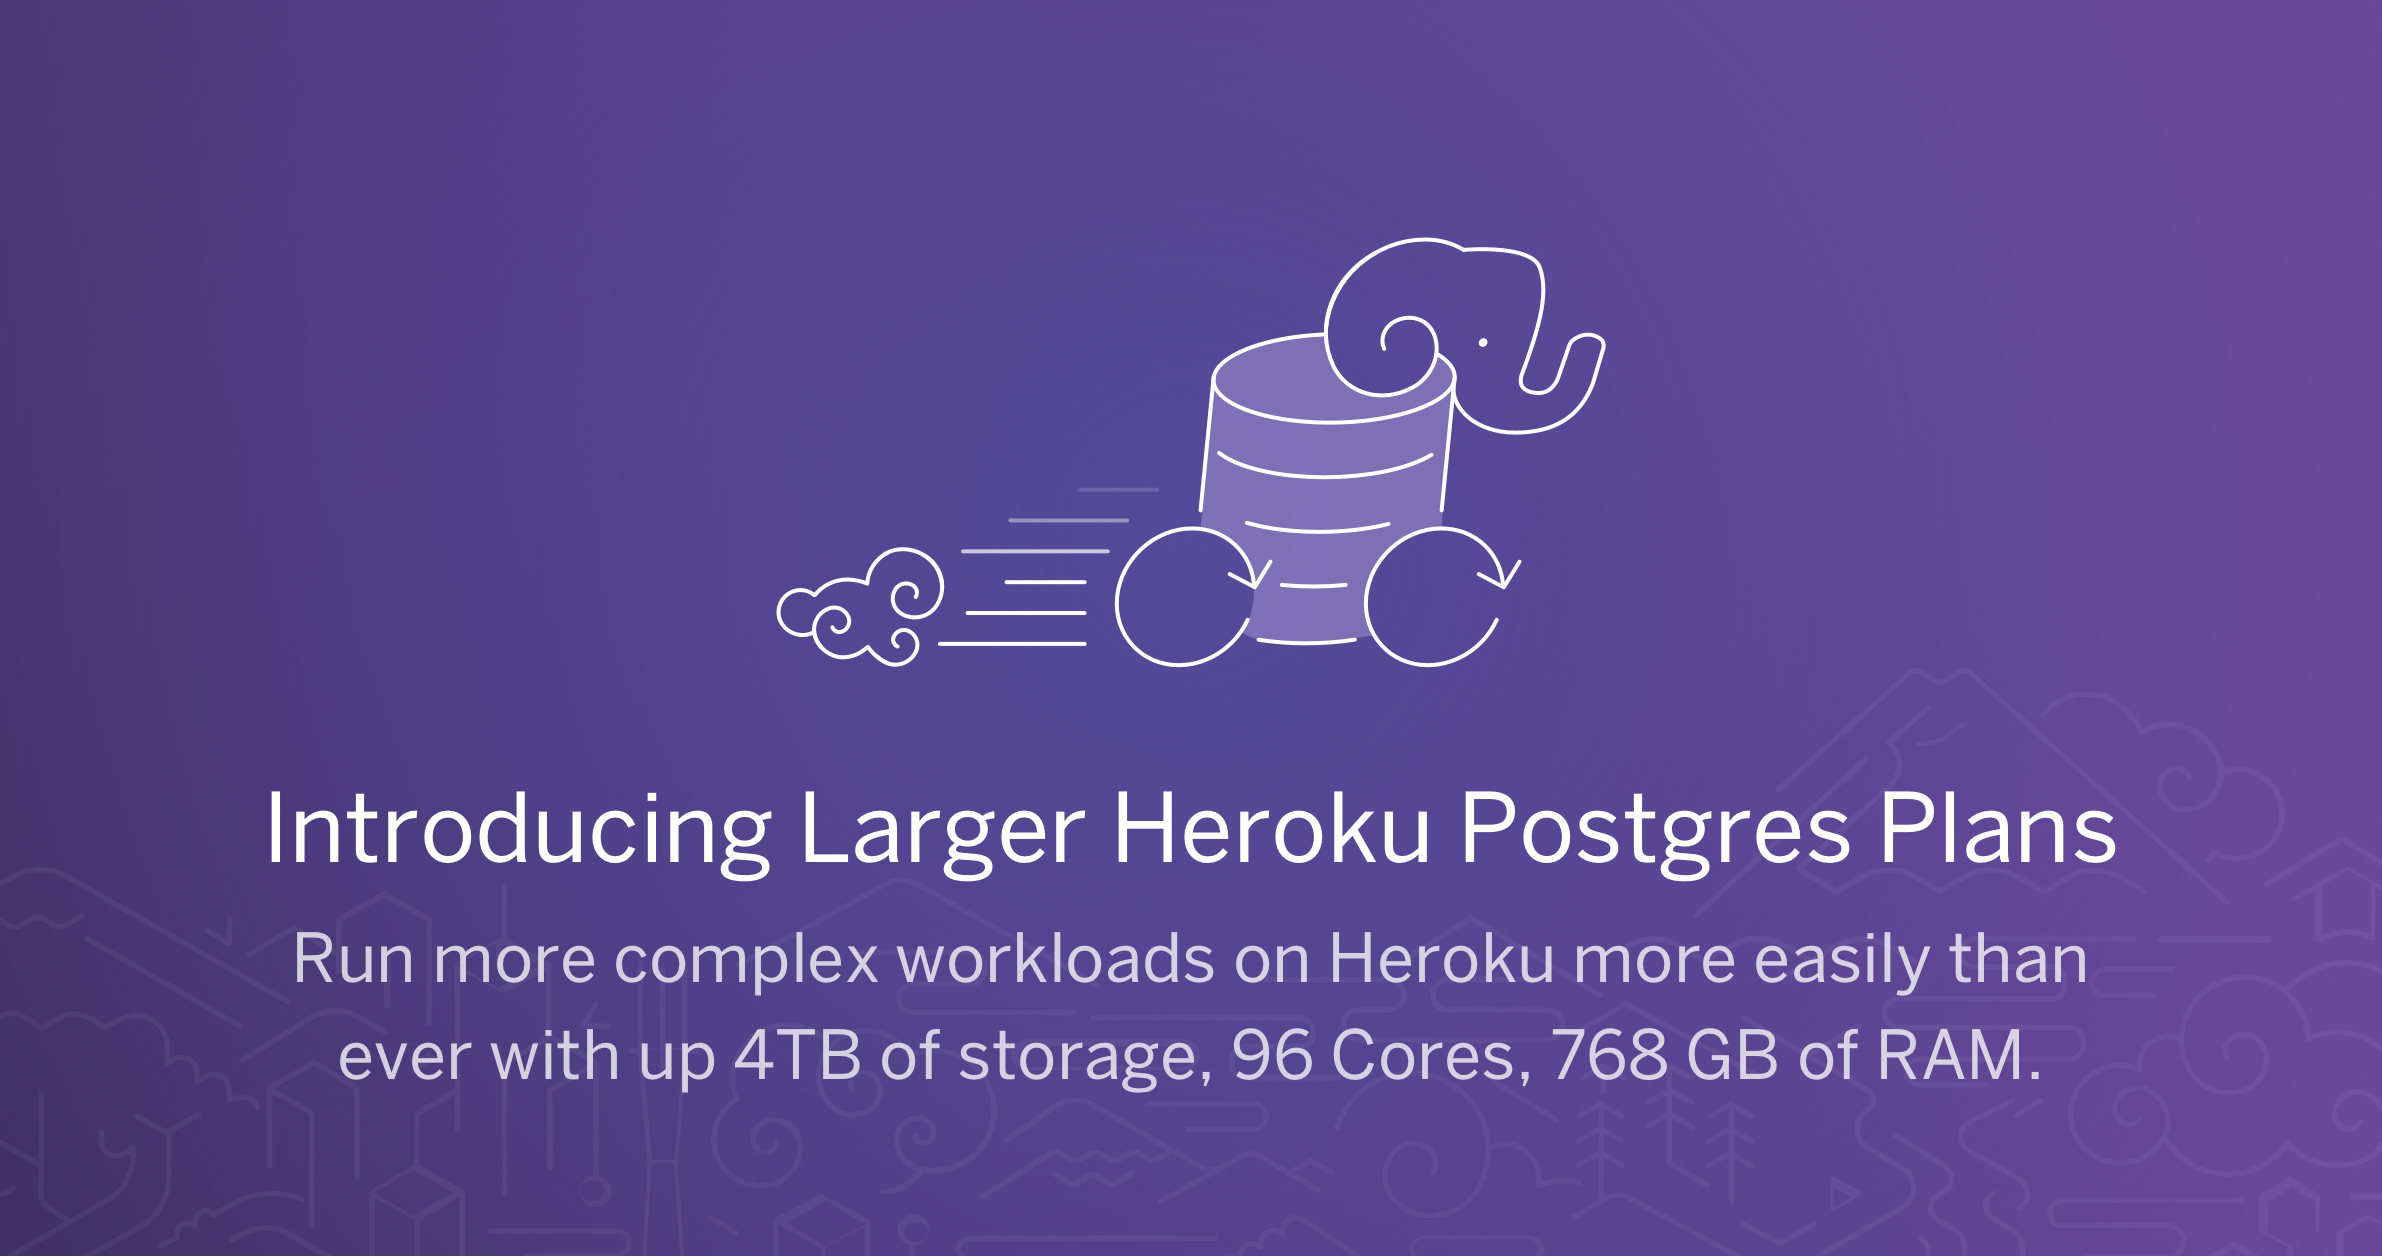
As applications become more complex, so do the data requirements to support them. At Heroku we have been working hard on enabling these workloads, while maintaining the same level of abstraction, developer experience, and compliance you’ve come to expect.
Today, we’re excited to announce new, larger Heroku Postgres Plans. These new plans will allow for applications on the Heroku Platform to expand in data size and complexity. The new plans in the Heroku Postgres offering have generous resource allocations, providing the horsepower to power today’s most demanding workloads. These plans come with 768 GB of RAM, 96 Cores and up to 4TB of storage, and are available on the Common Runtime, Private Spaces, and Heroku Shield, starting at $5800 per month.
New Larger Plans
These new larger plans introduce larger database sizes with more generous resource allocations, further expanding our existing plan line up to help your applications and data scale more smoothly.
This new level 9 plan is available for Production-ready Postgres with our Standard tier, critical applications with our Premium tier, as well as with our Private Spaces-compatible Private and Shield tiers.
| Plan levels * | RAM | Provisioned I/O
per second
|
Disk size |
|---|---|---|---|
| 0 | 4 GB | 200 | 68 GB |
| 2 | 8 GB | 200 | 256 GB |
| 3 | 15 GB | 1000 | 512 GB |
| 4 | 30 GB | 2000 | 768 GB |
| 5 | 61 GB | 4000 | 1 TB |
| 6 | 122 GB | 6000 | 1.5 TB |
| 7 | 244 GB | 9000 | 2 TB |
| 8 | 488 GB | 12000 | 3 TB |
| 9 | 768 GB | 16000 | 4 TB |
| * Applies to Standard, Premium, Private, Shield tiers | |||
You can learn more about the technical specifications of each plan – and what would best suit your needs – on our list of Heroku Postgres plans and our Dev Center article on choosing the right Heroku Postgres plan.
More Power, More Storage
Talking to customers, we have heard a need to access very large and complex datasets in Postgres. Whether it is enabling data visibility across many Salesforce orgs, using Postgres as an operational data store, or powering analytically-focused workloads for large-scale querying, the new Postgres plans will allow applications on Heroku to easily scale further.
Getting Started
If you have an existing Heroku Postgres database that is on a level 6,7, or 8 plan, there are a few simple options to upgrade to a level 9 plan; please see our Changing the Plan or Infrastructure of a Heroku Postgres Database Dev Center article for how to do this.
If you are provisioning a new database with a level 9 plan, it’s as simple as
$ heroku addons:create heroku-postgresql:standard-9
Starting today, these plans are available directly from the Elements Marketplace.
The post Announcing Larger Heroku Postgres Plans: More Power, More Storage appeared first on Heroku.
]]>Often, innovation sparks innovation in unforeseen ways. In the early 1950’s, television brought the world an entirely new experience that not only changed people’s daily lives, but also created a unique platform for national culture. One of the most beloved and enduring traditions that emerged on this new national stage was the telethon. A combination of “television” and “marathon,” a telethon is a broadcast…
The post An Iconic Fundraising Tradition Returns with a 21st Century Twist appeared first on Heroku.
]]>Often, innovation sparks innovation in unforeseen ways. In the early 1950’s, television brought the world an entirely new experience that not only changed people’s daily lives, but also created a unique platform for national culture. One of the most beloved and enduring traditions that emerged on this new national stage was the telethon. A combination of “television” and “marathon,” a telethon is a broadcast fundraising event that lasts for several hours or days and features entertainment interspersed with a call for donations.
America’s most iconic, and longest-running, event was the Jerry Lewis MDA Labor Day Telethon run on behalf of the Muscular Dystrophy Association (MDA). In 1952, the comedian began hosting an annual Thanksgiving telethon for the charity’s New York chapter, and in 1966, the event moved to Labor Day weekend and went national. When it was discontinued in 2015 (just one year shy of its 50th anniversary), Jerry Lewis and his telethon crew had raised more than two billion dollars for the MDA. Over the years, the once-novel platform of television became an important catalyst for transforming the lives of people suffering from this heartbreaking disease.
A new definition of “telethon”
The fight against neuromuscular diseases continues, and in 2020, there is still no cure. Fundraising is still a top priority for the MDA, and to develop their next strategy, the organization first looked to its past successes. However, the world has changed dramatically in fifty years. The epicenter of national culture has moved away from broadcast television and onto a plethora of social media platforms. Could the telethon format be adapted to fit this fragmented landscape and engage a new generation of donors?
Thanks to the collective efforts of a number of celebrities and technology providers, the MDA ran an all-new telethon this past October. Hosted by another popular comedian, the MDA Kevin Hart Kids Telethon was a two-hour event that streamed across multiple platforms and included comedy, music, gaming, an afterparty, and more. The event did indeed spark engagement and generosity — it raised a whopping $10.5 million to support the MDA, as well as Kevin Hart’s own charity, Help From the Hart.
From phone bank to multi-platform donation engine
During a Jerry Lewis telethon, an army of volunteers would man the event’s phone lines as people called in to pledge their donations. This time, an all-digital approach needed to pull together a more complex framework, as well as help scale beyond the impressive reach of the old format.
A live, multi-stream, interactive event requires the careful orchestration of many different technologies and services. During the weeks leading up to the telethon, the event team worked with fundraising platforms DonorDrive and Tiltify to develop and launch a number of online campaigns, as well as collect donations. To track the funds that flowed in from various sources, the MDA needed a data dashboard that would give them a unified view of activity and allow them to analyze and leverage the data. Their requirements included the ability to:
- Aggregate fundraising data from both DonorDrive and Tiltify to create a single source of truth.
- Track donations by channel to understand where donors were engaging with the event.
- Group donations by location and team in order to present combined fundraising results.
- Display real-time data on the telethon website showing the total funds raised, the amount received per location, and leaderboards for contributions by individuals and groups.

Data fuels the digital telethon
Building the telethon’s data system was truly a collaborative effort between the MDA, Salesforce, and Xplenty engineering teams. They deployed an app on Heroku that aggregated data in Heroku Postgres to create a single source of truth. A key part of this process was handled by Xplenty's data integration service. Xplenty provided a data pipeline tool to extract data from DonorDrive and Tiltify into Postgres, as well as an on-platform transformation layer to prepare the data for display. The team then used Xplenty to automatically run the processes on a set schedule that updated the Heroku Postgres instance in near real-time.
With the data system set up, the team could then build ways to use it. They created an internal reporting and analytics dashboard to track and access data as needed. These insights helped the organization understand which promotional campaigns were effective and where they may want to focus their efforts during future fundraising campaigns.
The telethon website also displayed real-time donation numbers during the event to help keep everyone energized and engaged with MDA’s goals. MDA engineers used Tableau to present data in a visually attractive way that was also easy for anyone to digest. Prospective donors would see exactly where their gift would fall on the leaderboards, potentially inspiring them to donate more.

Teamwork makes the dream work
The Jerry Lewis telethon was made possible by a wide network of local TV stations — dubbed “the Love Network” by the MDA — which, at its peak, included 213 stations across the country. Today, the organization is working with a new set of partners, but the spirit of teamwork for a great cause remains the same. A close collaboration enabled the MDA to get a first social media telethon under their belt, and they can now create a repeatable format that breathes new life into this traditional event for years to come.
The MDA’s partners can also scale their learnings to achieve even greater impact. Thanks to the MDA experience, Xplenty can now offer DonorDrive and Tiltify pipeline templates to other charities interested in creating a single source of truth for their fundraising efforts.
The post An Iconic Fundraising Tradition Returns with a 21st Century Twist appeared first on Heroku.
]]>Over the years, one of the factors that you have to consider when scaling applications is pressure on the database. Each connection to the database consumes resources that could be spent on processing requests. The balancing of resources spent…
The post Connection Pooling for Heroku Postgres Is Now Generally Available appeared first on Heroku.
]]>
Over the years, one of the factors that you have to consider when scaling applications is pressure on the database. Each connection to the database consumes resources that could be spent on processing requests. The balancing of resources spent on connections and processing is a delicate one that Heroku Engineering has had years of experience with. However, applications keep growing in complexity, with patterns like microservices and pure scale pushing the limits.
Getting Started
Connection Pooling is a managed version of PgBouncer on the database server, which maintains its own connection pool. PgBouncer directs queries to already open database connections, reducing the frequency with which new processes are created on your database server.
It’s as easy as heroku pg:connection-pooling:attach to set up Connection Pooling for Heroku Postgres. See the documentation for more detail.
Feedback Welcome
Connection Pooling opens new abilities to leverage Heroku Postgres at scale, and in more complex architectures.
The post Connection Pooling for Heroku Postgres Is Now Generally Available appeared first on Heroku.
]]>Yarn is a package manager that also provides developers a project management toolset. Now, Yarn 2 is now officially supported by Heroku, and Heroku developers are able to take advantage of leveraging zero-installs during their Node.js builds. We’ll go over a popular use case for Yarn that is enhanced…
The post Building a Monorepo with Yarn 2 appeared first on Heroku.
]]>
Yarn is a package manager that also provides developers a project management toolset. Now, Yarn 2 is now officially supported by Heroku, and Heroku developers are able to take advantage of leveraging zero-installs during their Node.js builds. We’ll go over a popular use case for Yarn that is enhanced by Yarn 2: using workspaces to manage dependencies for your monorepo.
We will cover taking advantage of Yarn 2’s cache to manage monorepo dependencies. Prerequisites for this include a development environment with Node installed. To follow these guides, set up an existing Node project that makes use of a package.json too. If you don’t have one, use the Heroku Getting Started with Node.js Project.
Workspaces
First off, what are workspaces? Workspaces is Yarn’s solution to a monorepo structure for a JavaScript app or Node.js project. A monorepo refers to a project, in this case, a JavaScript project, that has more than one section of the code base. For example, you may have the following set up:
/app
 - package.json
 - /server
   - package.json
 - /ui
   - package.json
Your JavaScript server has source code, but there’s an additional front end application that will be built and made available to users separately. This is a popular pattern for setting up a separation of concerns with a custom API client, a build or testing tool, or something else that may not have a place in the application logic. Each of the subdirectory’s package.json will have their own dependencies. How can we manage them? How do we optimize caching? This is where Yarn workspaces comes in.
In the root package.json, set up the subdirectories under the workspaces key. You should add this to your package.json:
"workspaces": [
    "server",
    "ui"
]
For more on workspaces, visit here: https://yarnpkg.com/features/workspaces
Additionally, add the workspaces-tools plugin. This will be useful when running workspace scripts that you’ll use later. You can do this by running:
yarn plugin import workspace-tools
Setting up Yarn
If you’re already using Yarn, you have a yarn.lock file already checked into your code base’s git repository. There’s other files and directories that you’ll need up to set up the cache. If you aren’t already using Yarn, install it globally.
npm install -g yarn
Note: If you don’t have Yarn >=1.22.10 installed on your computer, update it with the same install command.
Next, set up your Yarn version for this code base. One of the benefits of using Yarn 2 is that you’ll have a checked in Yarn binary that will be used by anyone that works on this code base and eliminates version conflicts between environments.
yarn set version berry
A .yarn directory and .yarnrc.yml file will both be created that need to be checked into git. These are the files that will set up your project’s local Yarn instance.
Setting Up the Dependency Cache
Once Yarn is set up, you can set up your cache. Run yarn install:
yarn
Before anything else, make sure to add the following to the .gitignore:
# Yarn
.yarn/*
!.yarn/cache
!.yarn/releases
!.yarn/plugins
!.yarn/sdks
!.yarn/versions
The files that are ignored will be machine specific, and the remaining files you’ll want to check in. If you run git status, you’ll see the following:
Untracked files:
  (use "git add <file>..." to include in what will be committed)
    .gitignore
    .pnp.js
    .yarn/cache/
    yarn.lock
You’ve created new files that will speed up your install process:
.pnp.js– This is the Plug’n’Play (PnP) file. The PnP file tells your Node app or build how to find the dependencies that are stored in.yarn/cache..yarn/cache– This directory will have the dependencies that are needed to run and build your app.yarn.lock– The lock file still is used to lock the versions that are resolved from thepackage.json.
Check all of this in to git, and you’re set. For more information about Yarn 2’s zero-install philosophy, read here: https://yarnpkg.com/features/zero-installs
Adding Dependencies to Subdirectories
Now that Yarn and the cache are set up, we can start adding dependencies. As initially shown, we have a server directory and a ui directory. We can assume that each of these will be built and hosted differently. For example, my server is written in TypeScript, using Express.js for routing, and running on a Heroku web dyno. For the front end app, it is using Next.js. The build will be run during the app’s build process.
Add express to the server dependencies.
yarn workspace server add express
Additionally, add @types/express and typescript to the devDependencies. You can use the -D flag to indicate that you’re adding devDependencies.
yarn workspace server add @types/express typescript -D
We now have our dependencies in our server workspace. We just need to create our ui workspace. Next, build a Next.js app with the yarn create command.
yarn create next-app ui
Finally, run yarn again to update the cache and check these changes into git.
Running Scripts with Workspaces
The last piece is to run scripts within the workspaces. If you look through your source code, you’ll see that there’s one global cache for all dependencies under your app’s root directory. Run the following to see all the compressed dependencies:
ls .yarn/cache
Now, lets run build scripts with workspaces. First, set up the workspace. For server, use tsc to build the TypeScript app. You’ll need to set up a TypeScript config and a .ts file first:
cd server
yarn dlx --package typescript tsc --init
touch index.ts
yarn dlx will run a command from a package so that it doesn’t need to be installed globally. It’s useful for one-off initializing commands, like initializing a TypeScript app.
Next, add the build step to the server/package.json.
"scripts": {
    "build": "tsc",
    "start": "node index.js"
},
Change directories back to the application level, and run the build.
cd ..
yarn workspace server build
You’ll see that a server/index.js file is created. Add server/*.js to the .gitignore.
Since we already have build and start scripts in our Next.js app (created by the yarn create command), add a build script at the root level package.json.
"scripts": {
    "build": "yarn workspaces foreach run build"
},
This is when the workspaces-tool plugin is used. Run yarn build from your app’s root, and both of your workspaces will build. Open a second terminal, and you’ll be able to run yarn workspace server start and yarn workspace ui start in each terminal and run the Express and Next servers in parallel.
Deploy to Heroku
Finally, we can deploy our code to Heroku. Since Heroku will run the script is in the package.json under start, add a script to the package.json.
"scripts": {
    "build": "yarn workspaces foreach run build",
    "start": "yarn workspaces server start"
},
Heroku will use the start script from the package.json to start the web process on your app.
Conclusion
There are plenty more features that Yarn, and specifically Yarn 2, offers that are useful for Heroku developers. Check out the Yarn docs to see if there are additional workspace features that may work nicely with Heroku integration. As always, if you have any feedback or issues, please open an Issue on GitHub.
The post Building a Monorepo with Yarn 2 appeared first on Heroku.
]]>Expanding the event-driven architecture of…
The post Extend Flows with Heroku Compute: An Event-Driven Pattern appeared first on Heroku.
]]>Event-driven application architectures have proven to be effective for implementing enterprise solutions using loosely coupled services that interact by exchanging asynchronous events. Salesforce enables event-driven architectures (EDAs) with Platform Events and Change Data Capture (CDC) events as well as triggers and Apex callouts, which makes the Salesforce Platform a great way to build all of your digital customer experiences. This post is the first in a series that covers various EDA patterns, considerations for using them, and examples deployed on the Salesforce Platform.
Expanding the event-driven architecture of the Salesforce Platform
Back in April, Frank Caron wrote a blog post describing the power of EDAs. In it, he covered the event-driven approach and the benefits of loosely coupled service interactions. He focused mainly on use cases where events triggered actions across platform services as well as how incorporating third-party external services can greatly expand the power of applications developed using declarative low-code tools like Salesforce Flow.
As powerful as flows can be for accessing third-party services, even greater power comes when your own custom applications, running your own business logic on the Salesforce Platform, are part of flows.
API-first, event-driven design is the kind of development that frequently requires collaboration across different members of you team. Low-code builders with domain expertise who are familiar with the business requirements can build the flows. Programmers are typically necessary to develop the back-end services that implement the business logic. An enterprise architect may get involved as well to design the service APIs.
However you are organized, you will need to expose your services with APIs and enable them to produce and consume events. The Salesforce Platform enables this with the Salesforce Event Bus, Salesforce Functions, and Streaming API as well as support for OpenAPI specification for external services.
Heroku capabilities on the Salesforce Platform include event streaming, relational data stores, and key-value caches seamlessly integrated with elastic compute. These capabilities, combined with deployment automation and hands-off operational excellence, lets your developers focus entirely on delivering your unique business requirements. Seamless integration with the rest of Salesforce makes your apps deployed on Heroku the foundation for complete, compelling, economical, secure, and successful solutions.
This post focuses on expanding flows with Heroku compute. Specifically, how to expose Heroku apps as external services and securely access them via flows using Flow Builder as the low-code development environment. Subsequent posts will expand this idea to include event-driven interactions between Heroku apps and the rest of the Salesforce Platform as well as other examples of how Salesforce Platform based EDAs address common challenges we see across many of our customers including:
- Multi-organization visibility and reporting
- Shared event bus designs
- B2C apps with Lightning Web Components
Building Salesforce flows with your own business logic
Salesforce external services are a great way to access third-party services from a flow. All you need are the services’ OpenAPI spec schema (OAS schema), and you’re set to go. There are some great examples of how to register your external services here, with a more detailed example of how to generate an Apex client and explore your schema here.
But what if you want to incorporate custom business logic into your flow app? What if you wanted to extend and complement the declarative programming model of flows with an imperative model with full programming semantics? What if you wanted to make your app available to flow developers in other organizations, or possibly accessed as a stand-alone service behind a Lightning Web Components based app?
This kind of service deployment typically requires off-platform development, bringing with it all the complexity and operational overhead that goes with meeting the scalability, availability, and reliability requirements of your business critical apps.
The following steps show you how you can deploy your own apps using Heroku on the Salesforce Platform without any of this operational overhead. We’re going to walk through an example of how to build and deploy custom business logic into your own service and access it in a flow. Deployment will be via a Heroku app, which brings the power and flexibility to write your own code, without having to worry about the operational burden of production app deployment or DevOps toolchains.
This approach works well in scenarios where you have programmers and low-code builders working together to deploy a new app. The team first collaborates on what the app needs to do and defines the API that a flow can access. Once the API is designed, this specification then becomes the contract between the two teams. As progress is made on each side, they iterate, perfect their design, and ultimately deliver the app.
Note: Apex is a great way to customize Salesforce, but there are times when a standalone app might be the better way to go. If your team prefers Python, Node, or some other programming language, or perhaps you already have an app running on premises or in the cloud, and you want to run it all within the secure perimeter of the Salesforce Platform, a standalone Heroku app is the way to go.
API spec defines the interface
The example application an on-line shopping site that lets users login, browse products, and make a purchase. We’ll describe the process of building out this app in a number of posts, but for this first part we’ll simply build a flow and an external service that lists products and updates inventory in Salesforce. For the API, we’re using a sample API available on Swagger Hub. There are a variety of tools and systems that can do this, including the MuleSoft Anypoint Platform API Designer. For this example, however, we’re using this simple shopping cart spec to bootstrap the API design and provide the initial application stub for development.
From the API spec, API Portals can produce server side application stubs to jumpstart application development. In this example, we’ve downloaded the node.js API stub as the starting point for API and app development. We’ve also modified the code so that it can run on Heroku by adding a Procfile and changing the port configuration.
Let’s begin by looking at the initial API spec for the application. These API docs are being served from a deployment of the app stub on Heroku.

As you can see in the spec, there are definitions for each of the methods that specify which parameters are required and what the response payload will look like. Since this is a valid OpenAPI spec, we can register this API as an external service as described in Get Started with External Services.
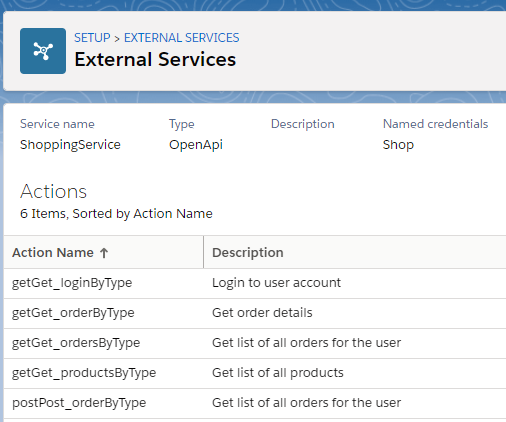
External service authorization
The flow needs a Named Credential in Salesforce to access the external service. Salesforce offers many alternatives for how the app can use the Named Credential including per-user credentials that can help you track and control access. For this example, though, we’re going to use a single login for all flow access using basic HTTP authentication.

App access to the organization is authorized via a Salesforce JWT account token and implemented in the app in SFAuthService.js:
'use strict';

const jwt = require('salesforce-jwt-bearer-token-flow');
const jsforce = require('jsforce');

require('dotenv').config();

const { SF_CONSUMER_KEY, SF_USERNAME, SF_LOGIN_URL } = process.env;

let SF_PRIVATE_KEY = process.env.SF_PRIVATE_KEY;
if (!SF_PRIVATE_KEY) {
    SF_PRIVATE_KEY = require('fs').readFileSync('private.pem').toString('utf8');
}

exports.getSalesforceConnection = function () {
    return new Promise(function (resolve, reject) {
        jwt.getToken(
            {
                iss: SF_CONSUMER_KEY,
                sub: SF_USERNAME,
                aud: SF_LOGIN_URL,
                privateKey: SF_PRIVATE_KEY
            },
            (err, tokenResponse) => {
                if (tokenResponse) {
                    let conn = new jsforce.Connection({
                        instanceUrl: tokenResponse.instance_url,
                        accessToken: tokenResponse.access_token
                    });
                    resolve(conn);
                } else {
                    reject('Authentication to Salesforce failed');
                }
            }
        );
    });
};
The private key is configured in Heroku as a configuration variable and is installed when the app is deployed.
Register the external service methods
Individual methods for the ShoppingService external service are easily added to a flow just as they would be for any external service. Here we’ve added the Get Products and Get Order methods, as shown in Flow Builder below. But since Flow Builder can register an external service method using only the API spec, they are just references to the stub methods that we still need to build out. We’ll program something for them later in this post.
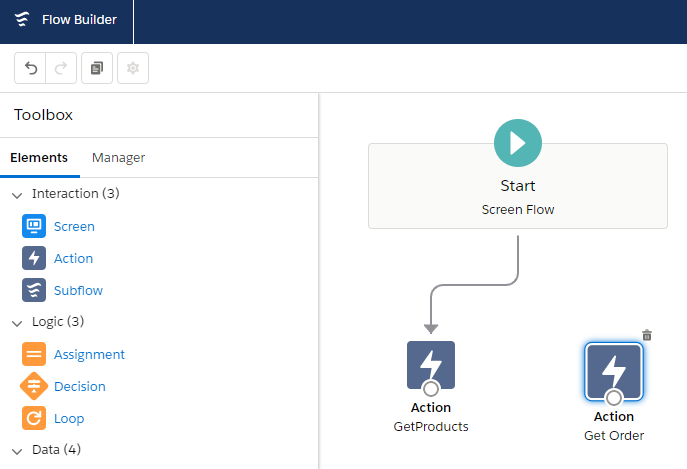
These are familiar steps to anyone that has registered an external service for a low, but if you want more detail on how to do this, check out the Get Started with External Services Trailhead.
Define the API and build out the methods
With the authorizations in place and the methods defined, we are now ready to build out the external service in a way that meets our company’s specific needs. For this, we need to implement each of the API methods.
To illustrate this, here is the Node function that has been stubbed out by the API for the Get Order method. It is here that your business logic is implemented.
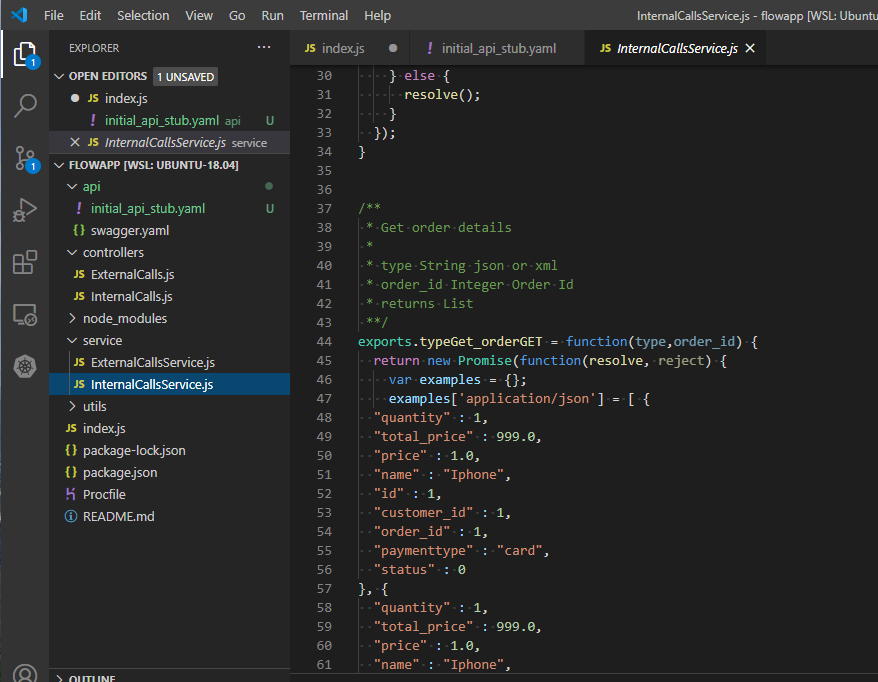
For each of the API methods, we’ve implemented some simple logic that we will use to test interactions with the flow. For example, here’s the code for getting a list of all orders:
/**
 * Get list of all orders for the user
 *
 * type String json or xml
 * pOSTDATA List Creates a new employee in DB (optional)
 * returns List
 **/
exports.typePost_orderPOST = function(type,pOSTDATA) {
  return new Promise(function(resolve, reject) {
    var examples = {};
    examples['application/json'] = [ {
  "Item Total Price" : 1998.0,
  "Order Item ID" : 643,
  "Order ID" : 298,
  "Total Order Price" : 3996.0
}, {
  "Item Total Price" : 1998.0,
  "Order Item ID" : 643,
  "Order ID" : 298,
  "Total Order Price" : 3996.0
} ];
    if (Object.keys(examples).length > 0) {
      resolve(examples[Object.keys(examples)[0]]);
    } else {
      resolve();
    }
  });
}
You can examine the code that implements each of the methods in the repo:
- Get Products Method
- Post Order Method
- Get Order Method
- Get Orders Method
Now that we have some simple logic executing in each of these methods, we can build a simple flow that logs in using the Named Credential, accesses the external service, and returns product data.
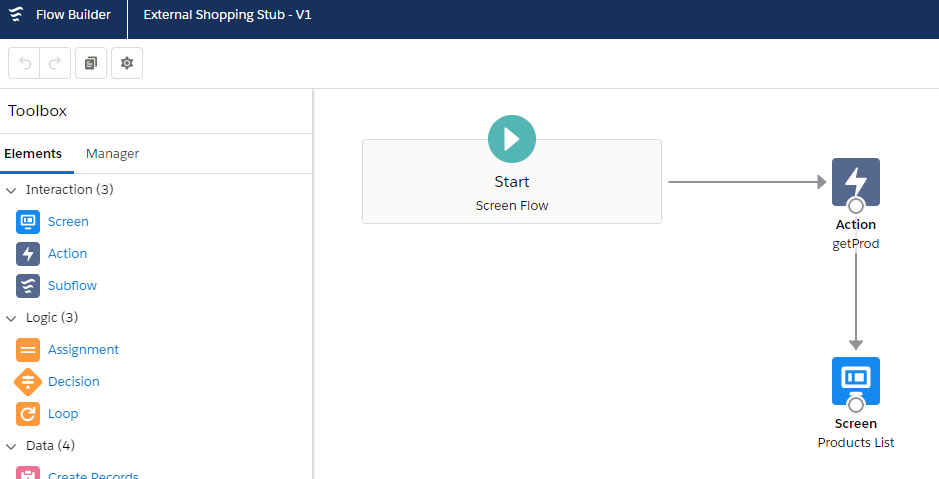
Running this flow shows the product data from the stub app. The successful display of product data here indicates that the flow has been able to successfully log in to the app, call the Get Product method, and get the proper response.
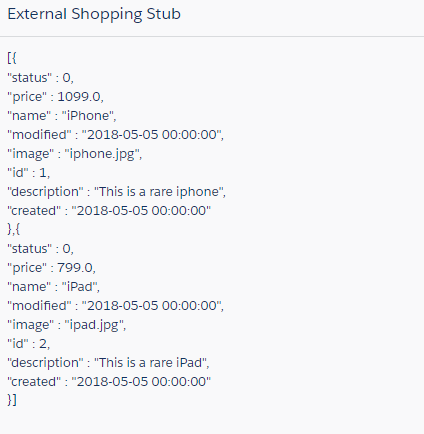
Update the API
So now that we have our basic flow defined and accessing the app, we can complete the API with new methods necessary for the app to do what it needs to do.
Let’s imagine that the app has up-to-date product inventory data and we want to use that data to update the Product object in Salesforce with the current quantity in stock. For this, the app would need to be able to access Salesforce and update the Product object.
To do this, the flow needs to make a request to a Get Inventory method. But that method does not yet exist. However, we can modify the API to include any new methods we need. Here our teams work together to determine what the flow needs and what methods are necessary in the app.
After discussion, we determine that a single Get Inventory method will satisfy the requirements. So, now we update the API spec to include a new method:
/{type}/get_inventory/:
    get:
      tags:
      - "Internal calls"
      description: "Get Inventory"
      operationId: "typeGet_inventoryGET"
      consumes:
      - "application/json"
      produces:
      - "application/json"
      - "application/xml"
      parameters:
      - name: "type"
        in: "path"
        description: "json or xml"
        required: true
        type: "string"
      - name: "product_id"
        in: "query"
        description: "Product Id"
        required: true
        type: "integer"
      responses:
        "200":
          description: "OK"
          schema:
            type: "array"
            items:
              $ref: "#/definitions/Inventory"
      security:
      - basic: []
With this updated API, we can update the external service so that we can use it in a flow.
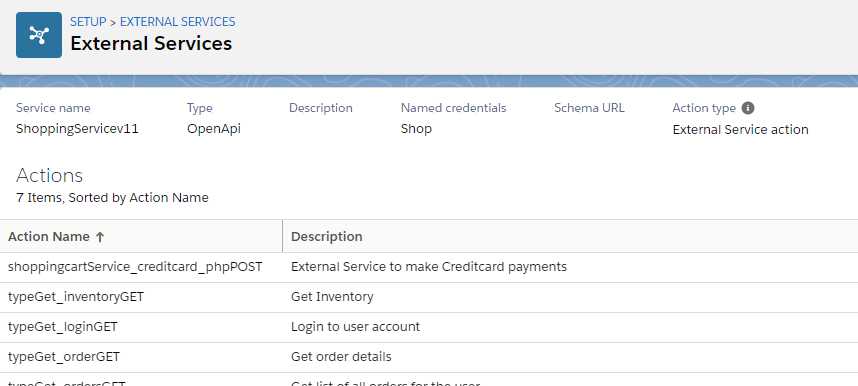
And with the updated API spec, we can automatically generate a stub method as well. From the empty stub method we can complete the function with the necessary logic to access Salesforce directly and update the Product object. Note that it uses the SFAuthService.js code from above and an API token to access the organization data.

Platform events and EDA
Now that this inventory method is available, we can check the operation with a simple flow that triggers on a Platform Event and updates the Product object. When we run this test flow, it updates the iPhone Product object in the organization.

How and when the flow might need to update the product inventory would be up to the actual business needs. However, triggering the flow to update the object can be done using Platform Events. The flow can respond to any Platform Event with a call to the Get Inventory method.
Deploy the business logic
The process described in this post can go on until the flow and app API converge on a stable design. Once stable, our programmer and low-code builder can complete their work independently to complete the app. The flow designer can build in all the decision logic that surrounds the flow and build out screens for the user to interact with.
Separately, and independently from the flow designer, the programmer can code each of the methods in the stub app to implement the business logic.
Summary
We’ve just started building out this app and running it as an external service. In this post, however, you’ve already seen the the basic steps that would be part of every development cycle: defining an API, registering methods that a flow can call, building out the stub app, and authorizing access for the flow, app, and Platform Event triggers.
Future posts in this series will take these basic elements and methodology to expand the flow to execute the business logic contained in the app via user interface elements for a complete process automation solution running entirely on the Salesforce Platform.
To learn more, see the Heroku Enterprise Basics Trailhead module and the Flow Basics Trailhead module. Please share your feedback with @SalesforceArchs on Twitter.
The post Extend Flows with Heroku Compute: An Event-Driven Pattern appeared first on Heroku.
]]>With the coronavirus, the world put widespread diagnostic testing at the core of its pandemic response playbook. However, testing is only effective if the test results are accurate — a false negative could not only endanger the individual, but also their entire community.
Third-party quality assurance providers play a vital role in testing…
The post Coding at the Speed of a Pandemic: How Kilterset Delivered Apps That Test the Test Kits appeared first on Heroku.
]]>With the coronavirus, the world put widespread diagnostic testing at the core of its pandemic response playbook. However, testing is only effective if the test results are accurate — a false negative could not only endanger the individual, but also their entire community.
Third-party quality assurance providers play a vital role in testing the tests. They make sure that test equipment and processes adhere to the highest standards. One of the global leaders in this field is the Royal College of Pathologists of Australasia Quality Assurance Programs (RCPAQAP). Since the early days of the coronavirus pandemic, the company has assisted with vetting diagnostic testing in Australia.
To be an effective partner in Australia’s pandemic response, RCPAQAP needed speed on their side. So, their software development agency, Kilterset, hit the ground running and deployed rapid point-of-care quality assurance apps to Heroku in record time — just before test kits began to roll out across the country.

The vision: an app platform to QA coronavirus test kits
As Australia ramped up coronavirus testing, diagnostic test kits from different suppliers began flooding into the country’s pathology labs. RCPAQAP took on the challenge to develop a new quality assurance program to ensure that these kits performed as expected and that their rapid deployment did not undermine quality standards.
To be successful, RCPAQAP’s solution needed to be first and foremost simple to use. Like all frontline health professionals, lab technicians were under a great deal of stress, and any test validation tools had to mitigate the risk of user error or decision fatigue. The solution also had to seamlessly scale to serve a potentially massive increase in testing in the weeks or months to come, as the virus showed no signs of slowing down.
In partnership with Kilterset, RCPAQAP envisioned two cloud applications that would support both core objectives. A progressive web app for mobile use would allow users to capture and transfer lab testing data and send it to RCPAQAP for quality assurance. An administration portal would allow the company to access and manage test data, as well as share it with others involved in pandemic response, such as healthcare organizations and public health authorities.
Both apps needed to be ready to go before test kits were made available — which meant only a few short weeks for development. The Kilterset team had to act fast.
The context: complex system integrations made it harder to build quickly
Kilterset’s partnership with RCPAQAP goes back several years. The agency had already built a robust platform to support the company’s ongoing QA programs, featuring a number of deep integrations that enable data sharing with various medical systems and business systems (like Salesforce).
The COVID-19 project, however, presented a different kind of challenge. This time, the focus was on development agility (which would enable maximum speed). The Kilterset team could have built on top of the existing platform, however development would have been slower, making it harder to deliver the new apps as quickly as the country needed them.
The team decided to step back and start fresh. Alice Eller, Director of Project Delivery at Kilterset, says: “Just focusing on the new apps in isolation gave us the freedom to be more nimble and move faster, while still leveraging all the knowledge we’d gained from working with RCPAQAP over the years.”
The shift: an agile, prototyping-focused methodology
The Kilterset team sat down with the project manager at RCPAQAP and gathered some basic requirements for the apps to give them a rough shape of what was needed. In a few hours, one developer spun up an initial prototype, deployed it to Heroku, and shared it with the client who could then provide constructive feedback. Having a quick prototype gave everyone a tangible sense of what the app could be — right from the start. With very low effort and cost, the team could capture valuable learnings and work towards an MVP with confidence.
Because the project’s time frame was so tight, the Kilterset team had no time to take a wrong turn at any point. Everything they built had to be the right thing, and the team couldn’t allow themselves to get stuck down a rabbit hole. The prototyping approach was invaluable because it gave them a quick way to validate an idea and then go build it out properly.
Shipping incrementally to stay ahead of the deadline
Over the course of four weeks, the team worked on the new platform piece by piece, deploying what was ready to production on Heroku, and then moving on to the next. The basic functionality was there early on, and if the test kits were released earlier than expected, RCPAQAP could have started their program with the apps as is.
During this time, some of RCPAQAP’s program logistics were falling into place, such as QR codes for each test kit, and those got incorporated into the app as well. Eventually, the full, end-to-end user flow was completed well before the test kit rollout, and there was even a little extra time to add some bells and whistles.
Eller says, “It was a really nice feeling to know that we were ready. We had solid, quality apps in time for our client to help tackle this major crisis that was quickly unfolding.”
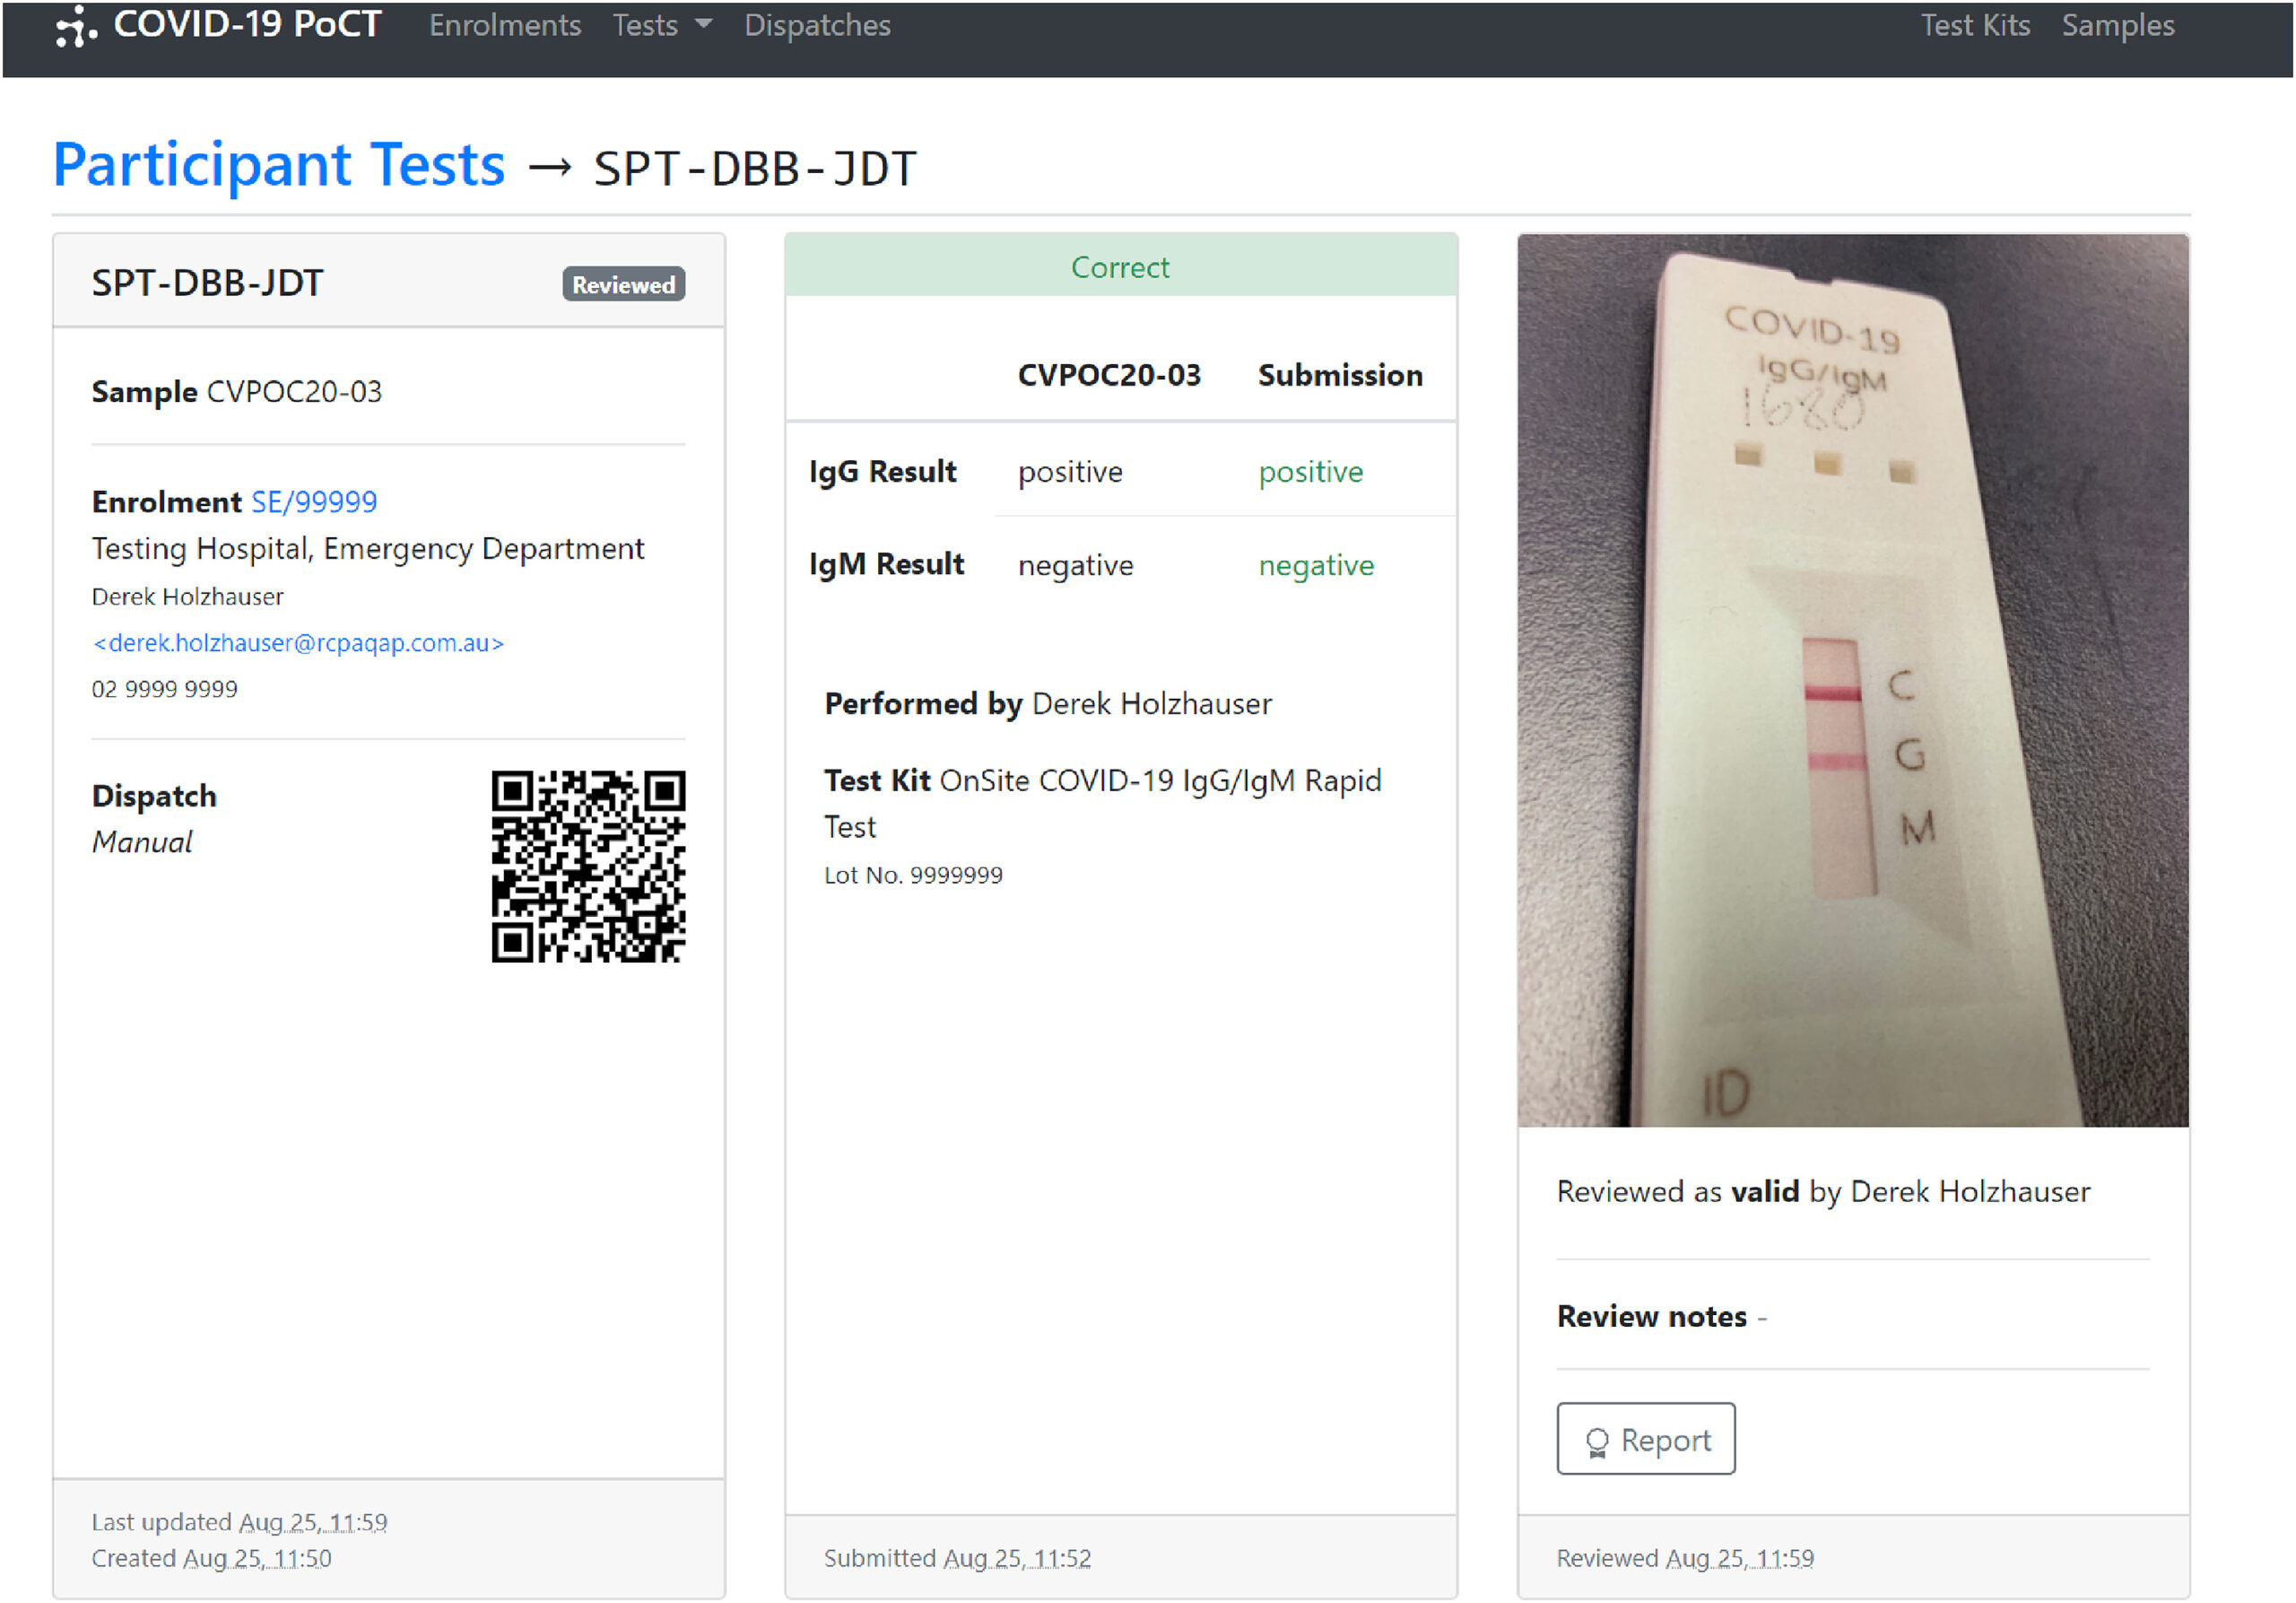
From testing to validation a sample in just a few clicks
To validate a test kit, RCPAQAP uses coronavirus test samples that they know to be either positive or negative. They attach a QR code and unique ID to each sample and ship it out to a testing laboratory. The lab technician then tests the sample using a particular brand of test kit and then scans its QR code on their mobile phone to bring up the RCPAQAP progressive web app. Because the app’s UI is so simple, the technician can quickly enter the test results without fear of mistyping or clicking the wrong button. They also attach a photo of the test kit itself, and submit it with the report. The RCPAQAP receives a notification that the report is available for review, and the team then compares it with the known results.
In one case, the team identified a mismatch. RCPAQAP had sent out positive test samples and the reports were coming back negative. Without the photo capture feature in the app, the lab could have concluded that the technician had misinterpreted the results of their test. But the photo showed that the actual test kit was showing an incorrect result. The lab stopped using the test kits and reported the findings to the manufacturer. This goes to show how important the QA process is for lab tests, particularly during a pandemic when one faulty test kit can impact so many lives.
Kilterset Express on Heroku: a new way of working for clients
Prior to the RCPAQAP project, Kilterset had been developing a repeatable methodology for quickly prototyping and delivering new apps, and the success of the new test kit apps only energized the team even more. Kilterset Express is designed to enable businesses to extract maximum value out of ideas and quickly turn them into real solutions. Says Eller: “At the start of an Express project, we ask ourselves: ‘What is the smallest thing we can put in front of a customer that they will find meaningful?’ And we’ll build on that.”
Heroku is the cornerstone of Kilterset Express. As with the RCPAQAP apps, Heroku makes it easy for developers to spin up a prototype and iterate quickly without having to spend time on infrastructure concerns. They can also leverage a wide range of Heroku Add-ons to add functionality that demonstrates their ideas. But most importantly, once the pieces of a project get pushed to production, they can stay on Heroku for the long term. Heroku’s seamless scalability allows clients like RCPAQAP to handle massive spikes in traffic without issues.
EJ Guren, Head of Marketing at Kilterset, believes that the Express offering is particularly ideal for businesses who are struggling during the pandemic: “Many businesses are facing budget constraints, a decrease in consumer activity due to waves of lockdowns, and so on. How can they avoid stagnation or the risk of falling too far behind? We help them continue to invest wisely in their business on an incremental basis, so that when the world recovers, they’re way ahead.”
Speed can be exhilarating
For the Kilterset team, one of the most surprising outcomes of the RCPAQAP project has been the experience itself. Everyone thrived while working in the Express mindset. Rapid iteration allowed the client to see progress and participate fully every step of the way. Clear direction and fast feedback allowed the team to forge ahead knowing they were on the right track.
“We could see that we were building something worthwhile, for our client and society,” says Eller. “Everyone felt a sense of urgency, but not stress, and we were able to be really productive every day.” One thing is clear: speed and agility have become the new normal at Kilterset. The pandemic fast-tracked this new methodology, and the team looks forward to continuing to practice it well after the crisis is over.
Learn more about this project by reading their client’s article in the Journal of Practical Laboratory Medicine.
The post Coding at the Speed of a Pandemic: How Kilterset Delivered Apps That Test the Test Kits appeared first on Heroku.
]]>JavaScript turns 25 years old today. While it’s made an impact on my career as a developer, it has also impacted many developers like me and users around the world. To commemorate our favorite language, we’ve collected 25 landmark events that have shaped the path of what the JavaScript ecosystem looks like today.
In 1995, Brendan Eich, a developer at Netscape, known for their Netscape browser, was tasked with building a client-side scripting language that paired well with Java. While it may not be the…
The post Celebrating 25 Years of JavaScript appeared first on Heroku.
]]>
JavaScript turns 25 years old today. While it’s made an impact on my career as a developer, it has also impacted many developers like me and users around the world. To commemorate our favorite language, we’ve collected 25 landmark events that have shaped the path of what the JavaScript ecosystem looks like today.
1995
1) JavaScript is created
In 1995, Brendan Eich, a developer at Netscape, known for their Netscape browser, was tasked with building a client-side scripting language that paired well with Java. While it may not be the language that you know and love today, JavaScript was written in 10 days with features we still use today, such as first-class functions.
1997
2) ECMAScript is released
Despite JavaScript being created 2 years before, there was a need to create open standards for the language if it would be used across multiple browser types. In 1997, Netscape and Microsoft came together under Ecma International to form the first standardization of the JavaScript language, resulting in the first iteration of ECMAScript.
1999
3) Internet Explorer gets an early XMLHTTP Object
Some will recall using iframe tags in the browser to avoid reloading a user’s page with a new request. In March of 1999, Internet Explorer 5.0 is shipped with XMLHTTP, a browser API that could enable developers to take advantage of background requests.
2001
4) JavaScript gets its own data format
In 2001, JSON was first introduced via json.org. In 2006, an RFC proposing JSON, JavaScript Object Notation, was opened for review with the proposal of more than one type of HTTP call to fulfill a website: one that would fulfill a browser’s needs and the other would provide application state. Thanks to its simplicity, JSON would gain traction as the standard and continues to be used today. (Source)
2005
5) Shifts towards AJAX
After other browsers followed Internet Explorer in supporting background requests for updating clients without reloading pages, a researcher penned the term as Asynchronous JavaScript and XML, or AJAX, highlighting the shift in web development and JavaScript to asynchronous code. (Source)
2006
6) First publicly released Developer Tools
With more complexity being enabled in the browser, there was a need for tooling to keep up. Firebug was created in 2005 as the first Developer Tool to debug in Mozilla’s Firefox browser. It was the first piece of tooling that provided developers the ability to inspect and debug directly from the browser. (Source)
7) jQuery is released
jQuery can be considered the pioneer of what we know today as modern front-end web development, and it has gone to influence many libraries and frameworks today. At its height, being a JavaScript developer and being a jQuery developer were interchangeable. The library extends the JavaScript language to easily create single-page applications with DOM-traversal, event handling, and more.
2008
8) Creation of V8
As websites went from HTML pages to JavaScript applications, it was imperative that the browsers hosting these applications keep up. From 2007 to 2010, many browsers made major releases to keep up with the growing demand from JavaScript compute power. When Chrome was released, the browser’s JavaScript engine, V8, was released as a separate project. V8 was a landmark project with Its “just-in-time” compiler and would be used in future projects as a reliable and fast JavaScript runtime.
9) The first native Developer Tools
In addition to the release of V8, Chrome introduced developers to another innovation: Developer Tools that are native to the browser. At the time, features only included element inspection and looking at resources, but the tool was an upgrade from the current tooling and would influence an entire suite of developer tools for front-end development. (Source)
2009
10) CommonJS moves to standardize modules
In an effort to modularize JavaScript code and take code bases from single file scripts to multi-file source code, the CommonJS project was an effort to elevate JavaScript into language for application development. CommonJS modules would influence the Node.js module system.
11) Node.js takes JavaScript to the back-end
JavaScript had gained momentum as a language for the browser for many years before making its way to the back-end. In 2009, an engineer at Joyent, Ryan Dahl, introduced Node.js, an asynchronous event-driven JavaScript runtime at JSConf EU.
12) CoffeeScript sprinkles syntactic sugar
Long before types were popularized in JavaScript, there was CoffeeScript, a programming language that compiles to JavaScript and was inspired by Ruby, Python and Haskell. The compiler was originally written in Ruby and didn’t require compatibility from dependencies because it compiled to JavaScript, and it gained traction for exposing the good parts of JavaScript in a simple way.
2010
13) Node.js gets its first package manager
Shortly after Node.js was introduced, npm was created. npm (short for Node package manager) would eventually create the standard in managing dependencies for both front-end and back-end applications making it easier to publish, install, and manage shared source code with a project file, the package.json. npm also provided the npm registry, which would supply hundreds of thousands of applications a database to retrieve Node.js dependencies.
14) Express has it’s initial release
Inspired by Ruby’s Sinatra, Express.js was released in 2010. It was released with the intention of being a minimal, un-opinionated web framework that provided routing, middleware, and other HTTP utilities. According to GitHub, Express remains the most popular framework for back-end JavaScript developers to date.
15) Modern JavaScript MVC frameworks are born
While back-end JavaScript was gaining traction, front-end MVC frameworks were starting to pop up. Most notably, Backbone.js and AngularJS (later rewritten and released as Angular) were starting to be adopted and loved by JavaScript developers. Backbone’s approach to front-end was well-suited for mirroring an application’s business logic, while Angular took a declarative approach that enables a robust web application in the browser. Both frameworks would go on to influence later front-end libraries and frameworks, such as React, Ember.js, and Vue.js.
2011
16) Ember.js stresses convention over configuration
In 2011, a forked version of an earlier project called SproutCore, is renamed to Ember.js. Ember introduces JavaScript developers the concept of convention over configuration, in which the developer does not have to think about design decisions that can be standardized across code bases.
2012
17) Static types are introduced to JavaScript developers
2012 was a big year for static typed languages. JavaScript was, until then, a dynamically typed language by design, in that it doesn’t require the developer to declare types when initializing variables or other data structures. Enter TypeScript – an extension of JavaScript that allows developers to write typed JavaScript that is syntactically similar to JavaScript and compiles to JavaScript. Microsoft made the initial release of the project in October of 2012.
2013
18) The world reacts to React
In 2013, a developer at Facebook, Jordan Walke, presents a new JavaScript library that does not follow the then-popular MVC convention of JS frameworks. (Source) React, a component-based library that was simply the V of MVC, would go on to become one of the most popular libraries of today.
19) Electron puts Node.js into desktop applications
Additionally, with the rising popularity of Node.js, there was momentum to repurpose the runtime or other uses. GitHub made use of Node.js as a library with Chromium’s rendering engine and created Electron for desktop applications. Notable desktop applications that use Electron include GitHub Desktop, Slack, and Visual Studio Code.
2015
20) Release of ES2015/ES6
The 6th edition of ECMAScript was released in June of 2015. This specification was anticipated by many JavaScript developers for its inclusion of popular features such as support for export and import of modules (ES modules), declaring constants, and more. (Source) While the previous version of ECMAScript (ES5) had been released 6 years before, much of the standards released had been worked on since ES3, which was released 16 years before. (Source)
21) GraphQL emerges as a REST alternative
In 2015, Facebook released GraphQL as an open source project, a querying language for APIs that simplifies request calls between clients and servers to resolve the differences between server-side data schemas and client-side data needs. (Source) Due to its popularity, the project would eventually be moved to its own GraphQL Foundation.
22) Node v4 is released
2015 was notable for back-end JavaScript developers because it marked the merging of io.js back into Node.js. Just a year before, Node was forked as io.js in an effort adapt quicker release cycles. When io.js was merged back in, it had already released v3, so it was natural to release Node v4 after the merge as a fresh start for the combined projects. Hereafter, Node would adapt a release cycle that would keep it up to date with the latest V8 releases.
2016
23) JavaScript developers are introduced to lock files
In the months following an infamous “left-pad” incident (Source), Yarn was released to the JavaScript ecosystem. Yarn was created out of need for more consistency across machines and offline environments running the same JavaScript applications. Yarn introduced the autogenerated lockfile to the JavaScript ecosystem, which would influence package managers to look at developer experience differently moving forward. (Source)
2019
24) Node + JS = OpenJS
After years of the JS Foundation and Node.js Foundation operating separately, the two organizations merge and become the OpenJS Foundation with goals to increase collaboration and provide a united home for projects across the JavaScript ecosystem. (Source)
2020
25) Deno makes a splash with the initial release
This year, Node.js creator, Ryan Dahl, made the initial release of Deno, a JavaScript and TypeScript engine that, again, is built on top of V8. The project has generated a lot of interest because of its first-class TypeScript support and, of course, inspiration taken from Node.js.
While these landmarks highlight some exciting moments in JavaScript history, there are countless other honorable mentions and important contributions too. The JavaScript ecosystem would not be where it was without the hard work to of developers around the world today. Every pull request, conference talk, and blog post has inspired the next innovation. For that, we thank all of you for your contributions and look forward to the bright future of JavaScript.
The post Celebrating 25 Years of JavaScript appeared first on Heroku.
]]>It all started with a part-time job
In 2008, Edd began studying computer science at the University of Bournemouth in the U.K. Like many college…
The post When Serendipity Strikes: How One Engineer Turned His First Coding Gig into a Decade-Plus Career appeared first on Heroku.
]]>
It all started with a part-time job
In 2008, Edd began studying computer science at the University of Bournemouth in the U.K. Like many college students, he needed to find a way to make money for rent and living expenses. Edd came across a job posting from a startup that needed some programming help, and he thought, “Why not apply?” He says, “It seemed cool to be paid for doing this thing that I was doing all the time as a hobby, which is programming and making websites.”
Back then, he didn’t consider this decision to be a first step on a formal career path. It was only to be a short-term, convenient solution to pay the bills while in school. Little did he know that the job would offer Edd so much more. “It’s kind of funny, and surprising, that I got my ‘life job’ before I even left college.”
The early days at BiggerPockets
In 2004, Josh Dorkin wanted to get into real estate investing, but he quickly found that the industry was fraught with scams and “get rich quick” schemes. He couldn’t find a good source of reliable information anywhere, so he did what entrepreneurs do: he started his own thing. BiggerPockets launched as a simple community forum for people to share their real estate investment knowledge and experience.
By the time Edd joined, BiggerPockets had grown to serve a couple of thousand users. Josh needed help with taking the site to the next level — from forum posting to a more interactive, integrated experience that could also be monetized. At that time, Facebook had taken the world by storm, and social networks had become the new way to build community. Josh envisioned that the expanded BiggerPockets platform would allow investors to build friendships and network with each other, as well as access the lenders, agents, and other services needed to make a successful deal.
Josh and Edd got started on this vision from different sides of the planet. As Josh was in Colorado, and Edd in the U.K., they would open up a Skype call and just work side by side for eight hours, mostly in silence, to simulate a shared office space. Edd says, “I didn’t meet Josh face-to-face until about five years ago, which is pretty crazy.”
Edd continued as the only engineer at BiggerPockets for the first few years. At a certain point in the company’s growth, it was time to also grow the team. “We found our first engineer in the same way Josh found me,” says Edd, “And he stuck around for a very long time. We wanted to find people that we could get along with since we’d be working together so closely.”
From employee number one to head of engineering
Fast forward a few more years, and today, Edd leads a team of 13 engineers. His own career trajectory has come as a bit of a surprise to him. “When I was younger, I never saw myself becoming a director of anything. But by staying at the company for so long, it’s forced me into a leadership role that I have gladly embraced. I feel lucky to have learned so much in this role.”
Most engineers are located at the company’s headquarters in Denver, Colorado, but a few are remote like Edd. Typically, he travels to Denver every quarter to get some face time with his team, but the global pandemic has made that difficult this year. So, Edd and team have had to get creative with maintaining the team’s culture. One of their first experiments was to schedule “water cooler time” over Zoom, however it felt too much like forced social interaction. Adding a purpose to the gathering made all the difference. Now, the team meets regularly to discuss a particular problem or to do some group coding together, and the socializing in between feels more natural.
Many important lessons learned along the way
Learning on the job can bring both pitfalls and opportunities. “We’re still dealing with the consequences of some decisions I made ten years ago,” Edd says. “There are definitely a lot of things that I would say to a much younger me.” Some of those lessons have come out the fire of experience and others from industry thought leaders:
-
A team is a network of brains. Going from one engineer to a team of many requires a shift in mindset. The problems are no longer purely technical; organizational and people problems arise as well. Edd refers to Jean-Michel Lemieux, CTO of Shopify, who thinks of his engineering team as a network of brains. “As a leader, you want to optimize communication across that graph of brains, each with a million edges that could connect with others,” says Edd. “And it’s a hell of a lot harder than writing code.”
-
Less is more. To Edd’s younger self, every business challenge could be solved with the right code. He’d ask himself: “What software can I bring into the world to solve this problem?” However, that approach didn’t always take into account the full scope or nature of the problem. Now, Edd tries to “get out of his own way” and focus on the bigger picture. “I say ‘no’ to more things and try to work out what’s the best direction for the product. And that’s not always about writing more code.”
-
Product management is a thing. As Edd began to focus more on the product, he had to make decisions that straddled both product management and engineering management. It wasn’t until the company began hiring dedicated product managers that he fully understood the role. “It is a different way of thinking: why are we writing this code? Why work on this and not something else? Those questions were always in the back of my head, but I didn’t act on them in the early years.”
-
Innovation is expensive. Part of saying “no” to more things is the realization that time and resources are limited — and precious. Edd is inspired by Dan McKinley, who introduced the concept of “innovation tokens” as engineering currency. Every company has a set amount of tokens which can be spent in any way. “We have to be very intentional and spend our tokens wisely, so we’re always focusing on the right things. In the early days, we spent them like crazy and probably went into innovation token debt!”
Today, product discovery is a requirement at BiggerPockets before significant time or energy goes into something new. The team leverages zero code solutions, like user feedback and data, to help them make decisions, rather than relying purely on assumptions. “In this way, we’ve become less of a stakeholder-driven company, and more of a product-driven, or even customer-driven, company.”
The day the database crashed
For the first six years, BiggerPockets managed its own infrastructure that was located at a data center in California. One day, Josh called to report that the site was down. Edd looked into it, called the data center, and found that the database server had crashed due to a failure in one of the RAID controllers.
The prognosis was bad. “They told us: ‘You’d better have some backups.’ Then, I realized that our most recent backup was six months old.” It was the most stressful day of his career. “We had three engineers at the time, and it wasn’t anyone’s official responsibility to do all those backups because we did not see ourselves as an infrastructure engineering company. We’re a product engineering company, and we didn’t know it until this happened.”
New lessons learned on Heroku
Luck was on their side, and the data center was able to recover the data (after a full 12 hours of downtime). But this was a major wake up call, and Edd was determined to not let it happen again. BiggerPockets is primarily a Rails app, and Edd understood that Heroku was the best platform for running Ruby apps. The team decided to spin up a copy of the app on Heroku, with data living in Heroku Postgres, to see how it worked.
They tested the two apps in parallel for a couple of days, and the Heroku app performed flawlessly, so they moved the domains over. “It was a very smooth process, and we haven’t looked back since.” Now, Edd and team can leave the infrastructure worries behind them and truly focus on being a product engineering company.
The road ahead to 2021 and beyond
For lots of businesses, the global pandemic and recession in 2020 made it a tough and confusing year to navigate. But the BiggerPockets team are excited to come out of it with a greater sense of purpose and direction. They’ve even begun hiring again, opening a front-end engineer role to help them with plans for mobile apps in 2021.
When Edd thinks about his own career path over the next five years, two things come to mind. First, he wants to grow the team so that this thing that he's been working for so long can reach its full potential. Edd looks forward to expanding the platform with new capabilities, such as big data and analytics, that can help customers make even better investment decisions.
Secondly, as his team builds exciting new features, Edd wants to be coding along with them. In between his management duties, he still writes code on a weekly basis and actually sits on one of the project teams. “I never want to lose touch with actually building stuff, because that's why me (and lots of other nerds) get into this industry. There are companies larger than us where the CTO writes code. It doesn't prohibit you being hands on in a leadership role, and I think in some cases it should be mandatory.”
The post When Serendipity Strikes: How One Engineer Turned His First Coding Gig into a Decade-Plus Career appeared first on Heroku.
]]>When the global coronavirus…
The post A Pandemic Tale: How a Simple Algorithm Brought a Business Back from Lockdown appeared first on Heroku.
]]>When the global coronavirus pandemic hit, the U.K. government mandated that retailers like Matalan close their physical stores to help prevent the spread. It was a moment of crisis for both the company and its 13,000 employees. Matalan was forced to furlough 90% of its workforce, and no one knew when the business might be able to return to normal operations.
An e-commerce surge brings new challenges
On the digital side of the business, Matalan's e-commerce site was still operational, of course, and growing as rapidly as other online retailers during this time. As people found themselves stuck at home, they were spending far more money online than ever before as they stocked up on basic items or had more time to discover new products.
This put tremendous pressure on the company's distribution centers, which struggled with the surge in volume. Weeks of online orders had created a daunting backlog that the center couldn't process fast enough. Although customers understood that this was pandemic-related, there was a chance that they'd become too frustrated to return in future, posing yet another serious risk to the business.
Matalan's distribution centers also faced yet another unknown — the U.K. government could shut down such centers at any time due to increasingly strict social distancing rules. The company's current safety efforts meant that fewer workers could be on the job each day. This only further increased the enormous backlog and threatened the viability of the online business.
All of this meant potentially thousands and thousands of jobs could be lost. Although Matalan is a large enterprise, the pandemic brought unprecedented business challenges, and while companies of this scale have "rainy day funds," cash flow is managed very carefully and there's only so far that they can stretch their resources.
We've always had a great partnership with Matalan, so when they shared their concerns with us, we wanted to find a way to help them out. We understood their goals to be:
- Continue selling online as much as possible to serve their customer base.
- Offset the revenue lost by physical stores that were temporarily closed.
- Relieve the burden on distribution centers.
- Raise funds that could be used as a safety net to protect jobs.
Reimagining stores as distribution centers
A few years ago, our CEO sat on the board at Matalan, and he had initiated a project to install RFID tags on all of the company's products. Unlike traditional barcodes, these tags would enable someone to walk around the store with an RFID reader and record each product currently sitting on the shelves. They could then generate a stock report easily and with far greater accuracy.
This existing "infrastructure" gave us an idea. If we knew the current inventory at each store, could we determine whether an online order could be fulfilled by one of those stores? As there were no customers coming in, the stores were in effect small warehouses. We just needed to connect the dots.
From good idea to working proof of concept — in one week
We kicked off the project by building a proof-of-concept algorithm that would run the logic needed based on things like the customer's order, their chosen payment/shipping methods, or the inventory at RFID-enabled stores. If the items could be packaged and shipped by a local store, great. If not, then the order would go to a distribution center.
Part of our process was to work with the stores to analyze how fulfillment could be done efficiently. We went around with a trolley, picking the items to be shipped, and looking for ways to optimize the flow. Would it be better for someone to collect items for one order at a time, or for multiple orders? We were able to factor this into the algorithm, so that stores wouldn't become as overwhelmed as the distribution centers.
All in all, it took our team a week to take the concept from an idea to a production-ready proof-of-concept app on Heroku. Most of this time, we were tracking down data in various systems. But once we got access to the data, it was relatively straightforward to build and deploy our app. As time was of the essence for Matalan, the speed and ease of deploying to Heroku was a great advantage. If we'd had to do all our own DevOps work, spin up servers and such, it would have taken us much longer to get the solution out the door.
Furloughed employees return as stores get ready to ship
To test our concept, we double-routed every online order for a period of time through both the traditional fulfillment path and our new algorithm that pointed to a selection of about a hundred stores. We were able to simulate what would happen with real production data without disrupting the real order flow. Fairly quickly, we could see that it was possible to offload the majority of e-commerce orders to the stores. That's when things really ramped up.
Soon, the remaining pieces of the fulfillment puzzle started falling into place. Matalan brought back furloughed employees to ten stores at first, and more as time went on. They set up stores with label printers, couriers, and other equipment and services needed to ship products. And in four to six weeks, their fleet of new mini-distribution centers was up and running.
Ready to ship a million orders per day
Since our new solution rolled out, we've seen an increasing volume of online orders that are routed in complex ways. But our app has held steady throughout, as Heroku enables us to scale seamlessly with demand. In addition, everything is lightning fast — our API responds in ~20ms, and our routing jobs take ~100ms. This gives us the capacity to route almost a million orders per day and still provide a great experience for Matalan customers. All with minimal performance optimization.
Our ecosystem was a critical success factor
We believe that one of the keys to our project's success is that we leveraged our existing ecosystem, which was flexible and ready to adapt. The SHIFT platform is completely API-driven with webhooks that make it easy to route orders. We use all three Heroku data services: Heroku Postgres for storing stock data, Heroku Redis for queuing and calculation, and Apache Kafka on Heroku for streaming data into our order management system. We also use familiar Heroku Add-ons, like Coralogix and Heroku Scheduler. Heroku's PCI compliance also meant that we didn't have to worry about the security of our infrastructure. Because we'd already invested in our architecture, we could bolt on a new service like the Matalan app with next-to-zero effort.
A quick fix during a crisis becomes a long-term solution
As the months rolled by and pandemic rules changed, Matalan saw more ways to use our algorithm. They've been able to improve their "click and collect" model, which allows customers to place an order online and pick up the items in person at a store. Before, these orders would be shipped from a distribution center to a store (which may already have those items in stock). Now, they can route these orders directly to the collection store, and stores can actually pick and pack those orders directly in the store. This results in significant cost savings for Matalan. It allows them to scale to accept more online orders and also saves time for customers — a true win-win.
We don't know when the pandemic will end, but we do believe that Matalan is in a better position now than before the crisis began. If a second wave happens, or a new pandemic arises, they have a mechanism in place to keep the business going and keep their people employed. We see it as a long-term risk management solution that they can fine-tune as they go along. It just goes to show how one simple algorithm can make a huge difference to a business' future.
Read the SHIFT Commerce case study to learn more about SHIFT on Heroku.
Listen to a special episode of the Code[ish] podcast featuring Ryan Townsend: Scaling Businesses During a Pandemic.
The post A Pandemic Tale: How a Simple Algorithm Brought a Business Back from Lockdown appeared first on Heroku.
]]>Customers use connectors to build streaming data pipelines between Salesforce and external stores like a Snowflake data lake or an AWS Kinesis queue for integration with other data sources. They also refactor…
The post Heroku Streaming Data Connectors Are Now Generally Available appeared first on Heroku.
]]>Customers use connectors to build streaming data pipelines between Salesforce and external stores like a Snowflake data lake or an AWS Kinesis queue for integration with other data sources. They also refactor monoliths into microservices, implement an event-based architecture, archive data in lower-cost storage services, and more.
Other customers use connectors to build a unified event feed from data in multiple Salesforce and Work.com orgs, which provides a centralized Kafka-based Event Bus to take action on all org activity. Multiple integrations are possible in this configuration, including Heroku apps in dynos, Salesforce Flow, Mulesoft, and more.
And we’ve uncovered new opportunities for further enhancements and integrations in the months to come.
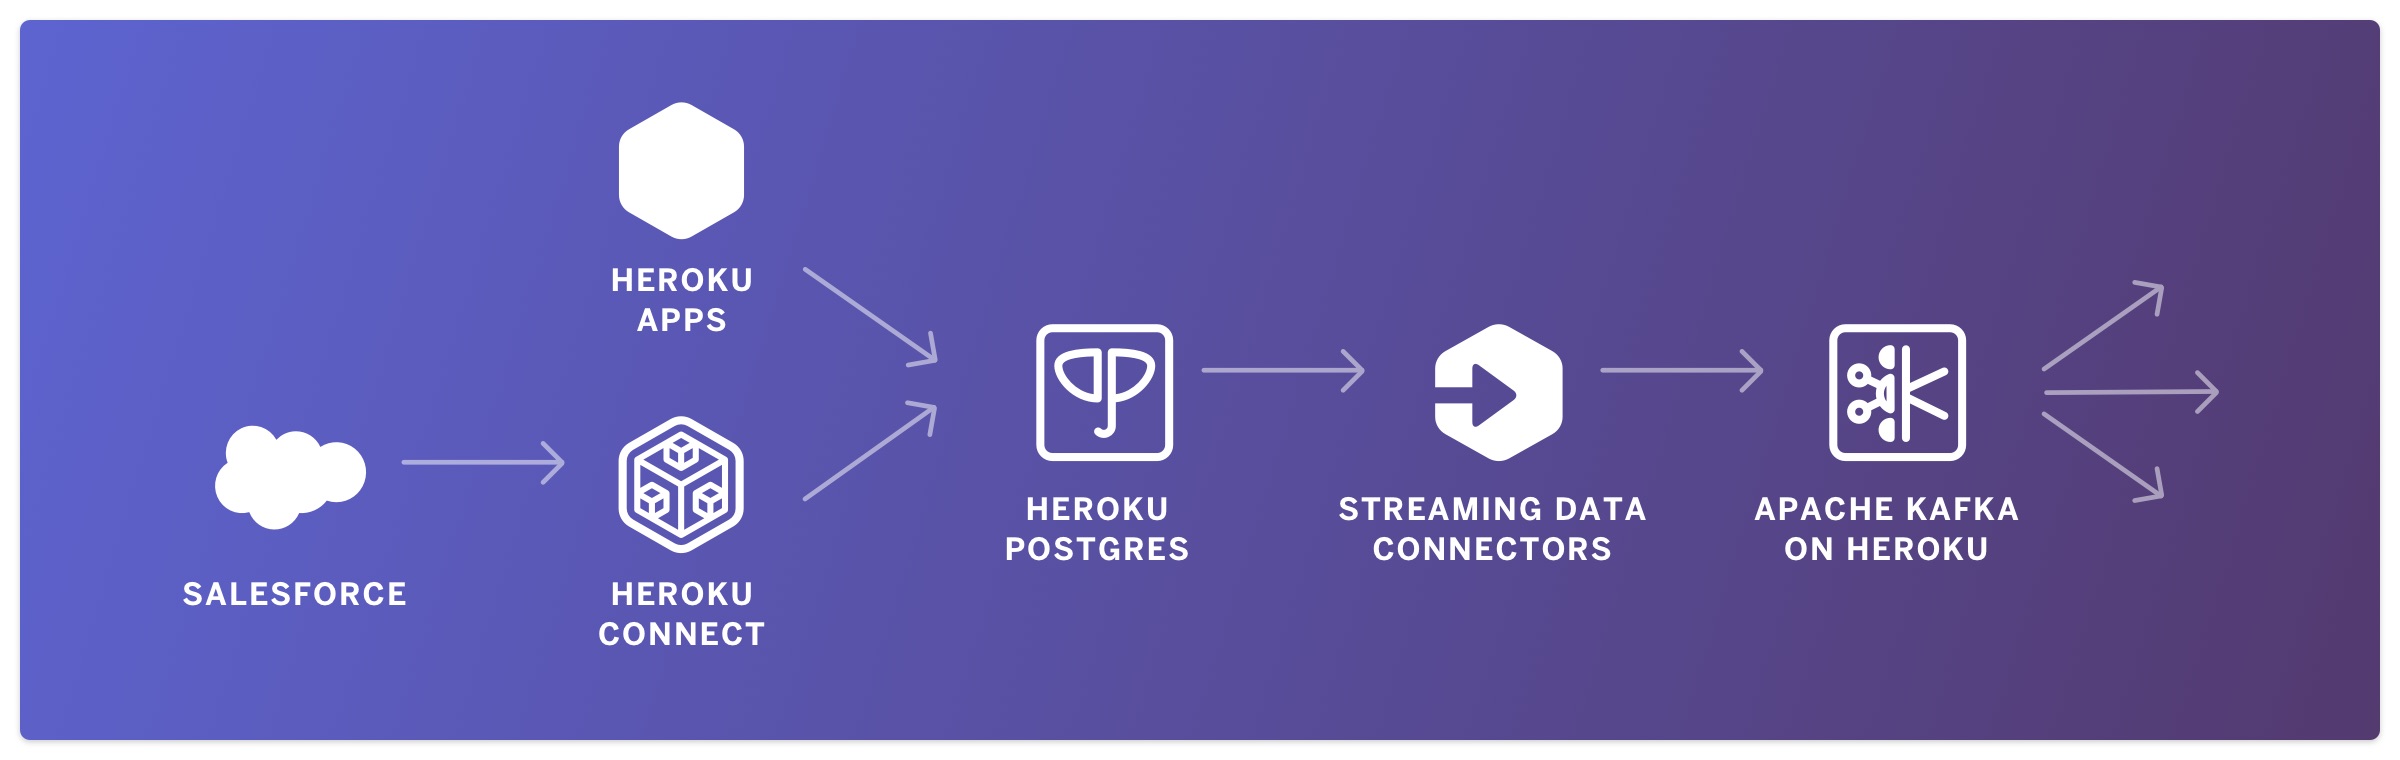
We’ve also made multiple improvements to the beta product to prevent lost events during a Postgres maintenance and minimize lost events during a Postgres failover scenario. We also added an update command to make changes to tables or columns after initial provisioning and updated Debezium to the latest 1.3 release.
It’s as easy as heroku data:connectors:create
To get started, make sure you have the latest CLI plugin. Then create a connector by identifying the Postgres source and Apache Kafka store by name, specifying which table(s) to include, and optionally listing which columns to exclude:
heroku data:connectors:create
  --source postgresql-neato-98765
  --store kafka-lovely-12345
  --table public.posts --table public.users
  --exclude-column public.users.password
See the full instructions and best practices for more detail.
Feedback Welcome
Streaming Data Connectors open a new frontier of data-driven development for our customers and us. We look forward to seeing what you can do with it.
Ready to get started? Contact sales.
The post Heroku Streaming Data Connectors Are Now Generally Available appeared first on Heroku.
]]>As a service provider, when things go wrong, you try to get them fixed as quickly as possible. In addition to technical troubleshooting, there’s a lot of coordination and communication that needs to happen in resolving issues with systems like Heroku’s.
At Heroku we’ve codified our practices around these aspects into an incident response framework. Whether you’re just interested in how incident response works at Heroku, or looking to adopt and apply some of these practices for yourself, we hope…
The post Incident Response at Heroku appeared first on Heroku.
]]>As a service provider, when things go wrong, you try to get them fixed as quickly as possible. In addition to technical troubleshooting, there’s a lot of coordination and communication that needs to happen in resolving issues with systems like Heroku’s.
At Heroku we’ve codified our practices around these aspects into an incident response framework. Whether you’re just interested in how incident response works at Heroku, or looking to adopt and apply some of these practices for yourself, we hope you find this inside look helpful.
Incident Response and the Incident Commander Role
We describe Heroku’s incident response framework below. It’s based on the Incident Command System used in natural disaster response and other emergency response fields. Our response framework and the Incident Commander role in particular help us to successfully respond to a variety of incidents.
When an incident occurs, we follow these steps:
Page an Incident Commander
They will assess the issue, and decide if it’s worth investigating further

Move to a dedicated chat room
The Incident Commander creates a new room in Slack, to centralize all the information for this specific incident
Update public status site
Our customers want information about incidents as quickly as possible, even if it is preliminary. As soon as possible, the IC designates someone to take on the communications role (“comms”) with a first responsibility of updating the status site with our current understanding of the incident and how it’s affecting customers. The admin section of Heroku’s status site helps the comms operator to get this update out quickly:

The status update then appears on status.heroku.com and is sent to customers and internal communication channels via SMS, email, and Slack bot. It also shows on twitter:

Send out internal Situation Report
Next the IC compiles and sends out the first situation report (“sitrep”) to the internal team describing the incident. It includes what we know about the problem, who is working on it and in what roles, and open issues. As the incident evolves, the sitrep acts as a concise description of the current state of the incident and our response to it. A good sitrep provides information to active incident responders, helps new responders get quickly up to date about the situation, and gives context to other observers like customer support staff.
The Heroku status site has a form for the sitrep, so that the IC can update it and the public-facing status details at the same time. When a sitrep is created or updated, it’s automatically distributed internally via email and Slack bot. A versioned log of sitreps is also maintained for later review:


Assess problem
The next step is to assess the problem in more detail. The goals here are to gain better information for the public status communication (e.g. what users are affected and how, what they can do to work around the problem) and more detail that will help engineers fix the problem (e.g. what internal components are affected, the underlying technical cause). The IC collects this information and reflects it in the sitrep so that everyone involved can see it. It includes the severity, going from SEV0 (critical disruption), to SEV4 (minor feature impacted)
Mitigate problem
Once the response team has some sense of the problem, it will try to mitigate customer-facing effects if possible. For example, we may put the Platform API in maintenance mode to reduce load on infrastructure systems, or boot additional instances in our fleet to temporarily compensate for capacity issues. A successful mitigation will reduce the impact of the incident on customer apps and actions, or at least prevent the customer-facing issues from getting worse.
Coordinate response
In coordinating the response, the IC focuses on bringing in the right people to solve the problem and making sure that they have the information they need. The IC can use a Slack bot to page in additional teams as needed (the page will route to the on-call person for that team), or page teams directly.
Manage ongoing response
As the response evolves, the IC acts as an information radiator to keep the team informed about what’s going on. The IC will keep track of who’s active on the response, what problems have been solved and are still open, the current resolution methods being attempted, when we last communicated with customers, and reflect this back to the team regularly with the sitrep mechanism. Finally, the IC is making sure that nothing falls through the cracks: that no problems go unaddressed and that decisions are made in a timely manner.
Post-incident cleanup
Once the immediate incident has been resolved, the IC calls for the team to unwind any temporary changes made during the response. For example, alerts may have been silenced and need to be turned back on. The team double-checks that all monitors are green and that all incidents in PagerDuty have been resolved.
Post-incident follow-up
Finally, the Production Engineering Department will tee up a post-incident follow up. Depending on the severity of the incident, this could be a quick discussion in the normal weekly operational review or a dedicated internal post-mortem with associated public post-mortem post. The post-mortem process often informs changes that we should make to our infrastructure, testing, and process; these are tracked over time within engineering as incident remediation items.
When everything goes south
As Heroku is part of the Salesforce Platform, we leverage Salesforce Incident Response, and Crisis communication center when things gets really bad.
If the severity decided by the IC is SEV1 or worse, Salesforce’s Critical Incident Center (CIC) gets involved. Their role is to assist the Heroku Incident Commander with support around customer communication, and keep the executives informed of the situation. They also can engage the legal teams if needed, mostly for customer communication.
In the case where the incident is believed to be a SEV0 ( major disruption for example ), the Heroku Incident Commander can also request assistance from the Universal Command (UC) Leadership. They will help to assess the issue, and determine if the incident really rises to the level of Sev 0.
Once it is determined to be the case, the UC will spin up a conference call ( called bridge ) involving executives, in order for them to have a single source of truth to follow-up on the incident’s evolution. One of the goals is that executives don’t first learn failures from outsides sources. This may seem obvious, but amidst the stress of a significant incident when we're solely focused on fixing a problem impacting customers, it's easy to overlook communicating status to those not directly involved with solving the problem. They are also much better suited to answer to customers requests, and keep them informed of the incident response.
Incident Response in Other Fields
The incident response framework described above draws from decades of related work in emergency response: natural disaster response, firefighting, aviation, and other fields that need to manage response to critical incidents. We try to learn from this body of work where possible to avoid inventing our incident response policy from first principles.
Two areas of previous work particularly influenced how we approach incident response:
Incident Command System
Our framework draws most directly from the Incident Command System used to manage natural disaster and other large-scale incident responses. This prior art informs our Incident Commander role and our explicit focus on facilitating incident response in addition to directly addressing the technical issues.
Crew Resource Management
The ideas of Crew Resource Management (a different “CRM”) originated in aviation but have since been successfully applied to other fields such as medicine and firefighting. We draw lessons on communication, leadership, and decision-making from CRM into our incident response thinking.
We believe that learning from fields outside of software engineering is a valuable practice, both for operations and other aspects of our business.
Summary
Heroku’s incident response framework helps us quickly resolve issues while keeping customers informed about what’s happening. We hope you’ve found these details about our incident response framework interesting and that they may even inspire changes in how you think about incident response at your own company.
At Heroku we’re continuing to learn from our own experiences and the work of others in related fields. Over time this will mean even better incident response for our platform and better experiences for our customers.
The post Incident Response at Heroku appeared first on Heroku.
]]>We should, however, learn as much as we can from incidents, so we can avoid repeating them.
In this post, we will look at one of those incidents, #2105 , see how it happened (spoiler: I messed up), and what we’re doing to avoid it from happening again (spoiler: I’m not fired).
The post How I Broke `git push heroku main` appeared first on Heroku.
]]>We should, however, learn as much as we can from incidents, so we can avoid repeating them.
In this post, we will look at one of those incidents, #2105, see how it happened (spoiler: I messed up), and what we’re doing to avoid it from happening again (spoiler: I’m not fired).
Git push inception
Our Git server is a component written in Go which can listen for HTTP and SSH connections to process a Git command.
While we try to run all our components as Heroku apps on our platform just like Heroku customers, this component is different, as it has several constraints which make it unsuitable for running on the Heroku platform. Indeed, Heroku currently only provides HTTP routing, so it can’t handle incoming SSH connections.
This component is therefore hosted as a “kernel app” using an internal framework which mimics the behavior of Heroku, but runs directly on virtual servers.
Whenever we deploy new code for this component, we will mark instances running the previous version of the code as poisoned. They won’t be able to receive new requests but will have the time they need to finish processing any ongoing requests (every Git push is one request, and those can take up to one hour).
Once they don’t have any active requests open, the process will stop and restart using the new code.
When all selected instances have been deployed to, we can move to another batch, and repeat until all instances are running the new code.
It was such a nice morning
On September 3, I had to deploy a change to switch from calling one internal API endpoint to another. It included a new authentication method between components.
This deploy was unusual because it required setting a new configuration variable, which includes the following manual actions:
- Set the new config variable with the framework handling our instances
- Run a command to have the new config variable transmitted to every instance
- Trigger the deploy so the config variables starts being used
So, on that morning, I started deploying our staging instance. I set the new configuration variable on both staging and production.
Then, I had the config variables transmitted to every instance, but only in staging as I figured I’d avoid touching production right now.
Finally, I kicked off the staging deployment, and started monitoring that everything went smoothly, which it did.
A few hours later, I went on to production.
Houston, we have a problem
I started my production deployment. Since I had set the configuration variable earlier, I went straight to deploying the new code.
You may see what I did wrong now.
So my code change went to a batch of instances. I didn’t move to another batch though, as I was about to go to lunch. There was no rush to move forward right away, especially since deploying every instance can take several hours.
So I went to lunch, but came back a few minutes later as an alert had gone off.
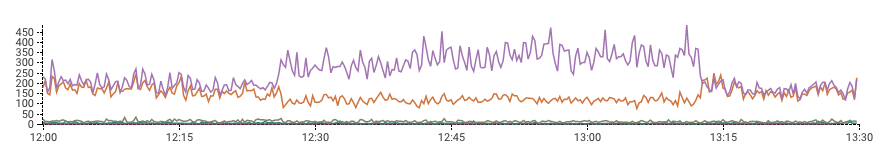
The spike you can see on this graph is HTTP 401 responses.
If you read carefully the previous section, you may have noticed that I set the new configuration variable in production, but didn’t apply it to the instances.
So my deploy to a batch of servers didn’t have the new configuration variable, meaning we were making unauthenticated calls to a private API, which gave us 401 responses. Hence the 401s being sent back publicly.
Once I realized that, I ran the script to transmit the configuration variables to the instances, killed the impacted processes, which restarted using the updated configuration variables, and the problem was resolved.
Did I mess up?
An untrained eye could say “wow, you messed up bad. Why didn’t you run that command?”, and they would be right. Except they actually wouldn’t.
The problem isn’t that I forgot to run one command. It’s that the system has allowed me to go forward with the deployment when it could have helped me avoid the issue.
Before figuring out any solution, the real fix is to do a truly blameless retrospective. If we had been blaming me for forgetting to run a command instead of focusing on why the system still permitted the deployment, I would probably have felt unsafe reporting this issue, and we would not have been able to improve our systems so that this doesn’t happen again.
Then we can focus on solutions. In this specific case, we are going to merge the two steps of updating configuration variables and deploying code into a single step.
That way there isn’t an additional step to remember to run from time to time.
If we didn’t want or were unable to merge the two steps, we could also have added a safeguard in the form of a confirmation warning if we’re trying to deploy the application’s code while configuration variables aren’t synchronized.
Computers are dumb, but they don’t make mistakes
Relying on humans to perform multiple manual actions, especially when some of them are only required rarely (we don’t change configuration variables often) is a recipe for incidents.
Our job as engineers is to build systems that avoid those human flaws, so we can do our human job of thinking about new things, and computers can do theirs: performing laborious and repetitive tasks.
This incident shows how a blameless culture benefits everyone in a company (and customers!). Yes, I messed up. But the fix is to improve the process, not to assign blame. We can’t expect folks to be robots who never make mistakes. Instead, we need to build a system that’s safe enough so those mistakes can’t happen.
The post How I Broke `git push heroku main` appeared first on Heroku.
]]>In addition to the talk, I've gone back and written a full technical recap of each section to revisit it any time you want without going through the video.
I make heavy use of theatrics here,…
The post The Life-Changing Magic of Tidying Ruby Object Allocations appeared first on Heroku.
]]>In addition to the talk, I've gone back and written a full technical recap of each section to revisit it any time you want without going through the video.
I make heavy use of theatrics here, including a Japanese voiceover artist, animoji, and some edited clips of Marie Kondo's Netflix TV show. This recording was done at EuRuKo on a boat. If you've got the time, here's the talk:
- Intro to Tidying Object Allocations
- Tidying Example 1: Active Record respond_to? logic
- Performance and Statistical Significance
- Tidying example 2: Converting strings to time takes time
- Tidying Example 3: Lightning fast cache keys
Intro to Tidying Object Allocations
The core premise of this talk is that we all want faster applications. Here I'm making the pitch that you can get significant speedups by focusing on your object allocations. To do that, I'll eventually show you a few real-world cases of PRs I made to Rails along with a "how-to" that shows how I used profiling and benchmarking to find and fix the hotspots.
At a high level, the "tidying" technique looks like this:
- Take all your object allocations and put them in a pile where you can see them
- Consider each one: Does it spark joy?
- Keep only the objects that spark joy
An object sparks joy if it is useful, keeps your code clean, and does not cause performance problems. If an object is absolutely necessary, and removing it causes your code to crash, it sparks joy.
To put object allocations in front of us we'll use:
To get a sense of the cost of object allocation, we can benchmark two different ways to perform the same logic. One of these allocates an array while the other does not.
require 'benchmark/ips'
def compare_max(a, b)
  return a if a > b
  b
end
def allocate_max(a, b)
  array = [a, b] # <===== Array allocation here
  array.max
end
Benchmark.ips do |x|
  x.report("allocate_max") {
    allocate_max(1, 2)
  }
  x.report("compare_max ") {
    compare_max(1, 2)
  }
  x.compare!
end
This gives us the results:
Warming up --------------------------------------
        allocate_max   258.788k i/100ms
        compare_max    307.196k i/100ms
Calculating -------------------------------------
        allocate_max      6.665M (±14.6%) i/s -     32.090M in   5.033786s
        compare_max      13.597M (± 6.0%) i/s -     67.890M in   5.011819s
Comparison:
        compare_max : 13596747.2 i/s
        allocate_max:  6664605.5 i/s - 2.04x  slower
In this example, allocating an array is 2x slower than making a direct comparison. It's a truism in most languages that allocating memory or creating objects is slow. In the C programming language, it's a truism that "malloc is slow."
Since we know that allocating in Ruby is slow, we can make our programs faster by removing allocations. As a simplifying assumption, I've found that a decrease in bytes allocated roughly corresponds to performance improvement. For example, if I can reduce the number of bytes allocated by 1% in a request, then on average, the request will have been sped up by about 1%. This assumption helps us benchmark faster as it's much easier to measure memory allocated than it is to repeatedly run hundreds or thousands of timing benchmarks.
Tidying Example 1: Active Record respond_to? logic
Using the target application CodeTriage.com and derailed benchmarks, we get a "pile" of memory allocations:
$ bundle exec derailed exec perf:objects
allocated memory by gem
-----------------------------------
    227058  activesupport/lib
    134366  codetriage/app
    # ...
allocated memory by file
-----------------------------------
    126489  …/code/rails/activesupport/lib/active_support/core_ext/string/output_safety.rb
     49448  …/code/codetriage/app/views/layouts/_app.html.slim
     49328  …/code/codetriage/app/views/layouts/application.html.slim
     36097  …/code/rails/activemodel/lib/active_model/type/helpers/time_value.rb
     25096  …/code/codetriage/app/views/pages/_repos_with_pagination.html.slim
     24432  …/code/rails/activesupport/lib/active_support/core_ext/object/to_query.rb
     23526  …/code/codetriage/.gem/ruby/2.5.3/gems/rack-mini-profiler-1.0.0/lib/patches/db/pg.rb
     21912  …/code/rails/activerecord/lib/active_record/connection_adapters/postgresql_adapter.rb
     18000  …/code/rails/activemodel/lib/active_model/attribute_set/builder.rb
     15888  …/code/rails/activerecord/lib/active_record/result.rb
     14610  …/code/rails/activesupport/lib/active_support/cache.rb
     11109  …/code/codetriage/.gem/ruby/2.5.3/gems/rack-mini-profiler-1.0.0/lib/mini_profiler/storage/file_store.rb
      9824  …/code/rails/actionpack/lib/abstract_controller/caching/fragments.rb
      9360  …/.rubies/ruby-2.5.3/lib/ruby/2.5.0/logger.rb
      8440  …/code/rails/activerecord/lib/active_record/attribute_methods.rb
      8304  …/code/rails/activemodel/lib/active_model/attribute.rb
      8160  …/code/rails/actionview/lib/action_view/renderer/partial_renderer.rb
      8000  …/code/rails/activerecord/lib/active_record/integration.rb
      7880  …/code/rails/actionview/lib/action_view/log_subscriber.rb
      7478  …/code/rails/actionview/lib/action_view/helpers/tag_helper.rb
      7096  …/code/rails/actionview/lib/action_view/renderer/partial_renderer/collection_caching.rb
      # ...
The full output is massive, so I've truncated it here.
Once you've got your memory in a pile. I like to look at the "allocated memory" by file. I start at the top and look at each in turn. In this case, we'll look at this file:
8440 …/code/rails/activerecord/lib/active_record/attribute_methods.rb
Once you have a file you want to look at, you can focus on it in derailed like this:
$ ALLOW_FILES=active_record/attribute_methods.rb
  bundle exec derailed exec perf:objects
allocated memory by file
-----------------------------------
      8440  …/code/rails/activerecord/lib/active_record/attribute_methods.rb
allocated memory by location
-----------------------------------
      8000  …/code/rails/activerecord/lib/active_record/attribute_methods.rb:270
       320  …/code/rails/activerecord/lib/active_record/attribute_methods.rb:221
        80  …/code/rails/activerecord/lib/active_record/attribute_methods.rb:189
        40  …/code/rails/activerecord/lib/active_record/attribute_methods.rb:187
Now we can see exactly where the memory is being allocated in this file. Starting at the top of the locations, I'll work my way down to understand how memory is allocated and used. Looking first at this line:
8000 …/code/rails/activerecord/lib/active_record/attribute_methods.rb:270
We can open this in an editor and navigate to that location:
$ bundle open activerecord
In that file, here's the line allocating the most memory:
def respond_to?(name, include_private = false)
  return false unless super
  case name
  when :to_partial_path
    name = "to_partial_path"
  when :to_model
    name = "to_model"
  else
    name = name.to_s # <=== Line 270 here
  end
  # If the result is true then check for the select case.
  # For queries selecting a subset of columns, return false for unselected columns.
  # We check defined?(@attributes) not to issue warnings if called on objects that
  # have been allocated but not yet initialized.
  if defined?(@attributes) && self.class.column_names.include?(name)
    return has_attribute?(name)
  end
  true
end
Here we can see on line 270 that it's allocating a string. But why? To answer that question, we need more context. We need to understand how this code is used. When we call respond_to on an object, we want to know if a method by that name exists. Because Active Record is backed by a database, it needs to see if a column exists with that name.
Typically when you call respond_to you pass in a symbol, for example, user.respond_to?(:email). But in Active Record, columns are stored as strings. On line 270, we're ensuring that the name value is always a string.
This is the code where name is used:
if defined?(@attributes) && self.class.column_names.include?(name)
Here column_names returns an array of column names, and the include? method will iterate over each until it finds the column with that name, or its nothing (nil).
To determine if we can get rid of this allocation, we have to figure out if there's a way to replace it without allocating memory. We need to refactor this code while maintaining correctness. I decided to add a method that converted the array of column names into a hash with symbol keys and string values:
# lib/activerecord/model_schema.rb
def symbol_column_to_string(name_symbol) # :nodoc:
  @symbol_column_to_string_name_hash ||= column_names.index_by(&:to_sym)
  @symbol_column_to_string_name_hash[name_symbol]
end
This is how you would use it:
User.symbol_column_to_string(:email) #=> "email"
User.symbol_column_to_string(:foo)   #=> nil
Since the value that is being returned every time by this method is from the same hash, we can re-use the same string and not have to allocate. The refactored respond_to code ends up looking like this:
def respond_to?(name, include_private = false)
  return false unless super
  # If the result is true then check for the select case.
  # For queries selecting a subset of columns, return false for unselected columns.
  # We check defined?(@attributes) not to issue warnings if called on objects that
  # have been allocated but not yet initialized.
  if defined?(@attributes)
    if name = self.class.symbol_column_to_string(name.to_sym)
      return has_attribute?(name)
    end
  end
  true
end
Running our benchmarks, this patch yielded a reduction in memory of 1%. Using code that eventually became derailed exec perf:library, I verified that the patch made end-to-end request/response page speed on CodeTriage 1% faster.
Performance and Statistical Significance
When talking about benchmarks, it's important to talk about statistics and their impact. I talk a bit about this in Lies, Damned Lies, and Averages: Perc50, Perc95 explained for Programmers. Essentially any time you measure a value, there's a chance that it could result from randomness. If you run a benchmark 3 times, it will give you 3 different results. If it shows that it was faster twice and slower once, how can you be certain that the results are because of the change and not random chance?
That's precisely the question that "statistical significance" tries to answer. While we can never know, we can make an informed decision. How? Well, if you took a measurement of the same code many times, you would know any variation was the result of randomness. This would give you a distribution of randomness. Then you could use this distribution to understand how likely it is that your change was caused by randomness.
In the talk, I go into detail on the origins of "Student's T-Test." In derailed, I've switched to using Kolmogorov-Smirnov instead. When I ran benchmarks on CodeTriage, I wanted to be sure that my results were valid, so I ran them multiple times and ran Kolmogorov Smirnov on them. This gives me a confidence interval. If my results are in that interval, then I can say with 95% certainty that my results are not the result of random chance i.e., that they're valid and are statistically significant.
If it's not significant, it could mean that the change is too small to detect, that you need more samples, or that there is no difference.
In addition to running a significance check on your change, it's useful to see the distribution. Derailed benchmarks does this for you by default now. Here is a result from derailed exec perf:library used to compare the performance difference of two different commits in a library dependency:
                  Histogram - [winner] "I am the new commit."
                           ┌                                        ┐
            [11.2 , 11.28) ┤▇▇▇▇▇▇▇▇▇▇▇▇▇▇ 12
            [11.28, 11.36) ┤▇▇▇▇▇▇▇▇▇▇▇▇▇▇▇▇▇▇▇▇▇▇▇▇▇▇ 22
            [11.35, 11.43) ┤▇▇▇▇▇▇▇▇▇▇▇▇▇▇▇▇▇▇▇▇▇▇▇▇▇▇▇▇▇▇▇▇▇▇▇▇ 30
            [11.43, 11.51) ┤▇▇▇▇▇▇▇▇▇▇▇▇▇▇▇▇▇▇▇▇ 17
   Time (s) [11.5 , 11.58) ┤▇▇▇▇▇▇▇▇▇▇▇▇▇▇▇▇ 13
            [11.58, 11.66) ┤▇▇▇▇▇▇▇ 6
            [11.65, 11.73) ┤ 0
            [11.73, 11.81) ┤ 0
            [11.8 , 11.88) ┤ 0
                           └                                        ┘
                                      # of runs in range
                  Histogram - [loser] "Old commit"
                           ┌                                        ┐
            [11.2 , 11.28) ┤▇▇▇▇ 3
            [11.28, 11.36) ┤▇▇▇▇▇▇▇▇▇▇▇▇▇▇▇▇▇▇▇▇▇▇▇▇▇▇▇ 19
            [11.35, 11.43) ┤▇▇▇▇▇▇▇▇▇▇▇▇▇▇▇▇▇▇▇▇▇▇▇▇ 17
            [11.43, 11.51) ┤▇▇▇▇▇▇▇▇▇▇▇▇▇▇▇▇▇▇▇▇▇▇▇▇▇▇▇▇▇▇▇▇▇▇▇▇ 25
   Time (s) [11.5 , 11.58) ┤▇▇▇▇▇▇▇▇▇▇▇▇▇▇▇▇▇▇▇▇▇▇ 15
            [11.58, 11.66) ┤▇▇▇▇▇▇▇▇▇▇▇▇▇▇▇▇▇▇▇ 13
            [11.65, 11.73) ┤▇▇▇▇ 3
            [11.73, 11.81) ┤▇▇▇▇ 3
            [11.8 , 11.88) ┤▇▇▇ 2
                           └                                        ┘
                                      # of runs in range
The TLDR of this whole section is that in addition to showing my change as being faster, I was also able to show that the improvement was statistically significant.
Tidying example 2: Converting strings to time takes time
One percent faster is good, but it could be better. Let's do it again. First, get a pile of objects:
$ bundle exec derailed exec perf:objects
# ...
allocated memory by file
-----------------------------------
    126489  …/code/rails/activesupport/lib/active_support/core_ext/string/output_safety.rb
     49448  …/code/codetriage/app/views/layouts/_app.html.slim
     49328  …/code/codetriage/app/views/layouts/application.html.slim
     36097  …/code/rails/activemodel/lib/active_model/type/helpers/time_value.rb
     25096  …/code/codetriage/app/views/pages/_repos_with_pagination.html.slim
     24432  …/code/rails/activesupport/lib/active_support/core_ext/object/to_query.rb
     23526  …/code/codetriage/.gem/ruby/2.5.3/gems/rack-mini-profiler-1.0.0/lib/patches/db/pg.rb
     21912  …/code/rails/activerecord/lib/active_record/connection_adapters/postgresql_adapter.rb
     18000  …/code/rails/activemodel/lib/active_model/attribute_set/builder.rb
     15888  …/code/rails/activerecord/lib/active_record/result.rb
     14610  …/code/rails/activesupport/lib/active_support/cache.rb
     11148  …/code/codetriage/.gem/ruby/2.5.3/gems/rack-mini-profiler-1.0.0/lib/mini_profiler/storage/file_store.rb
      9824  …/code/rails/actionpack/lib/abstract_controller/caching/fragments.rb
      9360  …/.rubies/ruby-2.5.3/lib/ruby/2.5.0/logger.rb
      8304  …/code/rails/activemodel/lib/active_model/attribute.rb
Zoom in on a file:
36097 …/code/rails/activemodel/lib/active_model/type/helpers/time_value.rb
Isolate the file:
$ ALLOW_FILE=active_model/type/helpers/time_value.rb
  bundle exec derailed exec perf:objects
Total allocated: 39617 bytes (600 objects)
Total retained:  0 bytes (0 objects)
allocated memory by gem
-----------------------------------
     39617  activemodel/lib
allocated memory by file
-----------------------------------
     39617  …/code/rails/activemodel/lib/active_model/type/helpers/time_value.rb
allocated memory by location
-----------------------------------
     17317  …/code/rails/activemodel/lib/active_model/type/helpers/time_value.rb:72
     12000  …/code/rails/activemodel/lib/active_model/type/helpers/time_value.rb:74
      6000  …/code/rails/activemodel/lib/active_model/type/helpers/time_value.rb:73
      4300  …/code/rails/activemodel/lib/active_model/type/helpers/time_value.rb:64
We're going to do the same thing by starting to look at the top location:
17317 …/code/rails/activemodel/lib/active_model/type/helpers/time_value.rb:72
Here's the code:
def fast_string_to_time(string)
 if string =~ ISO_DATETIME # <=== line 72 Here
   microsec = ($7.to_r * 1_000_000).to_i
   new_time $1.to_i, $2.to_i, $3.to_i, $4.to_i, $5.to_i, $6.to_i, microsec
 end
end
On line 72, we are matching the input string with a regular expression constant. This allocates a lot of memory because each grouped match of the regular expression allocates a new string. To understand if we can make this faster, we have to understand how it's used.
This method takes in a string, then uses a regex to split it into parts, and then sends those parts to the new_time method.
There's not much going on that can be sped up there, but what's happening on this line:
microsec = ($7.to_r * 1_000_000).to_i
Here's the regex:
ISO_DATETIME = /A(d{4})-(dd)-(dd) (dd):(dd):(dd)(.d+)?z/
When I ran the code and output $7 from the regex match, I found that it would contain a string that starts with a dot and then has numbers, for example:
puts $7 # => ".1234567"
This code wants microseconds as an integer, so it turns it into a "rational" and then multiplies it by a million and turns it into an integer.
($7.to_r * 1_000_000).to_i # => 1234567
You might notice that it looks like we're basically dropping the period and then turning it into an integer. So why not do that directly?
Here's what it looks like:
def fast_string_to_time(string)
  if string =~ ISO_DATETIME
    microsec_part = $7
    if microsec_part && microsec_part.start_with?(".") && microsec_part.length == 7
      microsec_part[0] = ""         # <=== HERE
      microsec = microsec_part.to_i # <=== HERE
    else
      microsec = (microsec_part.to_r * 1_000_000).to_i
    end
    new_time $1.to_i, $2.to_i, $3.to_i, $4.to_i, $5.to_i, $6.to_i, microsec
  end
We've got to guard this case by checking for the conditions of our optimization. Now the question is: is this faster?
Here's a microbenchmark:
original_string = ".443959"
require 'benchmark/ips'
Benchmark.ips do |x|
  x.report("multiply") {
    string = original_string.dup
    (string.to_r * 1_000_000).to_i
  }
  x.report("new     ") {
    string = original_string.dup
    if string && string.start_with?(".".freeze) && string.length == 7
      string[0] = ''.freeze
      string.to_i
    end
  }
  x.compare!
end
# Warming up --------------------------------------
#             multiply   125.783k i/100ms
#             new        146.543k i/100ms
# Calculating -------------------------------------
#             multiply      1.751M (± 3.3%) i/s -      8.805M in   5.033779s
#             new           2.225M (± 2.1%) i/s -     11.137M in   5.007110s
# Comparison:
#             new     :  2225289.7 i/s
#             multiply:  1751254.2 i/s - 1.27x  slower
The original code is 1.27x slower. YAY!
Tidying Example 3: Lightning fast cache keys
The last speedup is kind of underwhelming, so you might wonder why I added it. If you remember our first example of optimizing respond_to, it helped to understand the broader context of how it's used. Since this is such an expensive object allocation location, is there an opportunity to call it less or not call it at all?
To find out, I added a puts caller in the code and re-ran it. Here's part of a backtrace:
====================================================================================================
…/code/rails/activemodel/lib/active_model/type/date_time.rb:25:in `cast_value'
…/code/rails/activerecord/lib/active_record/connection_adapters/postgresql/oid/date_time.rb:16:in `cast_value'
…/code/rails/activemodel/lib/active_model/type/value.rb:38:in `cast'
…/code/rails/activemodel/lib/active_model/type/helpers/accepts_multiparameter_time.rb:12:in `block in initialize'
…/code/rails/activemodel/lib/active_model/type/value.rb:24:in `deserialize'
…/.rubies/ruby-2.5.3/lib/ruby/2.5.0/delegate.rb:349:in `block in delegating_block'
…/code/rails/activerecord/lib/active_record/attribute_methods/time_zone_conversion.rb:8:in `deserialize'
…/code/rails/activemodel/lib/active_model/attribute.rb:164:in `type_cast'
…/code/rails/activemodel/lib/active_model/attribute.rb:42:in `value'
…/code/rails/activemodel/lib/active_model/attribute_set.rb:48:in `fetch_value'
…/code/rails/activerecord/lib/active_record/attribute_methods/read.rb:77:in `_read_attribute'
…/code/rails/activerecord/lib/active_record/attribute_methods/read.rb:40:in `__temp__57074616475646f51647'
…/code/rails/activesupport/lib/active_support/core_ext/object/try.rb:16:in `public_send'
…/code/rails/activesupport/lib/active_support/core_ext/object/try.rb:16:in `try'
…/code/rails/activerecord/lib/active_record/integration.rb:99:in `cache_version'
…/code/rails/activerecord/lib/active_record/integration.rb:68:in `cache_key'
…/code/rails/activesupport/lib/active_support/cache.rb:639:in `expanded_key'
…/code/rails/activesupport/lib/active_support/cache.rb:644:in `block in expanded_key'
…/code/rails/activesupport/lib/active_support/cache.rb:644:in `collect'
…/code/rails/activesupport/lib/active_support/cache.rb:644:in `expanded_key'
…/code/rails/activesupport/lib/active_support/cache.rb:608:in `normalize_key'
…/code/rails/activesupport/lib/active_support/cache.rb:565:in `block in read_multi_entries'
…/code/rails/activesupport/lib/active_support/cache.rb:564:in `each'
…/code/rails/activesupport/lib/active_support/cache.rb:564:in `read_multi_entries'
…/code/rails/activesupport/lib/active_support/cache.rb:387:in `block in read_multi'
I followed it backwards until I hit these two places:
…/code/rails/activerecord/lib/active_record/integration.rb:99:in `cache_version'
…/code/rails/activerecord/lib/active_record/integration.rb:68:in `cache_key'
It looks like this expensive code is being called while generating a cache key.
def cache_key(*timestamp_names)
  if new_record?
    "#{model_name.cache_key}/new"
  else
    if cache_version && timestamp_names.none? # <== line 68 here
      "#{model_name.cache_key}/#{id}"
    else
      timestamp = if timestamp_names.any?
        ActiveSupport::Deprecation.warn(<<-MSG.squish)
          Specifying a timestamp name for #cache_key has been deprecated in favor of
          the explicit #cache_version method that can be overwritten.
        MSG
        max_updated_column_timestamp(timestamp_names)
      else
        max_updated_column_timestamp
      end
      if timestamp
        timestamp = timestamp.utc.to_s(cache_timestamp_format)
        "#{model_name.cache_key}/#{id}-#{timestamp}"
      else
        "#{model_name.cache_key}/#{id}"
      end
    end
  end
end
On line 68 in the cache_key code it calls cache_version. Here's the code for cache_version:
def cache_version # <== line 99 here
  if cache_versioning && timestamp = try(:updated_at)
    timestamp.utc.to_s(:usec)
  end
end
Here is our culprit:
timestamp = try(:updated_at)
What is happening is that some database adapters, such as the one for Postgres, returned their values from the database driver as strings. Then active record will lazily cast them into Ruby objects when they are needed. In this case, our time value method is being called to convert the updated timestamp into a time object so we can use it to generate a cache version string.
Here's the value before it's converted:
User.first.updated_at_before_type_cast # => "2019-04-24 21:21:09.232249"
And here's the value after it's converted:
User.first.updated_at.to_s(:usec) # => "20190424212109232249"
Basically, all the code is doing is trimming out the non-integer characters. Like before, we need a guard that our optimization can be applied:
# Detects if the value before type cast
# can be used to generate a cache_version.
#
# The fast cache version only works with a
# string value directly from the database.
#
# We also must check if the timestamp format has been changed
# or if the timezone is not set to UTC then
# we cannot apply our transformations correctly.
def can_use_fast_cache_version?(timestamp)
  timestamp.is_a?(String) &&
    cache_timestamp_format == :usec &&
    default_timezone == :utc &&
    !updated_at_came_from_user?
end
Then once we're in that state, we can modify the string directly:
# Converts a raw database string to `:usec`
# format.
#
# Example:
#
#   timestamp = "2018-10-15 20:02:15.266505"
#   raw_timestamp_to_cache_version(timestamp)
#   # => "20181015200215266505"
#
# PostgreSQL truncates trailing zeros,
# https://github.com/postgres/postgres/commit/3e1beda2cde3495f41290e1ece5d544525810214
# to account for this we pad the output with zeros
def raw_timestamp_to_cache_version(timestamp)
  key = timestamp.delete("- :.")
  if key.length < 20
    key.ljust(20, "0")
  else
    key
  end
end
There's some extra logic due to the Postgres truncation behavior linked above. The resulting code to cache_version becomes:
def cache_version
  return unless cache_versioning
  if has_attribute?("updated_at")
    timestamp = updated_at_before_type_cast
    if can_use_fast_cache_version?(timestamp)
      raw_timestamp_to_cache_version(timestamp)
    elsif timestamp = updated_at
      timestamp.utc.to_s(cache_timestamp_format)
    end
  end
end
That's the opportunity. What's the impact?
Before: Total allocated: 743842 bytes (6626 objects)
After:  Total allocated: 702955 bytes (6063 objects)
The bytes reduced is 5% fewer allocations. Which is pretty good. How does it translate to speed?
It turns out that time conversion is very CPU intensive and changing this code makes the target application up to 1.12x faster. This means that if your app previously required 100 servers to run, it can now run with about 88 servers.
Wrap up
Adding together these optimizations and others brings the overall performance improvement to 1.23x or a net reduction of 19 servers. Basically, it's like buying 4 servers and getting 1 for free.
These examples were picked from my changes to the Rails codebase, but you can use them to optimize your applications. The general framework looks like this:
- Get a list of all your memory
- Zoom in on a hotspot
- Figure out what is causing that memory to be allocated inside of your code
- Ask if you can refactor your code to not depend on those allocations
If you want to learn more about memory, here are my recommendations:
- Why does my App's Memory Use Grow Over Time? – Start here, an excellent high-level overview of what causes a system's memory to grow that will help you develop an understanding of how Ruby allocates and uses memory at the application level.
- Complete Guide to Rails Performance (Book) – This book is by Nate Berkopec and is excellent. I recommend it to someone at least once a week.
- How Ruby uses memory – This is a lower level look at precisely what "retained" and "allocated" memory means. It uses small scripts to demonstrate Ruby memory behavior. It also explains why the "total max" memory of our system rarely goes down.
- How Ruby uses memory (Video) – If you're new to the concepts of object allocation, this might be an excellent place to start (you can skip the first story in the video, the rest are about memory). Memory stuff starts at 13 minutes
- Jumping off the Ruby Memory Cliff – Sometimes you might see a 'cliff' in your memory metrics or a saw-tooth pattern. This article explores why that be
The post The Life-Changing Magic of Tidying Ruby Object Allocations appeared first on Heroku.
]]>
Serendipity manifests a new idea
It all started at a wedding. GNAR Founder Brandon Stewart found himself chatting…
The post How to Transform a Heavy Industry, One Sensor at a Time appeared first on Heroku.
]]>
Serendipity manifests a new idea
It all started at a wedding. GNAR Founder Brandon Stewart found himself chatting with Adam Gray, the son of RMS Intermodal’s President, and the conversation turned to RFID tracking. Brandon had done some work on an RFID solution for running events, and Adam was curious about the technology. Could it be applied to his father’s rail yards in order to harness the chaotic swirl of trucks and forklifts and cranes?
The two men put their heads together and spent the next few months researching the problem space. “We visited two local RMS sites in California and surveyed over 40 locations,” Brandon says. “We sat inside the trucks, and watched how people worked. We met with managers, crews, and executives to better understand their day-to-day challenges as well as the industry at large.”
The traditional way: radios, clipboards, and Excel to manage a lot of moving parts
Looking at rail yard operations, Brandon and Adam found that efficiency is measured by job completion speed and workforce costs. Fundamentally, it’s all about how fast the crew can get shipping containers on and off a train, with a number of specialized equipment involved in moving the heavy boxes. The goal is to have the right number of workers doing the right activities at the right moment.
The yard manager typically has a 24-hour window to prepare for an incoming train and can use a terminal operating system (TOS) — train industry software — to get the arrival time, container count, and track number. That time is precious, as once the train arrives, a flurry of activity begins.
The manager drives around the yard to corral the crew and delivers orders via two-way radio. Forklifts stack trailers alongside the train track, almost like “staging” the train. The crane then comes and starts pulling boxes off the train and dropping them onto the trailers. A hostler truck connects to the trailer and moves the container to a designated place in the yard, where it is unloaded and stored.
Throughout the process, the manager is trying to stay on top of all the moving parts, but, in a large yard that staffs up to 70 workers at a time, it can be tough. Managers are challenged to keep all workers actively engaged, but they often struggle to have direct visibility into basic operations, like which worker is operating which vehicle. This is primarily due to the long rectangular layout of the yards and rows of stacked containers (similar to a large outdoor warehouse). Meanwhile, the clock is ticking and the train needs to get unloaded as quickly as possible.
It doesn’t stop there. Once the job is complete, the manager fills out a clipboard full of paperwork, which then gets sent to the head office for record keeping and billing purposes, much of it stored in Excel spreadsheets. This adds extra time and overhead for managers as well as office staff.
The new way: an IoT platform for efficient rail yard management
Inspired by ride-hailing apps like Uber and Lyft, Adam, Brandon, and the GNAR team designed a solution that uses GPS coordinates streamed from Android tablets in each vehicle. Their new platform, Intrmodl, turns the vehicles themselves into connected IoT devices that could send real-time data to a central platform for processing and analytics. The driver app not only tracks its vehicle’s location in the yard across time, but also logs usage stats, like fuel level and engine hours, and travel paths and duration, as well as vehicle inspection details.
Managers now have a bird’s eye view of all their workers and vehicles in a dedicated manager’s app. During unloading activity, they can track precisely who’s doing what and take quick action to correct or fine-tune the activities. Managers can forgo the radio and communicate with one or the whole crew via the app, as well as stay on top of maintenance needs. The app also makes it easier for managers to perform audits and site inspections.
For upper management, the main platform provides business analytics that helps them track patterns in site activity and the overall performance of their operations across all their yards. Execs can see metrics the following day rather than waiting until the end of the month to see what happened yesterday. The data is useful to the business in a number of ways, such as informing profitability targets or bids to train companies. Brandon says, “Our data shows train companies how a yard adds even more value by demonstrating consistent levels of efficiency.”
Extracting meaning from a firehose of data
Every two seconds, live sensors in each vehicle stream massive amounts of data into the Intrmodl platform. One of the challenges for the development team was how to clean and distill all that data into a couple of bytes of really useful, actionable insights for the leadership to access quickly. “We maintain a three tier or three reservoir kind of setup,” says Brandon, “where the live data is constantly coming in and we're queueing it and making sure that we're digesting it and keeping everything in order.” They also had to figure out a way to flush data from the database once it’s no longer needed.
Another challenge was how to loop in signature moments in the workday, such as going on break. So, they set up sessions that define triggers for those signature moments to kick in and inform how data is captured during the break and ensures that work time data is more meaningful.
A third challenge was how to build a daily report that included a calculated overall metric for the day and allow it to be queryable. This would help managers quickly see if their productivity was on target — perhaps 10% ahead or 20% behind — compared to a rolling average.
The path to par: defining what top performance looks like
Previously, RMS had a hard time determining true benchmarks for performance metrics due to the lack of visibility across yard activities. “They never knew exactly what par was for them,” says Brandon. “They only had an idea of what par was. Now, they can identify more granular targets for specific vehicles and tasks that are based in real-time data.” Managers can set realistic performance expectations across the team, and reward star workers or coach underperformers. Metrics vary from yard to yard due to the variety of services that each yard offers to train companies.
The heavy-lifting is now easier for more yards, and more industries
RMS Intermodal’s digital strategy is paying off. With data insights readily available, the business can make better decisions and strengthen relationships with train companies and other partners. Today, Intrmodl has been fully deployed in six RMS yards, and about 50 others use some aspect of the platform.
Going forward, Brandon and the GNAR team are continuing to work on enhancements. They’re looking to take advantage of more tablet sensor capabilities to further map vehicle movements and workflows. They also plan to address improvements to billing and forecasting. Brandon also helped RMS hire their first IT team who will eventually take the platform in-house.
RMS is an innovator in a deeply traditional industry, but their ideas don’t end with rail yards. One exciting aspect of the Intrmodl technology is that it’s flexible enough to apply to other industry use cases, such as automobile transportation. RMS owns their own fleet of trucks and also operates yards for storing shipments of new cars.
The RMS story is only the beginning. Brandon can envision the IoT platform serving other traditional industries that orchestrate the movement of heavy things and vehicles. Airlines, shipping, construction, mining, warehousing — all can benefit from real-time data insights from a complex dance of moving parts. Wherever their clients want to put a sensor, the platform is ready to make sense of it.
Read the GNAR case study to learn more about Intrmodl on Heroku.
Listen to the Code[ish] podcast featuring Brandon Stewart and Yuri Oliveira: Monitoring Productivity Through IoT.
The post How to Transform a Heavy Industry, One Sensor at a Time appeared first on Heroku.
]]>In this article, we'll take a look at some easier ways to…
The post Let’s Debug a Node.js Application appeared first on Heroku.
]]>In this article, we'll take a look at some easier ways to debug your Node.js applications.
Logging
Of course, no developer toolkit is complete without logging. We tend to place console.log statements all over our code in local development, but this is not a really scalable strategy in production. You would likely need to do some filtering and cleanup, or implement a consistent logging strategy, in order to identify important information from genuine errors.
Instead, to implement a proper log-oriented debugging strategy, use a logging tool like Pino or Winston. These will allow you to set log levels (INFO, WARN, ERROR), allowing you to print verbose log messages locally and only severe ones for production. You can also stream these logs to aggregators, or other endpoints, like LogStash, Papertrail, or even Slack.
Working with Node Inspect and Chrome DevTools
Logging can only take us so far in understanding why an application is not working the way we would expect. For sophisticated debugging sessions, we will want to use breakpoints to inspect how our code behaves at the moment it is being executed.
To do this, we can use Node Inspect. Node Inspect is a debugging tool which comes with Node.js. It's actually just an implementation of Chrome DevTools for your program, letting you add breakpoints, control step-by-step execution, view variables, and follow the call stack.
There are a couple of ways to launch Node Inspect, but the easiest is perhaps to just call your Node.js application with the --inspect-brk flag:
$ node --inspect-brk $your_script_name

After launching your program, head to the chrome://inspect URL in your Chrome browser to get to the Chrome DevTools. With Chrome DevTools, you have all of the capabilities you'd normally expect when debugging JavaScript in the browser. One of the nicer tools is the ability to inspect memory. You can take heap snapshots and profile memory usage to understand how memory is being allocated, and potentially, plug any memory leaks.
Using a supported IDE
Rather than launching your program in a certain way, many modern IDEs also support debugging Node applications. In addition to having many of the features found in Chrome DevTools, they bring their own features, such as creating logpoints and allowing you to create multiple debugging profiles. Check out the Node.js' guide on inspector clients for more information on these IDEs.
Using NDB
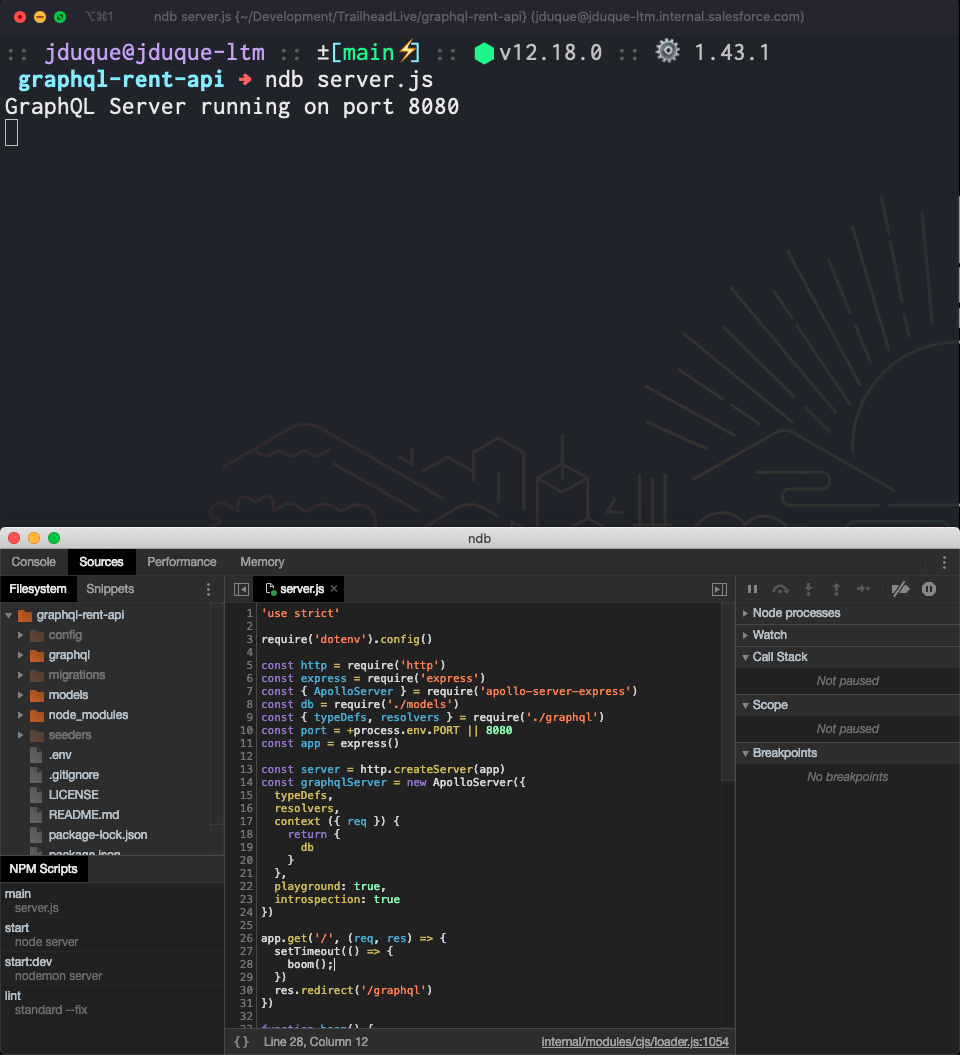
Another option is to install ndb, a standalone debugger for Node.js. It makes use of the same DevTools that are available in the browser, just as an isolated, local debugger. It also has some extra features that aren't available in DevTools. It supports edit-in-place, which means you can make changes to your code and have the updated logic supported directly by the debugger platform. This is very useful for doing quick iterations.
Post-Mortem Debugging
Suppose your application crashes due to a catastrophic error, like a memory access error. These may be rare, but they do happen, particularly if your app relies on native code.
To investigate these sorts of issues, you can use llnode. When your program crashes, llnode can be used to inspect JavaScript stack frames and objects by mapping them to objects on the C/C++ side. In order to use it, you first need a core dump of your program. To do this, you will need to use process.abort instead of process.exit to shut down processes in your code. When you use process.abort, the Node process generates a core dump file on exit.
To better understand what llnode can provide, here is a video which demonstrates some of its capabilities.
Useful Node Modules
Aside from all of the above, there are also a few third-party packages that we can recommend for further debugging.
debug
The first of these is called, simply enough, debug. With debug, you can assign a specific namespace to your log messages, based on a function name or an entire module. You can then selectively choose which messages are printed to the console via a specific environment variable.
For example, here's a Node.js server which is logging several messages from the entire application and middleware stack, like sequelize, express:application, and express:router:

If we set the DEBUG environment variable to express:router and start the same program, only the messages tagged as express:router are shown:

By filtering messages in this way, we can hone in on how a single segment of the application is behaving, without needing to drastically change the logging of the code.
trace and clarify
Two more modules that go together are trace and clarify.
trace augments your asynchronous stack traces by providing much more detailed information on the async methods that are being called, a roadmap which Node.js does not provide by default. clarify helps by removing all of the information from stack traces which are specific to Node.js internals. This allows you to concentrate on the function calls that are just specific to your application.
Neither of these modules are recommended for running in production! You should only enable them when debugging issues in your local development environment.
Find out more
If you'd like to follow along with how to use these debugging tools in practice, here is a video recording which provides more detail. It includes some live demos of how to narrow in on problems in your code. Or, if you have any other questions, you can find me on Twitter @julian_duque!
The post Let’s Debug a Node.js Application appeared first on Heroku.
]]>TOML is a minimal configuration file format that's easy to read because of its simple semantics. You can learn more about TOML from the official documentation , but a simple buildpack TOML file looks like this:
api = "0.2"
[buildpack]
id = "heroku/maven"
version = "1.0"
name = "Maven"
Unlike YAML, TOML doesn’t rely on significant whitespace…
The post Ground Control to Major TOML: Why Buildpacks Use a Most Peculiar Format appeared first on Heroku.
]]>TOML is a minimal configuration file format that's easy to read because of its simple semantics. You can learn more about TOML from the official documentation, but a simple buildpack TOML file looks like this:
api = "0.2"
[buildpack]
id = "heroku/maven"
version = "1.0"
name = "Maven"
Unlike YAML, TOML doesn’t rely on significant whitespace with difficult to read indentation. TOML is designed to be human readable, which is why it favors simple structures. It’s also easy for machines to read and write; you can even append to a TOML file without reading it first, which makes it a great data interchange format. But data interchange and machine readability aren’t the main driver for using TOML in the Buildpacks project; it’s humans.

Put Your Helmet On
The first time you use Buildpacks, you probably won’t need to write a TOML file. Buildpacks are designed to get out of your way, and disappear into the details. That’s why there’s no need for large configuration files like a Helm values.yaml or a Kubernetes pod configuration.
Buildpacks favor convention over configuration, and therefore don’t require complex customizations to tweak the inner workings of its tooling. Instead, Buildpacks detect what to do based on the contents of an application, which means configuration is usually limited to simple properties that are defined by a human.
Buildpacks also favor infrastructure as imperative code (rather than declarative). Buildpacks themselves are functions that run against an application, and are best implemented in higher level languages, which can use libraries and testing.
All of these properties lend to a simple configuration format and schema that doesn’t define complex structures. But that doesn’t mean the decision to use TOML was simple.
Can You Hear Me, Major TOML?
There are many other formats the Buildpacks project could have used besides YAML or TOML, and the Buildpacks core team considered all of these in the early days of the project.
JSON has simple syntax and semantics that are great for data interchange, but it doesn’t make a great human-readable format; in part because it doesn’t allow for comments. Buildpacks use JSON for machine readable config, like the OCI image metadata. But it shouldn’t be used for anything a human writes.
XML has incredibly powerful properties including schema validation, transformation tools, and rich semantics. It’s great for markup (like HTML) but it's much too heavy of a format for what Buildpacks require.
In the end, the Buildpacks project was comfortable choosing TOML because there was solid prior art (even though the format is somewhat obscure). In the cloud native ecosystem, the containerd project uses TOML. Additionally, many language ecosystem tools like Cargo (for Rust) and Poetry (for Python) use TOML to configure application dependencies.
Commencing Countdown, Engines On
The main disadvantage of TOML is its ubiquity. Tools that parse and query TOML files (something comparable to jq) aren’t readily available, and the format can still be jarring to new users even though it’s fairly simple.
Every trend has to start somewhere, and the Cloud Native Buildpacks project is happy to be one of the projects stepping through the door.
If you want to learn more or have any questions around Cloud Native Buildpacks, we will be hosting a Live AMA at Hackernoon on July 28th at 2pm PDT. See you there!
The post Ground Control to Major TOML: Why Buildpacks Use a Most Peculiar Format appeared first on Heroku.
]]>In today's global economy, English proficiency unlocks opportunity. People all over the world are motivated to improve their English skills in order to make a better life for themselves and their families. Cambly is a language education platform that helps millions of learners advance their careers by connecting them with English-speaking tutors from a similar professional background.
For many language learners, speaking is often the hardest skill to improve in a classroom setting. Conversation time is limited, and students tend to practice with each other rather than with a teacher. Some students may not have a…
The post How a Live Tutoring Platform Helps the Working World Get Ahead appeared first on Heroku.
]]>
In today's global economy, English proficiency unlocks opportunity. People all over the world are motivated to improve their English skills in order to make a better life for themselves and their families. Cambly is a language education platform that helps millions of learners advance their careers by connecting them with English-speaking tutors from a similar professional background.
For many language learners, speaking is often the hardest skill to improve in a classroom setting. Conversation time is limited, and students tend to practice with each other rather than with a teacher. Some students may not have a fluent speaker available in their location. Cambly offers one-on-one tutoring sessions over live video chat, 24/7. Students anywhere in the world can practice speaking with a tutor at any time during their busy day, whether it’s for 15 minutes on their lunch break or late at night when the kids are asleep.
Cambly’s “Hello, World” moment
Two important developments in mobile hardware paved the way for Cambly’s founders, Kevin Law and Sameer Shariff, to bring their vision to life. Smartphones started coming out with front-facing cameras, and broadband internet connections became widespread across devices and markets. For the first time, most people had hardware that could support live video chat without having to strap a USB camera to their laptop.
The founders took full advantage of these features and developed an MVP for iOS. That first app was super simple. When a user pressed a button to initiate a tutoring session, Kevin’s phone would ring and he’d run to a computer to join the video chat. Cambly has since evolved from there, of course, but these early experiences proved that the founders had a market.
In the beginning, Kevin was the only tutor available, and his very first chat took him, and his caller, by complete surprise. An App Store reviewer was just testing the app and had hit the call button to see what would happen. When Kevin suddenly appeared in the app and said “Hi,” the reviewer panicked and hung up! As the calls started rolling in, many people like the Apple Reviewer were shocked to have a live person appear in the app just moments after downloading it. Kevin says, “I had some pretty funny conversations in those days. But on-demand service has always been an important part of Cambly, especially for that first-time user experience.”

The working world speaks on Cambly
Over time, Kevin met hundreds of people from around the world. Many people had never spoken with a native English speaker, even though they had been taking English classes throughout their lives. Many were professionals who excelled at their jobs, but needed to improve their English speaking skills in order to advance their careers. English fluency would help learners communicate better in the workplace, ace a job interview at an international company, or attract more English-speaking clients.
“It proved our hypothesis,” says Kevin. “I’m not a professional English teacher; I’m a software engineer. I thought that there may be a lot of people who have studied English for a long time that would be interested in talking to me.”
Not only do tutors teach language skills, but they also help learners understand the culture and context of their industry in a different country. For example, a registered nurse may want to understand patient etiquette in the U.K., or a tour operator may want to know more about Australian cultural norms. As Kevin points out, “I’ll speak with software engineers who want to know what engineering teams in the U.S. care most about. They want to learn insider lingo, as well as how to pronounce technology brands and terms like a native speaker.”
The global diversity of tutors on Cambly is also a major bonus. Many learners want to practice speaking with tutors with different regional accents to enhance their listening and pronunciation skills.
The (not so) secret language of pilots
Kevin and Sameer soon discovered that it’s not just software engineers who want to practice their English with other engineers. Learners from a wide range of industries flock to Cambly to speak with tutors from the same background. The platform predominantly attracts sales and business professionals, as well as people from healthcare, government, tourism, and many other sectors. All want to practice their speaking skills with the opportunity to learn industry-specific vocabulary and pronunciation, as well as cultural and regional differences.
“Often, people just want to talk with someone who understands what they do for a living,” says Kevin. “With their English-speaking counterpart, they can go much deeper than casual conversation and get themselves ready to converse in a professional way.”
Sometimes, these industry segments develop organically on Cambly in surprising ways. At one point, the founders noticed a trend with one small group of tutors: retired airplane pilots. These tutors happened to be booked solid, even though Cambly did not specifically target their particular industry. It turned out, one of Cambly’s students was a pilot for Turkish Airlines who had posted about his experience in an online forum for pilots. His colleagues saw the post and were inspired to try Cambly themselves.
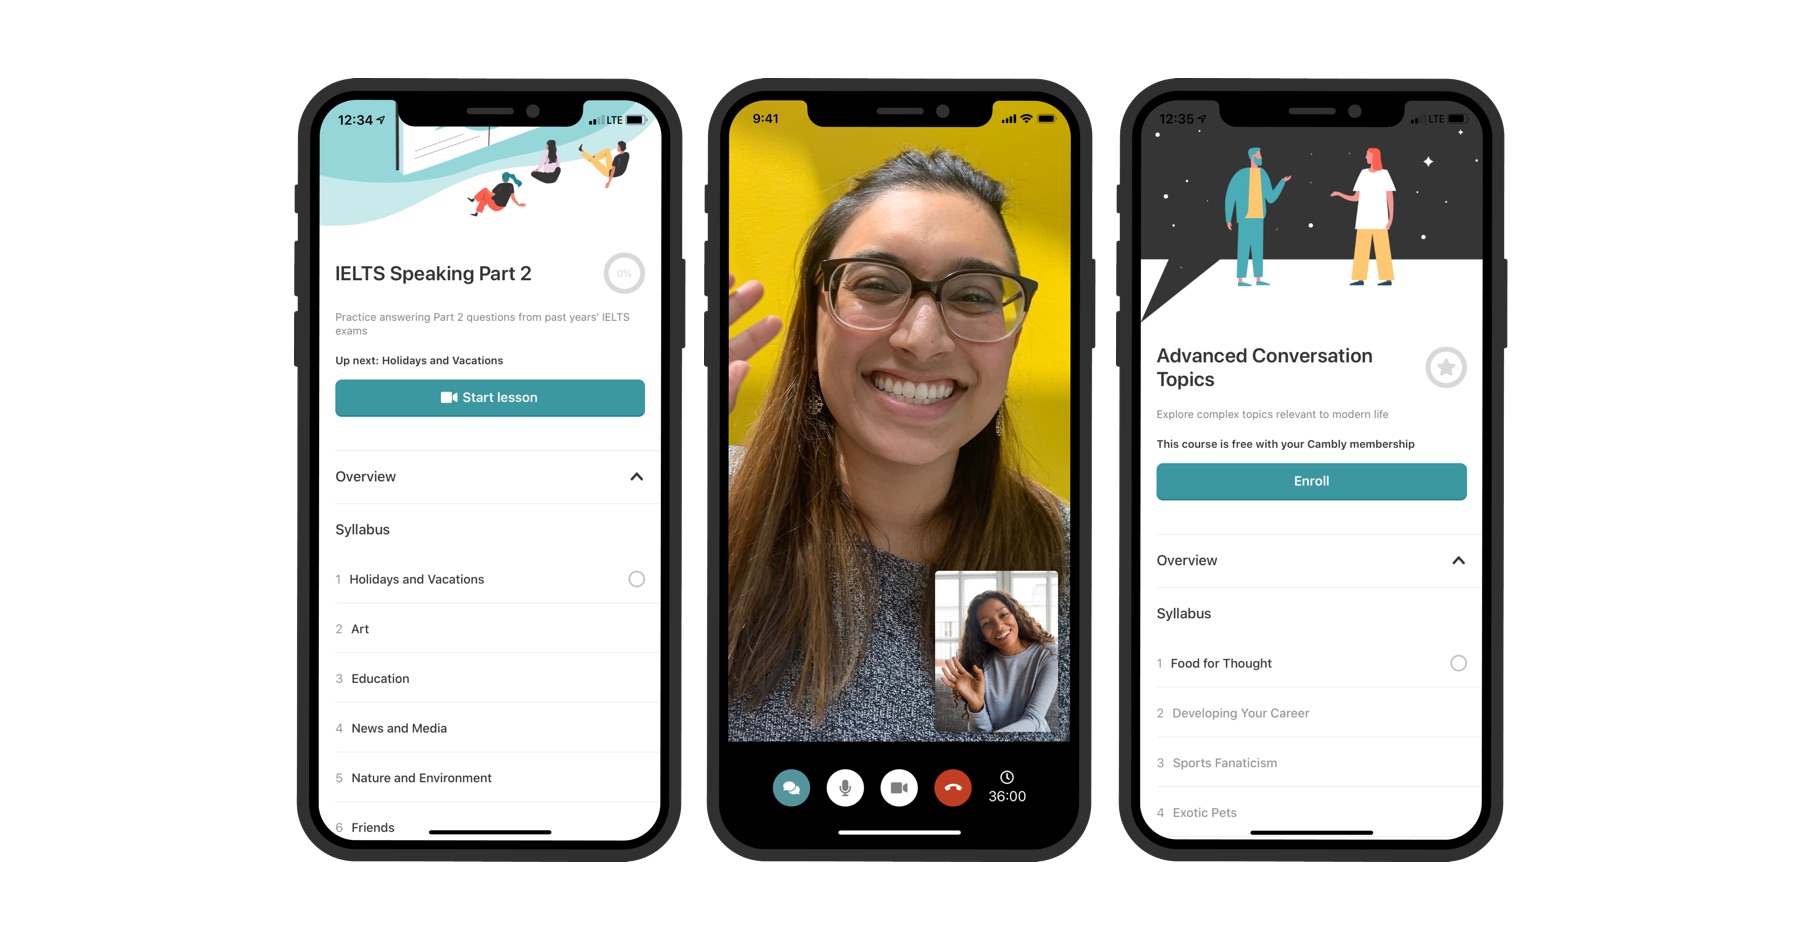
Naturally, Turkish-speaking pilots can fly domestic routes within Turkey with no problem. But to fly to international destinations like San Francisco or Beijing, pilots must be able to communicate with air traffic control in English. It’s hard to learn and practice those conversations in a typical English class. That’s where Cambly fills the gap with tutors who, like the retired pilots, can teach learners the terminology and phrases that require fluency.
Many industries require applicants to pass a standardized exam, such as the IELTS or TOEFL, to qualify for particular jobs. Similarly, academic institutions also require testing as part of their admissions process. Cambly provides tutors that specialize in helping learners prepare for these exams and take a critical next step in their career path.
Turning the tables: learning Spanish from an English tutor
The name “Cambly” is actually derived from the Spanish word “intercambio,” which means “exchange.” In the early days, Cambly supported both English and Spanish language learning. However, the numbers of English learners far surpassed Spanish learners. Also, the goals and level of commitment were very different between the two segments, particularly when it comes to the professional context. So, the founders eventually decided to optimize the platform for English only.
Undaunted, Spanish learners found a clever workaround on Cambly. One advantage of the platform’s diverse community of tutors is that many are multilingual. Learners can choose a tutor who also speaks their own native language, which can come in handy when they get stuck. But it also opens up a hidden opportunity for native English speakers.
Cambly’s Spanish-speaking tutors have reported that occasionally students come to them, not to learn English, but to practice Spanish. Tutors are surprised when one of these unusual students logs into a chat, but the unstructured nature of conversation practice makes it easy to shift gears. Spanish learners can enjoy an equally rich experience on Cambly, and also benefit from a tutor’s professional background in the same way.
In the era of working from home
When the COVID-19 pandemic emerged, people around the world were forced to stay at home indefinitely. For some, this meant more time to focus on self-improvement goals, such as language learning. Cambly saw a massive surge in traffic as lockdowns swept the world in the coming weeks. A wave of new learners joined Cambly and existing learners were logging in more often.
The pandemic also brought a spike in Cambly Kids, the company's language learning product for children. As families were under stay-at-home orders, parents looked for ways to supplement their children's online studies or fill their day with educational activities.
During this unprecedented global experience, the Cambly team has seen the beginning of a paradigm shift in language learning. As Kevin says, “I think people are still getting used to the idea of learning English online, but there’s so much value that technology brings. You can record sessions and go back and review them. We offer translation tools in the chat, so you can look up words in the moment. It’s forcing people to think about nontraditional ways to learn English and they want to try it out on Cambly.”
Read the Cambly case study to learn more about how Kevin and team built Cambly on Heroku.
The post How a Live Tutoring Platform Helps the Working World Get Ahead appeared first on Heroku.
]]>We recently received a support ticket from a customer inquiring about poor performance in two system calls (more commonly referred to as syscalls) their application was making frequently: clock_gettime(3) and gettimeofday(2) .
In this customer’s case, they were using a tool to do transaction tracing to monitor the performance of their application. This tool made many…
The post Making Time to Save You Time: How We Sped Up Time-Related Syscalls on Dynos appeared first on Heroku.
]]>We recently received a support ticket from a customer inquiring about poor performance in two system calls (more commonly referred to as syscalls) their application was making frequently: clock_gettime(3) and gettimeofday(2).
In this customer’s case, they were using a tool to do transaction tracing to monitor the performance of their application. This tool made many such system calls to measure how long different parts of their application took to execute. Unfortunately, these two system calls were very slow for them. Every request was impacted waiting for the time to return, slowing down the app for their users.
To help diagnose the problem we first examined our existing clocksource configuration. The clocksource determines how the Linux kernel gets the current time. The kernel attempts to choose the "best" clocksource from the sources available. In our case, the kernel was defaulting to the xen clocksource, which seems reasonable at a glance since the EC2 infrastructure that powers Heroku’s Common Runtime and Private Spaces products uses the Xen hypervisor under the hood.
Unfortunately, the version of Xen in use does not support a particular optimization—virtual dynamic shared object (or "vDSO")—for the two system calls in question. In short, vDSO allows certain operations to be performed entirely in userspace rather than having to context switch into kernelspace by mapping some kernel functionality into the current process. Context switching between userspace and kernelspace is a somewhat expensive operation—it takes a lot of CPU time. Most applications won’t see a large impact from occasional context switches, but when context switches are happening hundreds or thousands of times per web request, they can add up very quickly!
Thankfully, there are often several available clocksources to choose from. The available clocksources depends on a combination of the CPU, the Linux kernel version, and the hardware virtualization software being used. Our research revealed tsc seemed to be the most promising clocksource and would support vDSO. tsc utilizes the Time Stamp Counter to determine the System Time.
During our research, we also encountered a few other blog posts about TSC. Every source we referenced agreed that non-vDSO accelerated system calls were significantly slower, but there was some disagreement on how safe use of TSC would be. The Wikipedia article linked in the previous paragraph also lists some of these safety concerns. The two primary concerns centered around backwards clock drift that could occur due to: (1) TSC inconsistency that plagued older processors in hyper-threaded or multi-CPU configurations, and (2) when freezing/unfreezing Xen virtual machines. To the first concern, Heroku uses newer Intel CPUs for all dynos that have significantly safer TSC implementations. To the second concern, EC2 instances, which Heroku dynos use, do not utilize freezing/unfreezing today. We decided that tsc would be the best clocksource choice to support vDSO for these system calls without introducing negative side effects.
We were able to confirm using the tsc clocksource enabled vDSO acceleration with the excellent vdsotest tool (although you can verify your own results using strace). After our internal testing, we deployed the tsc clocksource configuration change to the Heroku Common Runtime and Private Spaces dyno fleet.
While the customer who filed the initial support ticket that led to this change noticed the improvement, the biggest surprise for us was when other customers started inquiring about unexpected performance improvements (which we knew to be a result of this change). It’s always nice for us when our work to solve a problem for a specific customer has a significant positive impact for all customers.
We're glad to be able to make changes like this that benefit all Heroku users. Detailed diagnostic and tuning work like this may not be worth the time investment for an individual engineering team managing their own infrastructure outside of Heroku. Heroku’s scale allows us to identify unique optimization opportunities and invest time into validating and implementing tweaks like this that make apps on Heroku run faster and more reliably.
The post Making Time to Save You Time: How We Sped Up Time-Related Syscalls on Dynos appeared first on Heroku.
]]> Dynos upgraded to the latest generation infrastructure for 10-15% perf improvement
More consistent performance for Small Private and Shield Space dynos
Optimized clock source selection
Heroku is a fully managed platform-as-a-service (PaaS) and we work tirelessly to continuously improve and enhance the experience of running apps on our platform. Unlike lower-level infrastructure-as-a-service systems, improvements are applied automatically to apps and databases and require no action or intervention from app developers to benefit.
That means that no action is required on your part…
The post Container and Runtime Performance Improvements appeared first on Heroku.
]]>- Dynos upgraded to the latest generation infrastructure for 10-15% perf improvement
- More consistent performance for Small Private and Shield Space dynos
- Optimized clock source selection
Heroku is a fully managed platform-as-a-service (PaaS) and we work tirelessly to continuously improve and enhance the experience of running apps on our platform. Unlike lower-level infrastructure-as-a-service systems, improvements are applied automatically to apps and databases and require no action or intervention from app developers to benefit.
That means that no action is required on your part to take advantage of the improved performance: Your app dynos have been switched out for upgraded and optimized ones by Heroku’s automated orchestration systems with no planning, maintenance or downtime for you or your apps.

New Infrastructure Generation
We have gradually upgraded the dyno-compute and networking that powers your apps to the latest generation available from our infrastructure provider. On average, CPU-bound apps should see at least a 10-15% performance improvement although details will vary with workload. Networking and other I/O is also greatly improved.
Consistent Performance for Small Private Space Dynos
The infrastructure powering private-s and shield-s dynos in Private and Shield Private Spaces has been upgraded to have more consistent performance. To give customers the best balance of cost and performance these dyno types previously ran on burstable infrastructure that throttled under heavy load. This behavior was not intuitive and we’re happy to report that now even small dynos in Private Spaces run all-out 100% of the time.
Clocksource Now tsc and kvm-clock
“What time is it?” is something a computer program asks the operating system surprisingly often. Time and date is required to timestamp log lines, trace code performance or to fill in the CREATED_AT column for a database record. And for the operating system, VM and hardware it’s actually not that simple to provide an exact answer quickly. Most systems have several components (“clocksources”) that the operating system can use to help keep track of time and they come with different tradeoffs in terms of accuracy and performance.
Based on user-feedback and after careful testing and validation Heroku recently optimized clocksource selection on our infrastructure to use tsc and kvm-clock. Some customers that made heavy use of the system clock for request performance timing saw latency reductions of up to 50% after the change was introduced (apps that make less aggressive use of the system clock should not expect similar gains). Read Will Farrington’s post on the Engineering Blog for details on how we identified and implemented the clocksource enhancement for details.
Summary
The three performance improvements detailed in this blog post are great examples of the benefits of relying on a managed PaaS like Heroku rather than running apps directly on un-managed infrastructure that has to be laboriously maintained and updated. Because we operate at vast scale we can invest in validating infrastructure upgrades and in systems and processes that perform those upgrades seamlessly and with no downtime to the millions of apps running on Heroku.
The post Container and Runtime Performance Improvements appeared first on Heroku.
]]>…
The post Introducing the Streaming Data Connectors Beta: Capture Heroku Postgres Changes in Apache Kafka on Heroku appeared first on Heroku.
]]>
Moving beyond Postgres and Kafka, the Heroku Data team sees the use cases for data growing more complex and diverse, and we know they can no longer be solved by one database technology alone. As new data services emerge and existing offerings become more sophisticated, the days of a single monolithic datastore are over. Apache Kafka is a key enabling technology for these emerging data architectures.
We spent the last year focused on embracing this new reality outside of our four walls. We shipped new features that allow Heroku Managed Data Services to integrate with external resources in Amazon VPCs over Private Link and resources in other public clouds or private data centers over mutual TLS. But we had a problem inside that we wanted to solve too.
Effortless Change Data Capture (CDC) by Heroku
CDC isn’t a new idea. It involves monitoring one or more Postgres tables for writes, updates, and deletes, and then writing each change to an Apache Kafka topic. Sounds simple enough, but the underlying complexity is significant. We took the time to experiment with the open-source technologies that made it possible and were thrilled to find a path forward that provides a stable service at scale.
We use Kafka Connect and Debezium to take data at rest and put it in motion. Like Heroku Postgres and Apache Kafka on Heroku, the connector is fully-managed, has a simple and powerful user experience, and comes with our operational excellence built-in every aspect of the service.
It’s as Easy as heroku data:connectors:create
To get started, make sure you have Heroku Postgres and Apache Kafka on Heroku add-ons in a Private or Shield Space, as well as the CLI plugin. Then create a connector by identifying the Postgres source and Apache Kafka store by name, specifying which table(s) to include, and optionally blocking which columns to exclude:
heroku data:connectors:create
    --source postgresql-neato-98765
    --store kafka-lovely-12345
    --table public.posts --table public.users
    --exclude public.users.password
See the full instructions and best practices for more detail.
Once provisioned, which takes about 15 minutes, the connector automatically streams changes from Heroku Postgres to Apache Kafka on Heroku. From there, you can refactor your monolith into microservices, implement an event-based architecture, integrate with other downstream data services, build a data lake, archive data in lower-cost storage services, and so much more.
Feedback Welcome
We are thrilled to share our latest work with you and eager to get your feedback. Please send any questions, comments, or feature requests our way.
The post Introducing the Streaming Data Connectors Beta: Capture Heroku Postgres Changes in Apache Kafka on Heroku appeared first on Heroku.
]]>If you provide an API client that doesn't include rate limiting, you don't really have an API client. You've got an exception generator with a remote timer.
— Richard Schneeman Stay Inside (@schneems) June 12, 2019
That tweet spawned a discussion that generated a quest to add rate throttling logic to the platform-api gem that Heroku maintains for talking to its API in Ruby.
If the term "rate throttling" is new to you, read…
The post A Fast Car Needs Good Brakes: How We Added Client Rate Throttling to the Platform API Gem appeared first on Heroku.
]]>If you provide an API client that doesn't include rate limiting, you don't really have an API client. You've got an exception generator with a remote timer.
— Richard Schneeman Stay Inside (@schneems) June 12, 2019
That tweet spawned a discussion that generated a quest to add rate throttling logic to the platform-api gem that Heroku maintains for talking to its API in Ruby.
If the term "rate throttling" is new to you, read Rate limiting, rate throttling, and how they work together
The Heroku API uses Genetic Cell Rate Algorithm (GCRA) as described by Brandur in this post on the server-side. Heroku's API docs state:
The API limits the number of requests each user can make per hour to protect against abuse and buggy code. Each account has a pool of request tokens that can hold at most 4500 tokens. Each API call removes one token from the pool. Tokens are added to the account pool at a rate of roughly 75 per minute (or 4500 per hour), up to a maximum of 4500. If no tokens remain, further calls will return 429 Too Many Requests until more tokens become available.
I needed to write an algorithm that never errored as a result of a 429 response. A "simple" solution would be to add a retry to all requests when they see a 429, but that would effectively DDoS the API. I made it a goal for the rate throttling client also to minimize its retry rate. That is, if the client makes 100 requests, and 10 of them are a 429 response that its retry rate is 10%. Since the code needed to be contained entirely in the client library, it needed to be able to function without distributed coordination between multiple clients on multiple machines except for whatever information the Heroku API returned.
Making client throttling maintainable
Before we can get into what logic goes into a quality rate throttling algorithm, I want to talk about the process that I used as I think the journey is just as fascinating as the destination.
I initially started wanting to write tests for my rate throttling strategy. I quickly realized that while testing the behavior "retries a request after a 429 response," it is easy to check. I also found that checking for quality "this rate throttle strategy is better than others" could not be checked quite as easily. The solution that I came up with was to write a simulator in addition to tests. I would simulate the server's behavior, and then boot up several processes and threads and hit the simulated server with requests to observe the system's behavior.
I initially just output values to the CLI as the simulation ran, but found it challenging to make sense of them all, so I added charting. I found my simulation took too long to run and so I added a mechanism to speed up the simulated time. I used those two outputs to write what I thought was a pretty good rate throttling algorithm. The next task was wiring it up to the platform-api gem.
To help out I paired with a Heroku Engineer, Lola, we ended up making several PRs to a bunch of related projects, and that's its own story to tell. Finally, the day came where we were ready to get rate throttling into the platform-api gem; all we needed was a review.
Unfortunately, the algorithm I developed from "watching some charts for a few hours" didn't make a whole lot of sense, and it was painfully apparent that it wasn't maintainable. While I had developed a good gut feel for what a "good" algorithm did and how it behaved, I had no way of solidifying that knowledge into something that others could run with. Imagine someone in the future wants to make a change to the algorithm, and I'm no longer here. The tests I had could prevent them from breaking some expectations, but there was nothing to help them make a better algorithm.
The making of an algorithm
At this point, I could explain the approach I had taken to build an algorithm, but I had no way to quantify the "goodness" of my algorithm. That's when I decided to throw it all away and start from first principles. Instead of asking "what would make my algorithm better," I asked, "how would I know a change to my algorithm is better" and then worked to develop some ways to quantify what "better" meant. Here are the goals I ended up coming up with:
- Minimize average retry rate: The fewer failed API requests, the better
- Minimize maximum sleep time: Rate throttling involves waiting, and no one wants to wait for too long
- Minimize variance of request count between clients: No one likes working with a greedy co-worker, API clients are no different. No client in the distributed system should be an extended outlier
- Minimize time to clear a large request capacity: As the system changes, clients should respond quickly to changes.
I figured that if I could generate metrics on my rate-throttle algorithm and compare it to simpler algorithms, then I could show why individual decisions were made.
I moved my hacky scripts for my simulation into a separate repo and, rather than relying on watching charts and logs, moved to have my simulation produce numbers that could be used to quantify and compare algorithms.
With that work under my belt, I threw away everything I knew about rate-throttling and decided to use science and measurement to guide my way.
Writing a better rate-throttling algorithm with science: exponential backoff
Earlier I mentioned that a "simple" algorithm would be to retry requests. A step up in complexity and functionality would be to retry requests after an exponential backoff. I coded it up and got some numbers for a simulated 30-minute run (which takes 3 minutes of real-time):
Avg retry rate:      60.08 %
Max sleep time:      854.89 seconds
Stdev Request Count: 387.82
Time to clear workload (4500 requests, starting_sleep: 1s):
74.23 seconds
Now that we've got baseline numbers, how could we work to minimize any of these values? In my initial exponential backoff model, I multiplied sleep by a factor of 2.0, what would happen if I increased it to 3.0 or decreased it to 1.2?
To find out, I plugged in those values and re-ran my simulations. I found that there was a correlation between retry rate and max sleep value with the backoff factor, but they were inverse. I could lower the retry rate by increasing the factor (to 3.0), but this increased my maximum sleep time. I could reduce the maximum sleep time by decreasing the factor (to 1.2), but it increased my retry rate.
That experiment told me that if I wanted to optimize both retry rate and sleep time, I could not do it via only changing the exponential factor since an improvement in one meant a degradation in the other value.
At this point, we could theoretically do anything, but our metrics judge our success. We could put a cap on the maximum sleep time, for example, we could write code that says "don't sleep longer than 300 seconds", but it too would hurt the retry rate. The biggest concern for me in this example is the maximum sleep time, 854 seconds is over 14 minutes which is WAAAYY too long for a single client to be sleeping.
I ended up picking the 1.2 factor to decrease that value at the cost of a worse retry-rate:
Avg retry rate:      80.41 %
Max sleep time:      46.72 seconds
Stdev Request Count: 147.84
Time to clear workload (4500 requests, starting_sleep: 1s):
74.33 seconds
Forty-six seconds is better than 14 minutes of sleep by a long shot. How could we get the retry rate down?
Incremental improvement: exponential sleep with a gradual decrease
In the exponential backoff model, it backs-off once it sees a 429, but as soon as it hits a success response, it doesn't sleep at all. One way to reduce the retry-rate would be to assume that once a request had been rate-throttled, that future requests would need to wait as well. Essentially we would make the sleep value "sticky" and sleep before all requests. If we only remembered the sleep value, our rate throttle strategy wouldn't be responsive to any changes in the system, and it would have a poor "time to clear workload." Instead of only remembering the sleep value, we can gradually reduce it after every successful request. This logic is very similar to TCP slow start.
How does it play out in the numbers?
Avg retry rate:      40.56 %
Max sleep time:      139.91 seconds
Stdev Request Count: 867.73
Time to clear workload (4500 requests, starting_sleep: 1s):
115.54 seconds
Retry rate did go down by about half. Sleep time went up, but it's still well under the 14-minute mark we saw earlier. But there's a problem with a metric I've not talked about before, the "stdev request count." It's easier to understand if you look at a chart to see what's going on:

Here you can see one client is sleeping a lot (the red client) while other clients are not sleeping at all and chewing through all the available requests at the bottom. Not all the clients are behaving equitably. This behavior makes it harder to tune the system.
One reason for this inequity is that all clients are decreasing by the same constant value for every successful request. For example, let's say we have a client A that is sleeping for 44 seconds, and client B that is sleeping for 11 seconds and both decrease their sleep value by 1 second after every request. If both clients ran for 45 seconds, it would look like this:
Client A) Sleep 44 (Decrease value: 1)
Client B) Sleep 11 (Decrease value: 1)
Client B) Sleep 10 (Decrease value: 1)
Client B) Sleep  9 (Decrease value: 1)
Client B) Sleep  8 (Decrease value: 1)
Client B) Sleep  7 (Decrease value: 1)
Client A) Sleep 43 (Decrease value: 1)
So while client A has decreased by 1 second total, client B has reduced by 4 seconds total, since it is firing 4x as fast (i.e., it's sleep time is 4x lower). So while the decrease rate is equal, it is not equitable. Ideally, we would want all clients to decrease at the same rate.
All clients created equal: exponential increase proportional decrease
Since clients cannot communicate with each other in our distributed system, one way to guaranteed proportional decreases is to use the sleep value in the decrease amount:
decrease_value = (sleep_time) / some_value
Where some_value is a magic number. In this scenario the same clients A and B running for 45 seconds would look like this with a value of 100:
Client A) Sleep 44
Client B) Sleep 11
Client B) Sleep 10.89 (Decrease value: 11.00/100 = 0.1100)
Client B) Sleep 10.78 (Decrease value: 10.89/100 = 0.1089)
Client B) Sleep 10.67 (Decrease value: 10.78/100 = 0.1078)
Client B) Sleep 10.56 (Decrease value: 10.67/100 = 0.1067)
Client A) Sleep 43.56 (Decrease value: 44.00/100 = 0.4400)
Now client A has had a decrease of 0.44, and client B has had a reduction of 0.4334 (11 seconds – 10.56 seconds), which is a lot more equitable than before. Since some_value is tunable, I wanted to use a larger number so that the retry rate would be lower than 40%. I chose 4500 since that's the maximum number of requests in the GCRA bucket for Heroku's API.
Here's what the results looked like:
Avg retry rate:      3.66 %
Max sleep time:      17.31 seconds
Stdev Request Count: 101.94
Time to clear workload (4500 requests, starting_sleep: 1s):
551.10 seconds
The retry rate went WAAAY down, which makes sense since we're decreasing slower than before (the constant decrease value previously was 0.8). Stdev went way down as well. It's about 8x lower. Surprisingly the max sleep time went down as well. I believe this to be a factor of a decrease in the number of required exponential backoff events. Here's what this algorithm looks like:

The only problem here is that the "time to clear workload" is 5x higher than before. What exactly is being measured here? In this scenario, we're simulating a cyclical workflow where clients are running under high load, then go through a light load, and then back to a high load. The simulation starts all clients with a sleep value, but the server's rate-limit is reset to 4500. The time is how long it takes the client to clear all 4500 requests.
What this metric of 551 seconds is telling me is that this strategy is not very responsive to a change in the system. To illustrate this problem, I ran the same algorithm starting each client at 8 seconds of sleep instead of 1 second to see how long it would take to trigger a rate limit:

The graph shows that it takes about 7 hours to clear all these requests, which is not good. What we need is a way to clear requests faster when there are more requests.
The only remaining option: exponential increase proportional remaining decrease
When you make a request to the Heroku API, it tells you how many requests you have left remaining in your bucket in a header. Our problem with the "proportional decrease" is mostly that when there are lots of requests remaining in the bucket, it takes a long time to clear them (if the prior sleep rate was high, such as in a varying workload). To account for this, we can decrease the sleep value quicker when the remaining bucket is full and slower when the remaining bucket is almost empty. To express that in an expression, it might look like this:
decrease_value = (sleep_time * request_count_remaining) / some_value
In my case, I chose some_value to be the maximum number of requests possible in a bucket, which is 4500. You can imagine a scenario where workers were very busy for a period and being rate limited. Then no jobs came in for over an hour – perhaps the workday was over, and the number of requests remaining in the bucket re-filled to 4500. On the next request, this algorithm would reduce the sleep value by itself since 4500/4500 is one:
decrease_value = sleep_time * 4500 / 4500
That means it doesn't matter how immense the sleep value is, it will adjust fairly quickly to a change in workload. Good in theory, how does it perform in the simulation?
Avg retry rate:      3.07 %
Max sleep time:      17.32 seconds
Stdev Request Count: 78.44
Time to clear workload (4500 requests, starting_sleep: 1s):
84.23 seconds
This rate throttle strategy performs very well on all metrics. It is the best (or very close) to several metrics. Here's a chart:

This strategy is the "winner" of my experiments and the algorithm that I chose to go into the platform-api gem.
My original solution
While I originally built this whole elaborate scheme to prove how my solution was optimal, I did something by accident. By following a scientific and measurement-based approach, I accidentally found a simpler solution that performed better than my original answer. Which I'm happier about, it shows that the extra effort was worth it. To "prove" what I found by observation and tinkering could be not only quantified by numbers but improved upon is fantastic.
While my original solution had some scripts and charts, this new solution has tests covering the behavior of the simulation and charting code. My initial solution was very brittle. I didn't feel very comfortable coming back and making changes to it; this new solution and the accompanying support code is a joy to work with. My favorite part though is that now if anyone asks me, "what about trying
gem 'platform-api', '~> 3.0'
While I mostly wanted to talk about the process of writing rate-throttling code, this whole thing started from a desire to get client rate-throttling into the platform-api gem. Once I did the work to prove my solution was reasonable, we worked on a rollout strategy. We released a version of the gem in a minor bump with rate-throttling available, but with a "null" strategy that would preserve existing behavior. This release strategy allowed us to issue a warning to anyone depending on the original behavior. Then we released a major version with the rate-throttling strategy enabled by default. We did this first with "pre" release versions and then actual versions to be extra safe.
So far, the feedback has been overwhelming that no one has noticed. We didn't cause any significant breaks or introduce any severe disfunction to any applications. If you've not already, I invite you to upgrade to 3.0.0+ of the platform-api gem and give it a spin. I would love to hear your feedback.
Get ahold of Richard and stay up-to-date with Ruby, Rails, and other programming related content through a subscription to his mailing list.
The post A Fast Car Needs Good Brakes: How We Added Client Rate Throttling to the Platform API Gem appeared first on Heroku.
]]>We will be keeping this post updated and would love to include your voice. Please send us any thoughts that you’d like to share at: feedback@heroku.com .
“Many, if not all, of us…
The post Black Lives Matter: Our Thoughts, Actions, and Resources appeared first on Heroku.
]]>We will be keeping this post updated and would love to include your voice. Please send us any thoughts that you’d like to share at: feedback@heroku.com.
“Many, if not all, of us are watching the civil rights movement taking place around the world. We are hurting, we are angry, and many of us are asking, “How can I support? What can I do?” We all have an opportunity to take a hard look at ourselves and to educate ourselves of the reality that has existed for over 400 years for Black people in the United States. If we’re interested in becoming allies, we need to do the work first.
An intersectional group of Diversity Equity and Inclusion practitioners created this course because they wanted to alleviate the burden Black communities face fielding questions from allies on what they can do. To be true allies, we need to be anti-racist, and to do so we need to develop a deep understanding of systematic racism and white supremacy. This intersectional group has seen many non-Black people struggling to know where to start, so they hope this 20-day, bite-sized text message course can provide everyone with some knowledge on the history of racism, the oppressive systems that continue to exist today, and how to show up.
I’ve just signed up for the course, which is geared toward non-Black people to educate ourselves on how we can:
- Understand systematic racism and anti-blackness, white supremacy, and racial economics; and recognize that race is in every aspect of America.
- Check our own privilege and show up for the Black community every day.
- Keep educating ourselves.
These are short, bite-sized pieces of information with resources to get you started, as well as links to Black leaders and voices. Each of the topics will require further reading and exploration on your own.
The course is called Practicing Anti-Racism 101. It costs $6, all of which is donated to nonprofit organizations doing important work in the area.
We can all do something and we should start with educating ourselves. We can all do better and I think it will begin with understanding the role non-Black people like myself have played in the marginalization of Black people.”
— Caleb Hearth, Heroku Tier 3 Data Support
“I’m keenly aware of my privilege as a white man in tech. I regret not being able to be out protesting, however, I am checking on my Black peers (and former peers) and asking them what I can do to help. It’s so important to recognize that there are many different ways that we can support the movement in this time of change.”
— Evan Light, Sr Manager, Heroku Web Services
“I decided it was time to speak up… I created What CAN YOU do? — a list for corporations and individuals that goes beyond that which is less controllable into impactful and empowering alliance. I hope this is meaningful and mobilizes change in some way.”
— Kimberly Lowe-Williams, Sr. Manager, Heroku and Nonprofit Leader
“For me personally, I’m trying to learn as much as I can. Currently reading Why I’m No Longer Talking To White People About Race.”
— Charlie Gleason, User Interface / User Experience Lead, Heroku
“A small thing, but we’ve been listening to this on loop: https://twitter.com/GeeDee215/status/1268930514976636930
because provenance is important on the internet:
- This is the original video
- Which was remixed by @alexengelberg on TikTok
I am definitively not your tourguide for the wider TikTok community, but from what I can see, https://www.tiktok.com/@rynnstar’s content is stellar. If you want a Black content creator to follow, kindly follow her.”
— Tom Reznick, Engineer, Heroku Data
“It’s hard to put all my thoughts and feelings into words and I expect I will fail here. My heart is heavy and I am doing my best to support and continue to learn during this period. I am drawing huge inspiration from others who are reacting with such thoughtfulness, grace, and humility. People coming together in beautiful ways gives me hope.”
— Jennifer Hooper, Sr. Director, Technical Product Marketing, Content, and Brand
“With the murder of George Floyd, I took the opportunity to stay quiet. I listened and tried to learn; I absorbed and tried to think. I believe that with education comes empathy and understanding, and so I’ve tried to modify my social feeds so that I can continuously learn. By following groups championing diversity, equality, and social justice, I hope to gain understanding which feeds into direct action. I intrinsically understand that behaviour must change, and I must first change my own behaviour to ensure I can help others. Thanks to Salesforce’s employee resource group BOLDforce for this strong list of organisations to follow, I am on a path to discovery. The more I know, the more effective I can be.
Organizations I am following on social media:
- Antiracism Center: Twitter
- Audre Lorde Project: Twitter | Instagram | Facebook
- Black Women’s Blueprint: Twitter | Instagram | Facebook
- Color Of Change: Twitter | Instagram | Facebook
- Colorlines: Twitter | Instagram | Facebook
- The Conscious Kid: Twitter | Instagram | Facebook
- Equal Justice Initiative (EJI): Twitter | Instagram | Facebook
- Families Belong Together: Twitter | Instagram | Facebook
- Justice League NYC: Twitter | Instagram + Gathering For Justice: Twitter | Instagram
- The Leadership Conference on Civil & Human Rights: Twitter | Instagram | Facebook
- The Movement For Black Lives (M4BL): Twitter | Instagram | Facebook
- MPowerChange: Twitter | Instagram | Facebook
- Muslim Girl: Twitter | Instagram | Facebook
- NAACP: Twitter | Instagram | Facebook
- National Domestic Workers Alliance: Twitter | Instagram | Facebook
- RAICES: Twitter | Instagram | Facebook
- Showing Up for Racial Justice (SURJ): Twitter | Instagram | Facebook
- SisterSong: Twitter | Instagram | Facebook
- United We Dream: Twitter | Instagram | Facebook”
— Christie Fidura, Director, EMEA Developer Marketing, Salesforce
“I have always been quiet to speak out about different causes on social media because I was afraid to say the wrong thing or offend someone. I have realized that I am hurting people by staying quiet and have decided to use my voice and my white privilege to help. I have been learning, listening, and using my voice to have difficult conversations with friends, family, acquaintances, and I will no longer stay quiet. I know there’s more work to be done so that every single human is treated equally, that is why I say Black Lives Matter. I encourage people to do their own research and find different ways that they can support the movement for equality for Black lives. Right now, I have been donating money to a few different organizations. If you would like to join me, below is just a short list of where you can send your support.
- I Fund Women
- Campaign Zero
- Your local bail fund to support protesters, and so many more.
An additional inspiration is seeing the things that others at our company are doing, such as the Outforce group on Black Life Matters.
I used to listen, silent, when abuse happened out of my reach. Ashamed of a race and gender that abuse their privilege. Unable to contribute with anything not obvious, politically correct. As if what others may think about me mattered more than what was at stake  I’m thankful that someone took the time to educate me and others by sharing a link to “Nothing to add: A challenge to white silence in cross-racial discussions,” an article that refuted any reasons I could come up with to remain silent.”
— Raul Murciano, Software Engineering Manager, Heroku / Salesforce
“After reflecting on the most recent murders of Black American citizens by police officers and by white “vigilantes,” I honestly don’t know what to say. I am angry, I am heartbroken, and I am exhausted. And I’ve only been reflecting on this for a few weeks. I cannot imagine what it must be like to go through life having to constantly carry this terrible burden.
I am sorry it’s taken me so long to finally acknowledge and accept that we have so many serious problems with systematic racism and racial inequality in our country, and that we must start repairing that damage now. (How to Be an Antiracist by Ibram X. Kendi has helped me considerably already by providing context, ideas on how to be part of the solution, and hope.) I promise I will do better this time by educating myself further, donating to charities that support racial equality and pride, and by doing what I can to help make my community a more just and better place.”
— David Routen, Software Engineer, Heroku / Salesforce
“I am struggling to articulate my immense horror and heartache of the recent murders and the centuries of systemic brutality and oppression of African Americans. How can I ‘be the change I want to see in the world?’ I can commit to trying harder to live every day with conscious empathy and awareness. I can actively look for ways that I can learn and contribute to helping this country become a place of safety and equality. I can also help to keep the conversation going so that this moment — finally, finally, finally — becomes a catalyst that brings true, lasting social justice.”
— Sally Vedros, Marketing Writer, Heroku / Salesforce

See how Salesforce is taking action for racial equality and justice
The post Black Lives Matter: Our Thoughts, Actions, and Resources appeared first on Heroku.
]]>In a traditional REST-based API approach, the client makes a request, and the server dictates the response:
$ curl https://api.heroku.space/users/1
{
"id": 1,
"name": "Luke",
"email": "luke@heroku.space",
"addresses": [
{
"street": "1234 Rodeo Drive",
"city": "Los Angeles",
"country": "USA"
}
]
}
But, in GraphQL, the client determines precisely the data it wants…
The post Building a GraphQL API in JavaScript appeared first on Heroku.
]]>In a traditional REST-based API approach, the client makes a request, and the server dictates the response:
$ curl https://api.heroku.space/users/1
{
"id": 1,
"name": "Luke",
"email": "luke@heroku.space",
"addresses": [
{
"street": "1234 Rodeo Drive",
"city": "Los Angeles",
"country": "USA"
}
]
}
But, in GraphQL, the client determines precisely the data it wants from the server. For example, the client may want only the user’s name and email, and none of the address information:
$ curl -X POST https://api.heroku.space/graphql -d '
query {
user(id: 1) {
name
email
}
}
'
{
"data":
{
"name": "Luke",
"email": "luke@heroku.space"
}
}
With this new paradigm, clients can make more efficient queries to a server by trimming down the response to meet their needs. For single-page apps (SPAs) or other front-end heavy client-side applications, this speeds up rendering time by reducing the payload size. However, as with any framework or language, GraphQL has its trade-offs. In this post, we’ll take a look at some of the pros and cons of using GraphQL as a query language for APIs, as well as how to get started building an implementation.
Why would you choose GraphQL?
As with any technical decision, it’s important to understand what advantages GraphQL offers to your project, rather than simply choosing it because it’s a buzzword.
Consider a SaaS application that uses an API to connect to a remote database; you’d like to render a user’s profile page. You might need to make one API GET call to fetch information about the user, like their name or email. You might then need to make another API call to fetch information about the address, which is stored in a different table. As the application evolves, because of the way it’s architected, you might need to continue to make more API calls to different locations. While each of these API calls can be done asynchronously, you must also handle their responses, whether there’s an error, a network timeout, or even pausing the page render until all the data is received. As noted above, the payloads from these responses might be more than necessary to render your current pages. And each API call has network latency and the total latencies added up can be substantial.
With GraphQL, instead of making several API calls, like GET /user/:id and GET /user/:id/addresses, you make one API call and submit your query to a single endpoint:
query {
user(id: 1) {
name
email
addresses {
street
city
country
}
}
}
GraphQL, then, gives you just one endpoint to query for all the domain logic that you need. If your application grows, and you find yourself adding more data stores to your architecture — PostgreSQL might be a good place to store user information, while Redis might be good for other kinds—a single call to a GraphQL endpoint will resolve all of these disparate locations and respond to a client with the data they requested.
If you’re unsure of the needs of your application and how data will be stored in the future, GraphQL can prove useful here, too. To modify a query, you’d only need to add the name of the field you want:
addresses {
street
+ apartmentNumber # new information
city
country
}
This vastly simplifies the process of evolving your application over time.
Defining a GraphQL schema
There are GraphQL server implementations in a variety of programming languages, but before you get started, you’ll need to identify the objects in your business domain, as with any API. Just as a REST API might use something like JSON schema, GraphQL defines its schema using SDL, or Schema Definition Language, an idempotent way to describe all the objects and fields available by your GraphQL API. The general format for an SDL entry looks like this:
type $OBJECT_TYPE {
$FIELD_NAME($ARGUMENTS): $FIELD_TYPE
}
Let’s build on our earlier example by defining what entries for the user and address might look like:
type User {
name: String
email: String
addresses: [Address]
}
type Address {
street: String
city: String
country: String
}
User defines two String fields called name and email. It also includes a field called addresses, which is an array of Address objects. Address also defines a few fields of its own. (By the way, there’s more to a GraphQL schema than just objects, fields, and scalar types. You can also incorporate interfaces, unions, and arguments, to build more complex models, but we won’t cover those for this post.)
There’s one more type we need to define, which is the entry point to our GraphQL API. You’ll remember that earlier, we said a GraphQL query looked like this:
query {
user(id: 1) {
name
email
}
}
That query field belongs to a special reserved type called Query. This specifies the main entry point to fetching objects. (There’s also a Mutation type for modifying objects.) Here, we define a user field, which returns a User object, so our schema needs to define this too:
type Query {
user(id: Int!): User
}
type User { ... }
type Address { ... }
Arguments on a field are a comma-separated list, which takes the form of $NAME: $TYPE. The ! is GraphQL’s way of denoting that the argument is required—omitting means it’s optional.
Depending on your language of choice, the process of incorporating this schema into your server varies, but in general, consuming this information as a string is enough. Node.js has the graphql package to prepare a GraphQL schema, but we’re going to use the graphql-tools package instead, because it provides a few more niceties. Let’s import the package and read our type definitions in preparation for future development:
const fs = require('fs')
const { makeExecutableSchema } = require("graphql-tools");
let typeDefs = fs.readFileSync("schema.graphql", {
encoding: "utf8",
flag: "r",
});
Setting up resolvers
A schema sets up the ways in which queries can be constructed but establishing a schema to define your data model is just one part of the GraphQL specification. The other portion deals with actually fetching the data. This is done through the use of resolvers. A resolver is a function that returns a field’s underlying value.
Let’s take a look at how you might implement resolvers in Node.js. The intent is to solidify concepts around how resolvers operate in conjunction with schemas, so we won’t go into too much detail around how the data stores are set up. In the “real world”, we might establish a database connection with something like knex. For now, let’s just set up some dummy data:
const users = {
1: {
name: "Luke",
email: "luke@heroku.space",
addresses: [
{
street: "1234 Rodeo Drive",
city: "Los Angeles",
country: "USA",
},
],
},
2: {
name: "Jane",
email: "jane@heroku.space",
addresses: [
{
street: "1234 Lincoln Place",
city: "Brooklyn",
country: "USA",
},
],
},
};
GraphQL resolvers in Node.js amount to an Object with the key as the name of the field to be retrieved, and the value being a function that returns the data. Let’s start with a barebones example of the initial user lookup by id:
const resolvers = {
Query: {
user: function (parent, { id }) {
// user lookup logic
},
},
}
This resolver takes two arguments: an object representing the parent (which in the initial root query is often unused), and a JSON object containing the arguments passed to your field. Not every field will have arguments, but in this case, we will, because we need to retrieve our user by their ID. The rest of the function is straightforward:
const resolvers = {
Query: {
user: function (_, { id }) {
return users[id];
},
}
}
You’ll notice that we didn’t explicitly define a resolver for User or Addresses. The graphql-tools package is intelligent enough to automatically map these for us. We can override these if we choose, but with our type definitions and resolvers now defined, we can build our complete schema:
const schema = makeExecutableSchema({ typeDefs, resolvers });
Running the server
Finally, let’s get this demo running! Since we’re using Express, we can use the express-graphql package to expose our schema as an endpoint. The package requires two arguments: your schema, and your root value. It takes one optional argument, graphiql, which we’ll talk about in a bit.
Set up your Express server on your favorite port with the GraphQL middleware like this:
const express = require("express");
const express_graphql = require("express-graphql");
const app = express();
app.use(
"/graphql",
express_graphql({
schema: schema,
graphiql: true,
})
);
app.listen(5000, () => console.log("Express is now live at localhost:5000"));
Navigate your browser to https://localhost:5000/graphql, and you should see a sort of IDE interface. On the left pane, you can enter any valid GraphQL query you like, and on your right you’ll get the results. This is what graphiql: true provides: a convenient way of testing out your queries. You probably wouldn’t want to expose this in a production environment, but it makes testing much easier.
Try entering the query we demonstrated above:
query {
user(id: 1) {
name
email
}
}
To explore GraphQL’s typing capabilities, try passing in a string instead of an integer for the ID argument:
# this doesn't work
query {
user(id: "1") {
name
email
}
}
You can even try requesting fields that don’t exist:
# this doesn't work
query {
user(id: 1) {
name
zodiac
}
}
With just a few clear lines of code expressed by the schema, a strongly-typed contract between the client and server is established. This protects your services from receiving bogus data and expresses errors clearly to the requester.
Performance considerations
For as much as GraphQL takes care of for you, it doesn’t solve every problem inherent in building APIs. In particular, caching and authorization are just two areas that require some forethought to prevent performance issues. The GraphQL spec does not provide any guidance for implementing either of these, which means that the responsibility for building them falls onto you.
Caching
REST-based APIs don’t need to be overly concerned when it comes to caching, because they can build on existing HTTP header strategies that the rest of the web uses. GraphQL doesn’t come with these caching mechanisms, which can place undue processing burden on your servers for repeated requests. Consider the following two queries:
query {
user(id: 1) {
name
}
}
query {
user(id: 1) {
email
}
}
Without some sort of caching in place, this would result in two database queries to fetch the User with an ID of 1, just to retrieve two different columns. In fact, since GraphQL also allows for aliases, the following query is valid and also performs two lookups:
query {
one: user(id: 1) {
name
}
two: user(id: 2) {
name
}
}
This second example exposes the problem of how to batch queries. In order to be fast and efficient, we want GraphQL to access the same database rows with as few roundtrips as possible.
The dataloader package was designed to handle both of these issues. Given an array of IDs, we will fetch all of those at once from the database; as well, subsequent calls to the same ID will fetch the item from the cache. To build this out using dataloader, we need two things. First, we need a function to load all of the requested objects. In our sample, that looks something like this:
const DataLoader = require('dataloader');
const batchGetUserById = async (ids) => {
// in real life, this would be a DB call
return ids.map(id => users[id]);
};
// userLoader is now our "batch loading function"
const userLoader = new DataLoader(batchGetUserById);
This takes care of the issue with batching. To load the data, and work with the cache, we’ll replace our previous data lookup with a call to the load method and pass in our user ID:
const resolvers = {
Query: {
user: function (_, { id }) {
return userLoader.load(id);
},
},
}
Authorization
Authorization is an entirely different problem with GraphQL. In a nutshell, it’s the process of identifying whether a given user has permission to see some data. We can imagine scenarios where an authenticated user can execute queries to get their own address information, but they should not be able to get the addresses of other users.
To handle this, we need to modify our resolver functions. In addition to a field’s arguments, a resolver also has access to its parent, as well as a special context value passed in, which can provide information about the currently authenticated user. Since we know that addresses is a sensitive field, we need to change our code such that a call to users doesn’t just return a list of addresses, but actually, calls out to some business logic to validate the request:
const getAddresses = function(currUser, user) {
if (currUser.id == user.id) {
return user.addresses
}
return [];
}
const resolvers = {
Query: {
user: function (_, { id }) {
return users[id];
},
},
User: {
addresses: function (parentObj, {}, context) {
return getAddresses(context.currUser, parentObj);
},
},
};
Again, we don’t need to explicitly define a resolver for each User field—only the one which we want to modify.
By default, express-graphql passes the current HTTP request as a value for context, but this can be changed when setting up your server:
app.use(
"/graphql",
express_graphql({
schema: schema,
graphiql: true,
context: {
currUser: user // currently authenticated user
}
})
);
Schema best practices
One aspect missing from the GraphQL spec is the lack of guidance on versioning schemas. As applications grow and change over time, so too will their APIs, and it’s likely that GraphQL fields and objects will need to be removed or modified. But this downside can also be positive: by designing your GraphQL schema carefully, you can avoid pitfalls apparent in easier to implement (and easier to break) REST endpoints, such as inconsistencies in naming and confusing relationships. Marc-Andre has listed several strategies for building evolvable schemas which we highly recommend reading through.
In addition, you should try to keep as much of your business logic separate from your resolver logic. Your business logic should be a single source of truth for your entire application. It can be tempting to perform validation checks within a resolver, but as your schema grows, it will become an untenable strategy.
When is GraphQL not a good fit?
GraphQL doesn’t mold precisely to the needs of HTTP communication the same way that REST does. For example, GraphQL specifies only a single status code—200 OK—regardless of the query’s success. A special errors key is returned in this response for clients to parse and identify what went wrong. Because of this, error handling can be a bit trickier.
As well, GraphQL is just a specification, and it won’t automatically solve every problem your application faces. Performance issues won’t disappear, database queries won’t become faster, and in general, you’ll need to rethink everything about your API: authorization, logging, monitoring, caching. Versioning your GraphQL API can also be a challenge, as the official spec currently has no support for handling breaking changes, an inevitable part of building any software. If you’re interested in exploring GraphQL, you will need to dedicate some time to learning how to best integrate it with your needs.
Learning more
The community has rallied around this new paradigm and come up with a list of awesome GraphQL resources, for both frontend and backend engineers. You can also see what queries and types look like by making real requests on the official playground.
We also have a Code[ish] podcast episode dedicated entirely to the benefits and costs of GraphQL.
The post Building a GraphQL API in JavaScript appeared first on Heroku.
]]>Sometimes, it takes a pandemic
Times of sudden change, like…
The post Electric’s Advice During Uncertain Times: Invest in Your Culture appeared first on Heroku.
]]>
Sometimes, it takes a pandemic
Times of sudden change, like during the COVID-19 crisis, are especially tough on everyone. Most companies are scrambling to figure out their “new normal;” employees and teams are struggling to adjust to a dramatically different day-to-day. Despite a myriad of challenges, the business still depends on everyone staying productive, collaborative, and efficient while working remotely. How can weathering sudden, radical change be less painful for all?
There’s a lot of helpful advice these days around how to set up and optimize a fully remote workplace. These tactical steps are important, but they don’t always address the intangible needs of an organization. Culture — the shared mindset, practices, and experiences that define a group of people — can either add friction or fuel positive outcomes in the face of change.
For Electric, a remote IT solution provider, it all starts with developing a culture that thrives on change. I find their model and methods both impressive and inspiring.
Electric makes agility a top priority
I recently met up with Yotam Hadass, VP of Engineering at Electric, to hear more about his perspective on remote work and operational agility. Electric provides online IT solutions for small to medium-sized businesses with anywhere from a dozen to several hundred employees. Their 100% remote service integrates with customers’ Slack or Microsoft Teams and provides real-time helpdesk support for a wide range of IT issues, including hardware, software, network, and security.
Since the pandemic hit, Electric has seen a new wave of customers who are under pressure to move their IT operations online and need extra guidance and support to navigate such unfamiliar territory. These conversations are a natural part of Electric’s close customer relationships, which stem from the company’s commitment to feedback and dialog — key components of its culture.
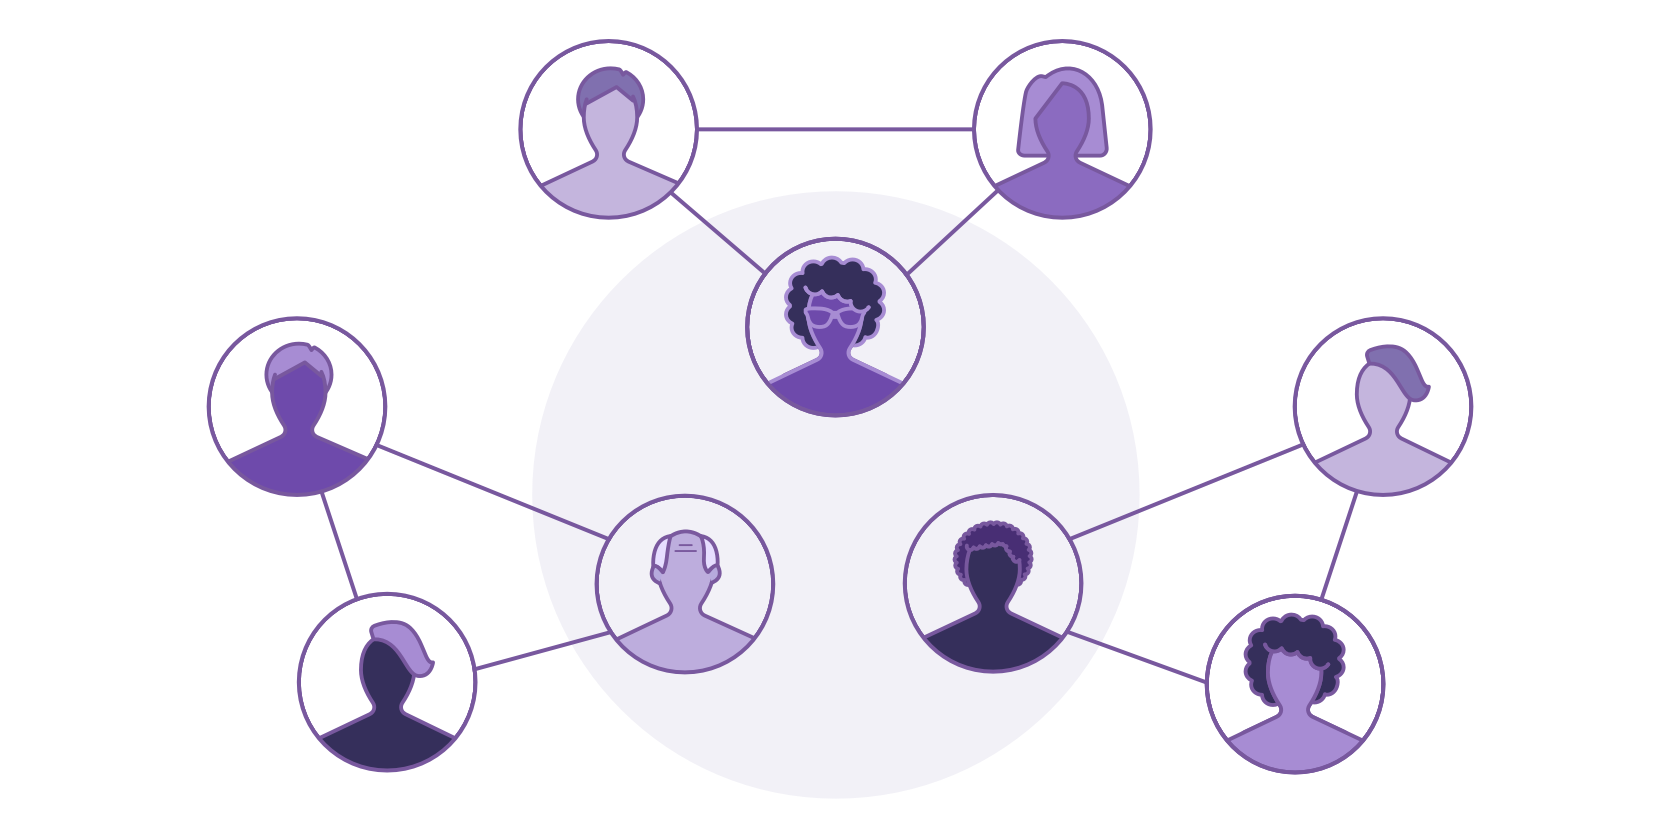
A holistic approach to engineering ops
Feedback and dialog also play an important role in keeping the engineering organization energized and continuously improving. Electric’s concept of operational agility is based on lean development — the classic build/measure/learn loop that drives product development. The same thinking can be applied to operations. An operation only works well if you continue to learn from it and iterate on it. This is where Electric’s culture shines.
At Electric, an operation is defined as a combination of specific processes, the value that they bring to the organization, and the team experience of implementing them (as well as tooling, technology, and similar considerations). An operation is a team’s best practice of doing a thing at a particular moment. How they do it or why they do it may change in the future, but the current best practice represents the team’s shared knowledge and agreement as it stands today.
In the engineering arena, an operation may focus on agile development, roadmap planning, tech debt elimination, developer experience, continuous delivery — basically any topic that impacts a team’s ability to deliver upon their goals.
Finding the balance between structure and freedom
Typically, organizations approach operations in one of two polar opposite ways. Either team practices and workflows are mandated from senior management; everyone must adhere to the same, prescribed path. This can cause a sense of frustration in some individuals, and it can impose a rigidity that doesn’t serve all teams or needs well. Or conversely, nothing is mandated and every team does whatever works for them, which creates inconsistency between teams and can hinder collaboration. In most cases, operations get set up, become fixed, and rarely change.
Electric aims for the middle ground. They’ve established a collaborative process that empowers special best practice teams, called “councils” who function as caretakers of their particular operation. Run by volunteers who are passionate about the topic, these councils meet regularly to gather feedback, discuss ideas, define, and iterate on best practices for that operation. They make sure that input comes from the entire organization and not just one or two people’s opinions or experiences. The result: org-wide alignment that still leaves room for autonomy and innovation.
Yotam Hadass says “Our overall goal is to operate as best as we know how as a team, learn from each other, and continue to improve the process on all fronts.” At Electric, every major operation remains a living, evolving dimension of the organization that can adjust easily as things change. This collective focus on continuous improvement feeds back into the company’s culture. Yotam goes into more depth on this in the Code[ish] podcast: Defining Operational Agility.
There’s gold in customer feedback and dialog
Learning doesn’t just happen within teams. Electric has built a robust feedback loop with customers that enables them to grow their service and business. Beginning with customer onboarding, a dedicated implementation team follows a structured process that works closely with customers from initial needs assessment to training. Much of this happens as a series of conversations about what IT means to a particular customer’s organization and how Electric can support their unique configurations and workflows.
Once up and running, customer success teams check in with customers regularly to help solve problems or gather new learnings. The service itself is also a source of feedback as real-time conversations happen with employees in a helpdesk chat channel.
Sometimes, this customer dialog surfaces new insights that can influence the product roadmap. Says Yotam, “Customer feedback has really shaped our product. We learn so much from our customers. Instead of just having a rigid idea of how things should work and forcing it on customers, we are able to use our learnings to make better product decisions.”
Recently, Electric has taken inspiration from their internal best practice teams and created the Electric Insider Council. This group is made up of a cross-section of customers that come together to have a discussion with the Electric team about what works, what doesn’t, areas of improvement, and more. Any and all feedback is encouraged, and the Electric team allows the customers’ voices to shape how they think about their product.
Investing in culture builds resiliency
Call it agility, flexibility, or just plain openness — Electric embraces change as a driving force behind what makes everyone successful, be it the engineers and teams or the business and its customers. Investing in a culture of continuous improvement builds resiliency. So when the unexpected happens, like a global pandemic, there are processes and a shared mindset in place to adjust as an organization without skipping a beat.
From this perspective, Yotam can even see a silver lining during these times of enforced work from home. He says, “When everyone is remote, the playing field is level. Everyone has an equal chance to participate and be heard, rather than some being left out of in-office conversations.” This sense of equality and inclusivity further enhances a culture that’s already deeply rooted in dialog.
Some of these ideas may feel obvious, but they are so easy to forget in a fast-paced organization. Electric has really made their culture of continuous improvement and innovation a reality. We can learn a lot from them during these uncertain times and beyond.
The post Electric’s Advice During Uncertain Times: Invest in Your Culture appeared first on Heroku.
]]>If you’d prefer a generic guide explaining how to deploy a Python application on Heroku, check out Getting Started on Heroku with Python .
https://www.youtube.com/embed/1923eduj0Gg
Imagine…
The post From Project to Productionized with Python appeared first on Heroku.
]]>If you’d prefer a generic guide explaining how to deploy a Python application on Heroku, check out Getting Started on Heroku with Python.
Imagine that you’ve just spent the last two weeks pouring all your energy into an application. It’s magnificent, and you’re finally ready to share it on the Internet. How do you do it? In this post, we’re going to walk through the hands-on process aimed at Python developers deploying their local application to Heroku.
An application running on Heroku works best as a 12-factor application. This is actually a concept that Heroku championed over 10 years ago. It’s the idea that you build an application with robust redeployments in mind. Most of this workshop is actually not specific to Heroku, but rather, about taking a regular Django application and making it meet the 12 factor app methodology, which has become a standard that most cloud deployment providers not only support but recommend.
Productionized Python Prerequisites
Before completing this workshop, we’re going to make a few assumptions about you, dear reader. First, this is not going to be a Django tutorial. If you’re looking for an introduction to Django, their documentation has some excellent tutorials to follow. You will also need a little bit of Git familiarity, and have it installed on your machine.
In order to complete this workshop, you’ll need a few things:
- An account on Heroku. We recommend the low-cost Eco Dyno. You can upgrade to a more powerful Dyno later.
- The Heroku CLI. Once your application is on Heroku, this will make managing it much easier.
- You’ll need to clone the repository for this workshop, and be able to open it in a text editor.
With all that sorted, it’s time to begin!
Look around you
With the project cloned and available on your computer, take a moment to explore its structure. We’ll be modifying the manage.py and requirements.txt files, as well as settings.py and wsgi.py in the gettingstarted folder.
Updating .gitignore
To begin with, we’ll be updating the gitignore file. A gitignore file excludes files which you don’t want to check into your repository. In order to deploy to Heroku, you don’t technically need a gitignore file. You can deploy successfully without one, but it’s highly recommended to always have one (and not just for Heroku). A gitignore can be essential for keeping out passwords and credentials keys, large binary files, local configurations, or anything else that you don’t want to expose to the public.
Copy the following block of code and paste it into the gitignore file in the root of your project:
/venv
__pycache__
db.sqlite3 # not needed if you're using Postgres locally
gettingstarted/static/
The venv directory contains a virtual environment with the packages necessary for your local Python version. Similarly, the __pycache__ directory contains precompiled modules unique to your system. We don’t want to check in our database (db.sqlite3), as we don’t want to expose any local data. Last, the static files will be automatically generated for us during the build and deploy process to Heroku, so we’ll exclude the gettingstarted/static/ directory.
Go ahead and run git status on your terminal to make sure that gitignore is the only file that’s been modified. After that, call git add, then git commit -m "step 1 add git ignore".
Modularize your settings
Before we deploy Django on Heroku, we want to modularize our Django settings. To do that, add a new folder within gettingstarted called settings. Then, move the settings.py file into that directory. Since this naming scheme is a bit confusing, let’s go ahead and rename that file to base.py. We’ll call it that because it will serve as the base (or default) configuration that all the other configurations are going to pull from. If something like dev.py or local.py makes more sense to you, feel free to use that instead!
Local projects only have one environment to keep track of: your local machine. But once you want to deploy to different places, it’s important to keep track of what settings go where. Nesting our settings files this way makes it easy for us to keep track of where those settings are, as well as take advantage of Heroku’s continuous delivery tool pipelines.
By moving and renaming the settings file, our Django application now has two broken references. Let’s fix them before we move on.
The first is in the wsgi.py in your gettingstarted folder. Open it up, and on line 12 you’ll see that a default Django settings module is being set to gettingstarted.settings, a file which no longer exists:
os.environ.setdefault("DJANGO_SETTINGS_MODULE", "gettingstarted.settings")
To fix this, append the name of the file you just created in the settings subfolder. For example, since we called ours base.py, the line should now look like this:
os.environ.setdefault("DJANGO_SETTINGS_MODULE", "gettingstarted.settings.base")
After saving that, navigate up one directory to manage.py. On line 6, you’ll see the same default being set for the Django settings module. Once again, append .base to the end of this line, then commit both of them to Git.
Continuous delivery pipelines
In an application’s deployment lifecycle, there are typically four stages:
- You build your app in the development stage on your local machine to make sure it works.
- Next comes the review stage, where you check to see if your changes pass with the full test suite of your code base.
- If that goes well, you merge your changes to staging. This is where you have conditions as close to public as possible, perhaps with some dummy data available, in order to more accurately predict how the change will impact your users.
- Lastly, if all that goes well, you push to production, where the change is now live for your customers.
Continuous delivery (CD) workflows are designed to test your change in conditions progressively closer and closer to production and with more and more detail. Continuous delivery is a powerful workflow that can make all of the difference in your experience as a developer once you’ve productionized your application. When you deploy a Django app on Heroku, we can save you a lot of time, as we’ve already built the tools for you to have a continuous delivery workflow. From your dashboard on Heroku, you can—with the mere click of a button!–set up a pipeline, add applications to staging and production, and deploy them.
If you connect your GitHub repository, pipelines can also automatically deploy and test new PRs opened on your repo. By providing the tooling and automating these processes, Heroku’s continuous delivery workflow is powerful enough to help you keep up with your development cycle.
Adding new middleware to base.py
Modularizing your Django settings is a great way to take advantage of this continuous delivery workflow by splitting up your settings, whether you’re deploying to Heroku or elsewhere, but there’s one more change we have to make to base.py.
Django static assets work best when you also use the whitenoise package to manage your static assets. It’s really easy to add to your project.
In your base.py file, scroll down to about line 43, and you should see an array of package names like this:
MIDDLEWARE = [
"django.middleware.security.SecurityMiddleware",
# Whitenoise goes here
"django.contrib.sessions.middleware.SessionMiddleware",
"django.middleware.common.CommonMiddleware",
"django.middleware.csrf.CsrfViewMiddleware",
"django.contrib.auth.middleware.AuthenticationMiddleware",
"django.contrib.messages.middleware.MessageMiddleware",
"django.middleware.clickjacking.XFrameOptionsMiddleware",
]
This is your list of Django middleware, which are sort of like plugins for your server. Django loads your middleware in the order that it’s listed, so you always want your security middleware first, but it’s important to add whitenoise as the second step in this base file.
Copy the following line of code and replace the line that says Whitenoise goes here with this:
"whitenoise.middleware.WhiteNoiseMiddleware",
We’ve loaded whitenoise as middleware, but to actually use the whitenoise compression, we need to set one more variable. Copy the following code and paste it right at the end of your base.py file:
STATICFILES_STORAGE = "whitenoise.storage.CompressedManifestStaticFilesStorage"
With that, we’re done with base.py. Congratulations! Save your work and commit it to Git.
Setting up heroku.py
Our base settings are complete, but now we need Heroku-specific settings to productionize our app. Create a new file under gettingstarted/settings called heroku.py and paste the following block of code:
"""
Production Settings for Heroku
"""
import environ
# If using in your own project, update the project namespace below
from gettingstarted.settings.base import *
env = environ.Env(
# set casting, default value
DEBUG=(bool, False)
)
# False if not in os.environ
DEBUG = env('DEBUG')
# Raises django's ImproperlyConfigured exception if SECRET_KEY not in os.environ
SECRET_KEY = env('SECRET_KEY')
ALLOWED_HOSTS = env.list('ALLOWED_HOSTS')
# Parse database connection url strings like psql://user:pass@127.0.0.1:8458/db
DATABASES = {
# read os.environ['DATABASE_URL'] and raises ImproperlyConfigured exception if not found
'default': env.db(),
}
You can see in this file the values that we’re listing here are the ones that we’re overriding from our base settings, so these are the settings that will be different and unique for Heroku.
To do this, we’re using one of my favorite packages, Django-environ. This allows us to quickly and easily interface with the operating system environment without knowing much about it. It has built-in type conversions, and in particular it has automatic database parsing. This is all we need in order to parse our Heroku Postgres database URL that we will be given. It’s just really convenient.
Heroku-specific files
That’s all the work we need to do to get our application into 12 factored shape, but there are three more files we need in order to deploy to Heroku.
requirements.txt
In addition to the packages your project already uses, there are a few more you need to deploy Django apps to Heroku. If we take a look at the provided requirements.txt file, you can see these required packages here. We’ve already talked about Django, Django-environ, and whitenoise, and we’ve already configured those for use. But the other two are also important and needed for deployment.
The first one is called Gunicorn. This is the recommended WSGI server for Heroku. We’ll take a look at configuring this in just a bit. The next one is psychopg2. This is a Postgres database adapter. You need it in your requirements.txt file to deploy, but you don’t need any code changes in order to activate it.
A quick side note: we’re keeping our discussion on packages simple for the purpose of this demo, but when you’re ready to deploy a real project to Heroku, consider freezing your dependencies. You can do this with the pip freeze command. This will make your build a little bit more predictable by locking your exact dependency versions into your Git repo. If your dependencies aren’t locked, you might find yourself deploying one version of Django one day and a new one the next.
runtime.txt
Heroku will install a default Python version if you don’t specify one, but if you want to pick your Python version, you’ll need a runtime.txt file. Create one in the root directory, next to your requirements.txt, manage.py, .gitignore and the rest. Specify your Python version with the prefix python-, followed by the major, minor, and patch version that you want your application to run on:
python-3.8.2
Procfile
The last file we need to add is a file specific to Heroku: the Procfile. This is what we use to specify the processes our application should run. The processes specified in this file will automatically boot on deploy to Heroku. Create a file named Procfile in the root level directory, right next to your requirements.txt and runtime.txt files. (Make sure to capitalize the P of Procfile otherwise Heroku might not recognize it!) Copy-paste the following lines into it:
release: python3 manage.py migrate
web: gunicorn gettingstarted.wsgi --preload --log-file -
The release phase of a Heroku deployment is the best place to run tasks, like migrations or updates. The command we will run during this phase is to simply run the migrate task defined in manage.py.
The other process is the web process, which is very important, if not outright essential, for any web application. This is where we pass our Gunicorn config, the same things we need when running the server locally. We pass it our WSGI file, which is located in the gettingstarted directory, and then we pass a few more flags to add it a bit more configuration. The --preload flag ensures that the app can receive requests just a little bit faster; the --logfile just specifies that the log file should get routed to Heroku.
Readying for deployment
Take a second before moving on and just double check that you’ve saved and committed all of your changes to Git. Remember, we need those changes in the Git repo in order for them to successfully deploy. After that, let’s get ready to make an app!
Creating an app with heroku create
Since we have the Heroku CLI installed, we can call heroku create on the command line to have an app generated for us:
$ heroku create
Creating app... done, ⬢ mystic-wind-83
Created https://mystic-wind-83.herokuapp.com/ | git@heroku.com:mystic-wind-83.git
Your app will be assigned a random name—in this example, it’s mystic-wind-83—as well as a publicly accessible URL.
Setting environment variables on Heroku
When we created our heroku.py settings file, we used Django-environ to load environment variables into our settings config. Those environment variables also need to be present in our Heroku environment, so let’s set those now.
The Heroku CLI command we’ll be using for this is heroku config:set. This will take in key-value pairs as arguments and set them in your Heroku runtime environment. First, let’s configure our allowed hosts. Type the following line, and replace YOUR_UNIQUE_URL with the URL generated by heroku create:
$ heroku config:set ALLOWED_HOSTS=<YOUR_UNIQUE_URL>
Next, let’s set up our Django settings module. This is what determines what settings configuration we use on this platform. Instead of using the default of base, we want the Heroku-specific settings:
$ heroku config:set DJANGO_SETTINGS_MODULE=gettingstarted.settings.heroku
Lastly, we’ll need to create a SECRET_KEY. For this demo, it doesn’t matter what its value is. You can use a secure hash generator like md5, or a password manager’s generator. Just be sure to keep this value secure, don’t reuse it, and NEVER check it into source code! You can set it using the same CLI command:
$ heroku config:set SECRET_KEY=<gobbledygook>
Provisioning our database
Locally, Django is configured to use a SQLite database but we’re productionizing. We need something a little bit more robust. Let’s provision a Postgres database for production.
First, let’s check if we have a database already. The heroku addons command will tell us if one exists:
$ heroku addons
No add-ons for app mystic-wind-83.
No add-ons exist for our app, which makes sense—we just created it! To add a Postgres database, we can use the addons:create command like this:
$ heroku addons:create heroku-postgresql:hobby-dev
Heroku offers several tiers of Postgres databases. hobby-dev is the free tier, so you can play around with this without paying a dime.
Going live
It is time. Your code is ready, your Heroku app is configured, and you are ready to deploy. This is the easy part!
Just type out
$ git push heroku main
And we’ll take care of the rest! You’ll see your build logs scrolling through your terminal. This will show you what we’re installing on your behalf and where you are in the build process. You’ll also see the release phase as well that we specified earlier.
Scaling up
The last step is to scale up our web process. This creates new dynos, or, in other words, copies of your code on Heroku servers to handle more web traffic. You can do this using the following command:
$ heroku ps:scale web=1
To see your app online, enter heroku open on the terminal. This should pop open a web browser with the site you just built.
Debugging
If you hit some snags, don’t worry, we have some tips that might help:
- Are all of your changes saved and checked into Git?
- Are your changes on the
mainbranch or are they on a different branch? Make sure that whatever you’re deploying, all of your changes are in that Git branch. - Did you deploy from the root directory of your project? Did you also call
heroku createfrom the root directory of your project? If not, this could absolutely cause a trip up. - Did you remove anything from the code in the provided demo that we didn’t discuss?
Logging
If you’ve run through this list and still have issues, take a look at your log files. In addition to your build logs—which will tell you whether your application successfully deployed or not—you have access to all logs produced by Heroku and by your application. You can get to these through a couple of different ways, but the quickest way is just to run the following command:
$ heroku logs --tail
Remote console
Another tool you have is the heroku run bash command. This provides you with direct access from your terminal to a Heroku dyno with your code deployed to it. If you type ls, you can see that this is your deployed application. It can be useful to check that what is up here matches what is locally on your machine. If not, you might see some issues.
Wrapping up
Congratulations on successfully deploying your productionized app onto Heroku!
To help you learn about Heroku, we also have a wealth of technical documentation. Our Dev Center is where you’ll find most of our technical how-to and supported technologies information. If you’re having a technical issue, chances are someone else has asked the same question and it’s been answered on our help docs. Use these resources to solve your problems as well as to learn about best practices when deploying to Heroku.
The post From Project to Productionized with Python appeared first on Heroku.
]]>The new version of Review Apps provides easier access management with a new permission system, and more flexibility for complex workflows with public APIs. It also no longer needs a staging, production, or placeholder app to host its configuration and collaborator access;…
The post Announcing New Review Apps: Expanded Options for Greater Control, Automation, and Easier Access appeared first on Heroku.
]]>The new version of Review Apps provides easier access management with a new permission system, and more flexibility for complex workflows with public APIs. It also no longer needs a staging, production, or placeholder app to host its configuration and collaborator access; this independence supports easier, more flexible application development.
Review Apps are disposable applications that spin up for each pull request in GitHub. They make it possible for development teams to build and test any pull request at a temporary shareable URL before merging changes back to production.
Improved Security and Control with Flexible URL Patterns
Review Apps have their own URL which makes it possible to share the result of latest code changes across your development team for feedback. Review app URLs can also be shared with contractors or clients outside your company, if you need to, so they can review and approve designs and features before merging the pull request and deploying to production. With the new version of Review Apps, it’s possible to select between a random or predictable URL. While the random URLs can provide better security, there are many use cases where you might need a predictable URL pattern. It’s even possible to have your own identifier as part of the predictable pattern, so you can easily distinguish between Review Apps in different pipelines or development environments.
Supporting Automation & Complex Workflows
The new Review Apps API makes it easier to use Review Apps in workflow automations in combination with other tools and products. Since review apps can now be accessed via the API, you can also control them from CI tools other than Heroku CI. Review Apps API is an extension of Heroku’s Platform API which allows enabling, disabling, creating, and deleting Review Apps. This new version makes it possible to enable Review Apps in multiple pipelines for the same repository, which in combination with the API flexibility can cover more complex workflows and use cases.
Also, the new Review Apps are no longer dependent on staging, production, or placeholder apps for collaborators access and configurations. So, a staging app can now be strictly a staging app, without also being used as a source of configuration for Review Apps. This enables easier applications development and makes it possible for customers to not create a staging app if it’s not part of their workflow.
Easier Access Management
A new pipeline permission layer will now bring more visibility and an easier way to manage access to ephemeral apps. You will have the option to get all users with the “member” permission in the Enterprise Teams and Heroku Teams automatically added to this table and given access to the Review Apps within the pipeline.

For collaborators, and other users in your Heroku Enterprise Team, Heroku Team or personal account that can’t be added with auto-join, you can add them manually. For Enterprise Teams you will have the option to select and modify detailed permissions. For Heroku Teams and personal accounts, users inherit the hard coded permission sets.
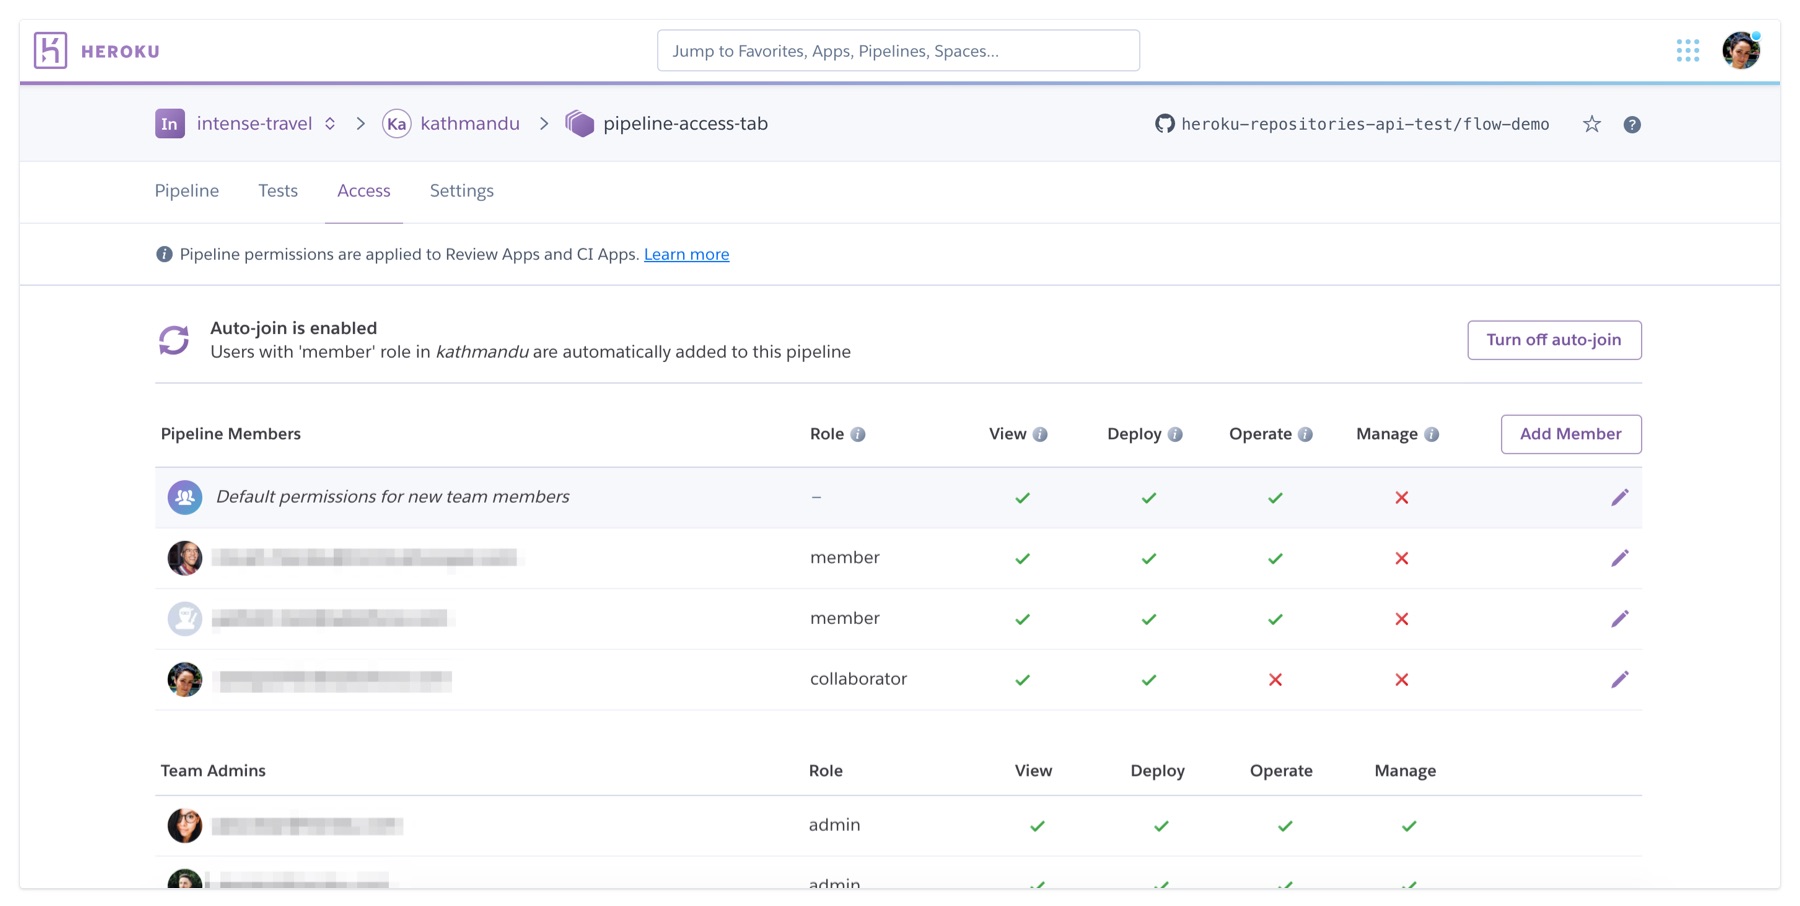
If you are using the older version of Review Apps, it’s very simple to upgrade to this new version, and we highly encourage it so you can benefit from all the improvements. New users of Review Apps will get started on this new version automatically.
Feedback welcome
We hope you enjoy using the new version of Heroku Review Apps. Please visit the Review Apps (New) Dev Center article for more information. Your feedback is highly valuable, please write to us via the “Give us feedback” button above the Review Apps column of your pipeline.
The post Announcing New Review Apps: Expanded Options for Greater Control, Automation, and Easier Access appeared first on Heroku.
]]>The post Heroku Shield for Redis Is Now Generally Available appeared first on Heroku.
]]>In this new age of COVID-19, we know that developer agility and data security are critical concerns for anyone delivering apps with sensitive or regulated data. But the need to move fast is second only to the need to maintain security and compliance.
Our customers in regulated industries like Health & Life Sciences and Financial Services continue to push us in this direction and have informed our roadmap for years. Heroku Shield for Redis continues our ongoing investments in secure, compliant features like Bring Your Own Key, services like Apache Kafka on Heroku Shield, and external integrations over Private Link and mutual TLS.
Build Real-Time Apps with Secure Data, More Easily than Ever
Developers love Redis for its unique ability to deliver sub-millisecond response times and handle millions of operations per second. Its use cases range from well-known to emerging:
- Caching: Some data needs to be accessed quickly and very often. This is the sweet-spot for Redis.
- Database: Optional persistence makes Redis an attractive option for more than interacting with hot data in-memory.
- Job Queues: Queues are used extensively in web development to separate long-running tasks from the normal request-response cycle of the webserver.
- Session Storage: Every web app that wants to track users needs to store session information because HTTP is a stateless protocol. Redis makes a great data store for session data because of its high-performance characteristics.
- Leaderboard: Redis allows any interactive app with a count of up/down votes or a game with a scoring component to track real-time changes across a large body of users.
- Message Broker: Like the Leaderboard example, Redis functions as a lightweight and elegant pub/sub engine for broadcasting messages to one or more channels.
Heroku Shield for Redis makes these features and benefits available for developers working with sensitive and regulated data. What makes Heroku Shield for Redis possible are the additions and improvements in Redis 6, in particular, the new ability to encrypt traffic with TLS natively. TLS is mandatory and enforced on all Shield plans (and Premium and Private plans with Redis 6).
Heroku Shield for Redis runs the same foundation we use to protect our platform. Security is the goal and end-result of our excellence in engineering, and our compliance program verifies and ensures full-credit for the controls we both need in the shared responsibility security model.
Heroku Shield for Redis is available in all six Heroku Shield Private Spaces regions: Dublin, Frankfurt, Sydney, Tokyo, Virginia, and Oregon. PCI compliance for Heroku Shield for Redis is due in the fall of 2020.
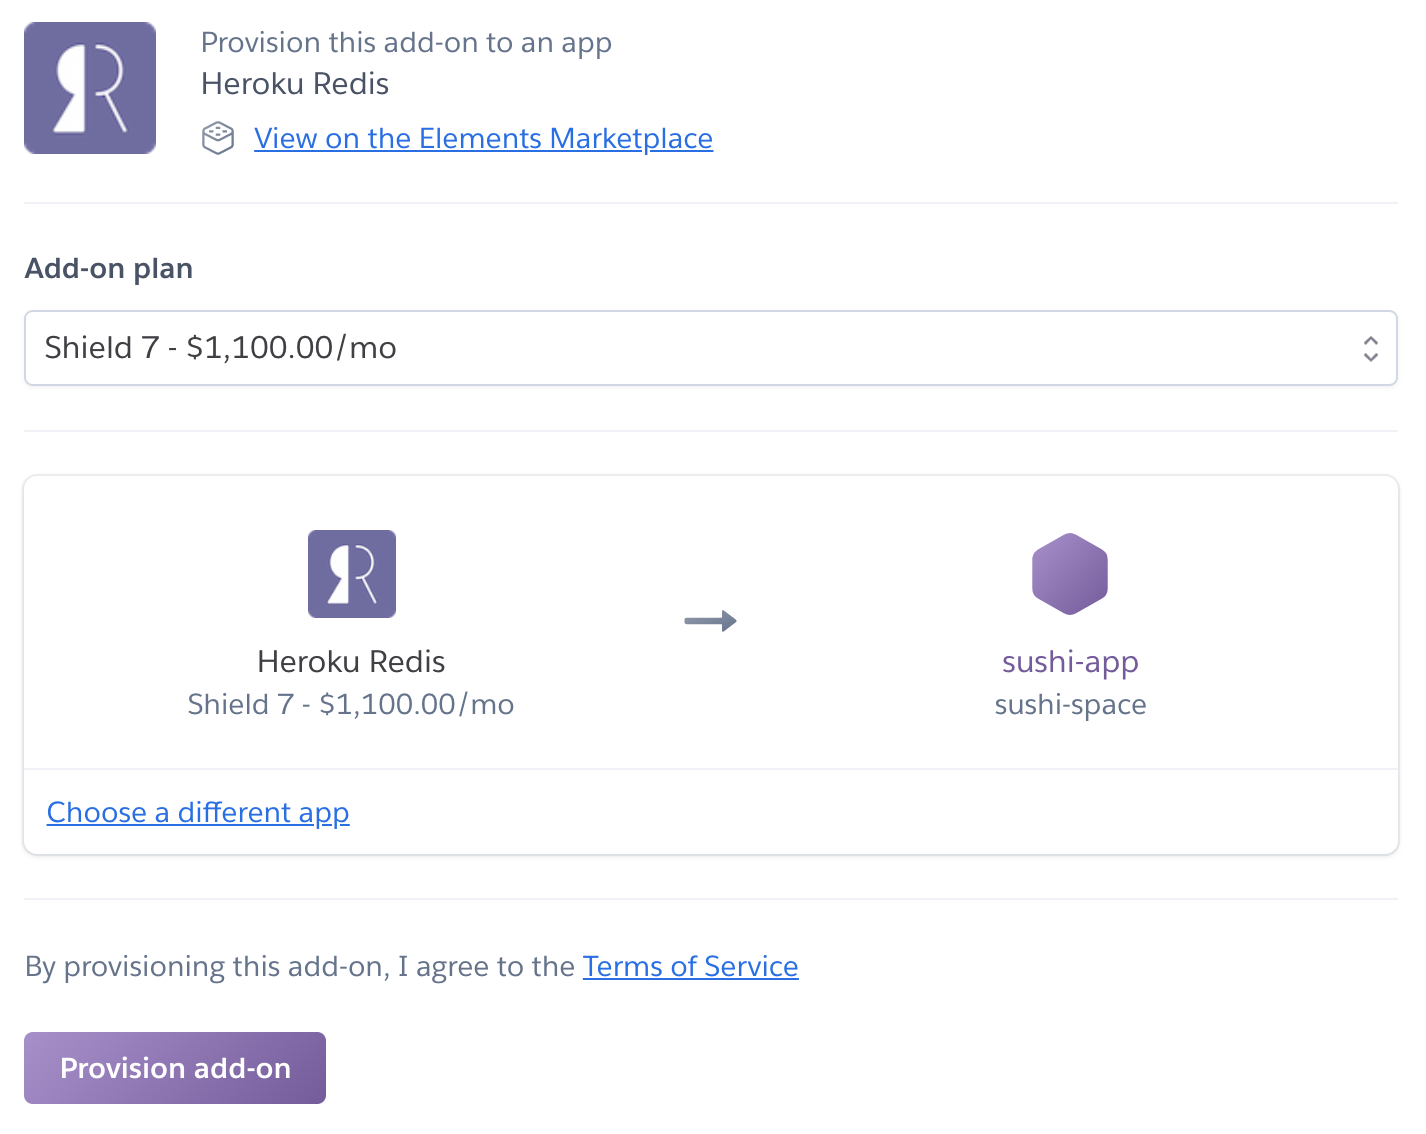
Creating your Heroku Shield for Redis database is as simple as adding the service to a Heroku app in the Heroku Dashboard or CLI:
$ heroku addons:create heroku-redis:shield-7 -a sushi-app
About Heroku Shield
Heroku Shield, first released in June 2017, brings the power and productivity of Heroku to a whole new class of strictly-regulated apps. The outcome is a simple, elegant user experience that abstracts away compliance complexity while freeing development teams to use the tools and services they love.
Heroku Shield Postgres, also released in June 2017, guarantees that data is always encrypted in transit and at rest. Heroku also captures a high volume of security monitoring events for Shield dynos and databases, which helps meet regulatory requirements without imposing any extra burden on developers.
Heroku Shield Connect, first released in June 2018, enables the high performance, fully-automated, and bi-directional data synchronization between Salesforce and Heroku Shield Postgres — all in a matter of a few clicks.
Apache Kafka on Heroku Shield, first released in November 2019, provides all the power, resilience, and scalability of Kafka without the complexity and challenges of operating or securing your clusters.
About Heroku Data for Redis
Heroku Data for Redis is the key-value data store you love, with the developer experience you deserve.
Feedback Welcome
Redis 6 opens a new frontier of development for our customers and us. We look forward to seeing what you can do with it and expect to support more of its new features in the months to come.
Existing Heroku Shield customers can get started with Heroku Shield for Redis today. All developers can upgrade to Redis 6 today too. For more information, see the Dev Center articles for Heroku Shield or Heroku Data for Redis , or contact Heroku. Please send any feedback our way.
Want to learn more about Heroku Shield for Redis? Contact sales
The post Heroku Shield for Redis Is Now Generally Available appeared first on Heroku.
]]>Yesterday, I took my rusty old bike out of the basement and rode through Golden Gate Park to Ocean Beach and back. The 6+ mile ride may seem short to some, but for me, it was something I never thought I’d be doing just a short time ago. I’m on a roll (literally!) that started at the beginning of May when I joined the “Active Together While Apart” activity challenge.
As I wrote about in my earlier blog post , Heroku customer Active for Good is working to fight severe acute malnutrition in children around the…
The post 161 Lives Saved (and Counting): Team Heroku Steps Up to Help Feed Malnourished Kids appeared first on Heroku.
]]>Yesterday, I took my rusty old bike out of the basement and rode through Golden Gate Park to Ocean Beach and back. The 6+ mile ride may seem short to some, but for me, it was something I never thought I’d be doing just a short time ago. I’m on a roll (literally!) that started at the beginning of May when I joined the “Active Together While Apart” activity challenge.
As I wrote about in my earlier blog post, Heroku customer Active for Good is working to fight severe acute malnutrition in children around the world with a unique program here in North America. The organization runs activity challenges that inspire people to get more exercise, and simply by doing so, contribute to their cause. This means that for every minute of activity, participants generate points that unlock lifesaving meals for malnourished kids.
What better motivation to help oneself than to also help others in the most fundamental way. Doing so with friends adds fun into the mix, especially during these pandemic times when many of us feel so isolated.
Teams get active together
Active for Good is designed for teams. The organization offers sponsorship opportunities to companies, nonprofits, churches, schools — any group that wants to run a private challenge and engage their own community in health initiatives or global issues. Students in particular have embraced the activity challenge as part of school projects, senior presentations, extracurricular activities, and even the time-honored tradition of embarrassing their teachers on stage. The challenge format is simple enough that moderators can truly get creative with their events.
Recently, Active for Good has started running public challenges that are open to everyone for a designated period of time (typically one month). They are free to join, and anyone can start a team or join a team. Leaderboards keep the competition lively, and the mobile app UI and notifications keep participants engaged with their progress.

Go Team Heroku!
During May, Team Heroku entered the “Active Together While Apart” public challenge, ready to get seriously busy. Our team grew to 43 members strong, each contributing their personal minutes to an overall pot that unlocked a whopping 1,314 RUTF (Ready to Use Therapeutic Food) packets for needy children. We placed 7th in the region, which also reflected our collective hard work.

I’d like to give a shout out to my colleague Van Bach and her husband Eduardo for leading the charge. Van placed #5 in the Team Heroku rankings, and Eduardo placed #1! Van describes the challenge as the extra motivation she needed to push herself: “The Active for Good app is such a fun, low effort way to help make a difference. I love that the integration with my fitness device is seamless and I don't have to think about it. My husband and I both use the app and we find the ranking system a great motivator for friendly competition. It really made a difference between deciding to slack off for the day, or to power through it and climb one more spot!”
Special thanks to another colleague, Summer Bolen, who helped raise awareness at Salesforce by sharing her experience on our internal Chatter channel. For Summer, the competition aspect was a welcome surprise and added fuel to her motivation: “I never knew I was so competitive, but seeing myself on the bottom of the leaderboard definitely lit a fire and has helped hold me accountable to stay active throughout my days. My favorite way to earn points: hiking, yoga, house cleaning, and meditation (worth the most points!).”
Onwards to the June challenge
The latest Active for Good public challenge started this week, and Team Heroku is already racking up points. Incidentally, at the time of writing, Eduardo is in the #1 spot. Challenge anyone?
We invite you to join the June challenge “Hello Summer!” and get active with us. You can start at any time during the month and your activity can be added retroactively.
![]()
By being active together in May, the combined efforts of all teams donated 24,214 meals that saved the lives of 161 children suffering from severe acute malnutrition. What a profoundly satisfying accomplishment! For me, it made every breathless step up San Francisco’s neighborhood hills, every Zoom dance class and yoga session, every late-night house cleaning frenzy, and now, every pedal of my old bike, totally worth it.
Learn more about Active For Good's impact, how their public activity challenges fight malnutrition, or join their latest activity challenge.
Listen to the Code[ish] podcast featuring Troy Hickerson and Luke Mysse: Special Episode — Active for Good.
The post 161 Lives Saved (and Counting): Team Heroku Steps Up to Help Feed Malnourished Kids appeared first on Heroku.
]]>At Heroku, we have gone from roughly over half of our team being remote, to all of our team being remote. We, along with people all over the world, have suddenly found ourselves working from living rooms, laundry rooms, gardens, garages, sheds,…
The post Climbing Up The Walls: (Not) Remotely Business As Usual appeared first on Heroku.
]]>At Heroku, we have gone from roughly over half of our team being remote, to all of our team being remote. We, along with people all over the world, have suddenly found ourselves working from living rooms, laundry rooms, gardens, garages, sheds, and kitchens. It can be overwhelming at times—learning new skills and adjusting old ones—so we wanted to step back and celebrate the unique ways we’re all coping.
I wanted to revisit the idea of sharing our spaces, work and otherwise, to hopefully make us all feel a little less alone. Here are some examples of how the team has adjusted, and coped, in the new normal.


This post is a follow on to our previous post on a similar theme, On Making Work Less Remote. It is also related to the podcast “Books, Art, and Zombies: How to Survive in Today's World”, in which Charlie Gleason and Margaret Francis discuss the ways in which they're keeping hope and happiness alive with their families.
The post Climbing Up The Walls: (Not) Remotely Business As Usual appeared first on Heroku.
]]>Given the needs of our customers, including those in regulated industries like Health & Life Sciences and Financial Services, we are thrilled to announce that Heroku Private Spaces and Shield customers can now deploy a new Postgres, Redis, or Apache Kafka service with a key created and managed in their private AWS KMS account. With BYOK, enterprises gain full data custody and data access control without taking on the…
The post Bring Your Own Key for Heroku Managed Data Services Is Now Generally Available appeared first on Heroku.
]]>Given the needs of our customers, including those in regulated industries like Health & Life Sciences and Financial Services, we are thrilled to announce that Heroku Private Spaces and Shield customers can now deploy a new Postgres, Redis, or Apache Kafka service with a key created and managed in their private AWS KMS account. With BYOK, enterprises gain full data custody and data access control without taking on the burden of managing any aspect of the data service itself.
This feature is available on all Private and Shield data plans, starting today, at no additional cost, outside of any cost associated with AWS KMS.
Those customers who choose not to use BYOK will still have their Heroku Data services encrypted with a key that we own and control. There is no change to the current experience or features.
Developed with Enterprise Security in Mind
Enterprises are increasingly thinking about the threat of a compromise to their data and data services. Many of our most progressive and security-conscious enterprise customers asked us for a “kill switch” that can prevent anyone from accessing their data and data service, even their own employees or us, upon request.
Late last year, we began engaging with these customers to understand their views on data security and validate our designs for a BYOK option. Moneytree had a compelling business need and a deep technical understanding of how they wanted it to work. Their guidance was instrumental in the feature set and experience released today:
“Moneytree uses Heroku’s new BYOK feature to meet the security and compliance requirements of our Financial Institution clients. The simplicity of it kept our team’s overhead down while meaningfully improving our security.” — Ross Sharrott, Chief of Technology and Founder, Moneytree
Designed to Share Responsibility Seamlessly
Enterprises create the key and manage the full lifecycle in AWS KMS. To use a key with a new Heroku Data service, copy the key’s ARN from the AWS CLI or Console, and then pass the ARN when creating a new add-on in the Heroku CLI:
$ heroku addons:create heroku-postgresql:shield-0 --app sushi --encryption-key [arn:aws:kms:...]
See the Dev Center articles for encrypting a new Heroku Postgres database with your encryption key and migrating an existing Postgres database to one using your own encryption key, as well as Heroku Redis and Apache Kafka on Heroku.
Once we receive the provisioning request, we encrypt all data stored at rest (including backups) with the encryption key. Forks and followers inherit this key too. Our Managed Data Services work the same as before, with minor limitations.
As part of incident response or breach containment playbook, enterprises can revoke access to the key in the AWS CLI or Console. Within minutes, Heroku detects it, shuts down all data services that use the key, and stops all servers that run those services. Data in the database(s) and the backup file(s) are inaccessible, no one can access them without the key, but no data is deleted or lost.
Properly coded apps can detect this as downtime and go into maintenance mode.
When the threat has passed, enterprises can restore access to the key in the AWS CLI or Console. Within minutes, Heroku detects it and brings everything back online. All apps work as before without intervention.
Note that we do not store the Customer Master Key (CMK) from AWS KMS or deal with its management in any way. We gain access to it at the time of creation. We periodically check its status and act when needed.
Built with the Strengths of Heroku and AWS
Like our previous Private Link integrations, this integration combines the strengths of Heroku and AWS into a simple and straightforward developer experience. BYOK is another step forward for our combined investments in developer agility and enterprise security. We can’t wait to see all our customers using it.
Please send any feedback our way.
Want to learn more about Bring Your Own Key for Heroku Managed Data Services? Contact sales
The post Bring Your Own Key for Heroku Managed Data Services Is Now Generally Available appeared first on Heroku.
]]>…
The post A True Win-Win: How Being More Active Can Help Fight Malnutrition appeared first on Heroku.
]]>
Food as prescribed medicine
To start with, Active for Good is easy to love. It’s a sister organization of MANA Nutrition, a nonprofit that manufactures ready-to-use therapeutic food for children suffering from severe acute malnutrition. Kids receiving MANA treatment range from six months to about six years and are located across Africa, as well as in parts of Southeast Asia, Central America, and even North Korea.
It goes without saying that most malnourished children in the developing world don’t have access to a hospital bed with a feeding tube. “MANA” stands for “Mother Administered Nutritive Aid,” and their meal packets are designed to allow a mother to feed her child at home in any environment. No refrigeration, cooking, or even water is needed — meals are based on a type of peanut butter that’s been supercharged with all the micronutrients needed to bring a child back from the brink of starvation.
Over the past 10+ years, this type of therapy has become the standard of care for the World Food Programme, UNICEF, USAID, and similar agencies. The results are impressive. After completing six weeks of MANA therapy, over 95% of children treated never return to their previous level of malnutrition.
Today, nearly 20 million children are in desperate need of treatment. So, how can one person make a difference? It turns out, anyone can help simply by being active.
Scaling empathy and connection
MANA was founded in 2009. Once operations were up and running smoothly, the MANA team wanted to extend their vision. How could they connect their cause to people in North America who had the opposite problem? Could they somehow help people in the developed world fight obesity and raise awareness of global malnutrition at the same time?
In 2014, Active for Good was born as a project to bridge these two worlds. Says co-founder Troy Hickerson: “Our goal is to help both sides of the health equation. We're getting fit, kids are getting fed, and everyone wins.”
For the team at Active for Good, their focus is not just about helping people stay fit or lose weight. Nor is it all about encouraging people to help end a humanitarian crisis. It’s about what lies underneath the two that creates the true bridge between them. “We’re interested in the impact of scaling empathy and connection,” says Hickerson, “and we wonder how different the world would be if we had more of it.” These powerful feelings can improve our own lives and communities in innumerable ways and lead to a sense of purpose.
When it comes to getting more exercise, purpose can be a powerful motivator. It can also shift the attention away from our own (sometimes shame-based) personal narratives. These days, I’m sure I’m not the only one telling myself I’m getting “pudgy” (to put it mildly).
Burn a calorie, contribute a calorie
Active for Good drives its mission primarily through time-based activity challenges. Each challenge lasts for a designated period of time, such as 30 days. Most are private events. Companies will sponsor a challenge for their employees as a team-building or employee engagement initiative. Other organizations, such as churches and nonprofits also run challenges to engage their community in global issues. There are even very short-term challenges that happen within an hour or two, such as during breaks at a conference.
Recently, Active for Good has started running free challenges that are open to the public. So, what do you need to do to join in?
Signup and setup are a snap — you download the Active for Good app, register with the event code, and connect your fitness tracker, such as the iPhone’s health app, Fitbit, or Garmin, to the app. That’s it. The rest is entirely up to you.
During the month, every minute you spend exercising earns points towards unlocking a MANA meal packet for a child. The app serves up microstories along the way to help you stay motivated, and there’s also a leaderboard for those who love to compete. Says marketing director Luke Mysse, “One of the things I love about the app is the tangible tie to the impact I’m making. The fact that I can see my activity actually unlock a meal and know that it will help a kid, that really keeps me going.”
Schools in particular have taken up the challenge — and run with it. Harnessing student energy and enthusiasm for the cause, many schools not only run challenges, but also use Active for Good as part of a student development program. Student leaders set up, promote, and manage the challenge. They’ll run offbeat activities like hula-hoop contests or musical chairs, and a few will even invite teachers to compete in front of the school assembly (with hilarious results). Programs also tie in with geography classes; students research and give presentations on the countries and communities impacted by their challenge. At one high school in Canada, seniors are sharing their Active for Good projects in their capstone presentation.
Kids helping kids — they don’t think about all the tradeoffs in their personal time management; they just jump in and act. There’s a lesson in there for us adults.
The latest challenge: Active Together While Apart
Fast forward to May 1st, which starts tomorrow! Active for Good’s latest challenge, “Active Together While Apart,” is free and open to the public. Anyone can join the challenge at any time during the month (every little bit counts).
If you miss this one, no worries. Keep an eye out as more public challenges will roll out in the coming months.
Wherever you are, and whatever your local situation may be during this global pandemic, you can still connect with friends, family, and others by being active together virtually or at a safe distance. At the same time, you can connect with a child and a community on the other side of the world through your impact. Personally, I look forward to seeing how much I can contribute.
We invite you, your family and friends, and anyone in the Heroku community, to join Team Heroku in this upcoming Active for Good challenge. See you on the leaderboard!
Read about our team’s impact after participating in a recent activity challenge: 161 Lives Saved (and Counting) — Team Heroku Steps Up to Help Feed Malnourished Kids.
Listen to the Code[ish] podcast featuring Troy Hickerson and Luke Mysse: Special Episode — Active for Good.
The post A True Win-Win: How Being More Active Can Help Fight Malnutrition appeared first on Heroku.
]]>Over the last twenty years, software development has advanced so rapidly that it's possible to create amazing user experiences, powerful machine learning algorithms, and memory efficient applications with incredible ease. But as the capabilities tech provides has changed, so too have the requirements of individual developers morphed to encompass a variety of skills. Not only should you be writing efficient code; you need to understand how that code communicates with all the other systems involved and make it all work…
The post Evolving Alongside your Tech Stack appeared first on Heroku.
]]>Over the last twenty years, software development has advanced so rapidly that it's possible to create amazing user experiences, powerful machine learning algorithms, and memory efficient applications with incredible ease. But as the capabilities tech provides has changed, so too have the requirements of individual developers morphed to encompass a variety of skills. Not only should you be writing efficient code; you need to understand how that code communicates with all the other systems involved and make it all work together.
In this post, we'll explore how you can stay on top of the changing software development landscape, without sacrificing your desires to learn or the success of your product.
User experience depends on technical expertise
When the iPhone first came out in 2007, it was rather limited in technical capabilities. There was no support for multitasking and gestures, no ability to copy and paste text, and there wasn't any support for third-party software. It's not that these ideas were not useful, it’s just that the first generation of the phone's hardware and operating system could not support such features. This serves as a good example to underscore how UX has sometimes been constrained by technology.
Now, the situation has changed somewhat. Tools have advanced to the point where it's really easy to create a desktop or mobile app which accepts a variety of gestures and inputs. The consequences of this are twofold. First, users have come to expect a certain level of quality in software. Gone are the days of simply "throwing something together"; software, websites, and mobile apps all need to look polished. This requires developers to have a high level of design sensibility (or work with someone else who does). Second, it means that the role of the engineer has expanded beyond just writing code. They need to understand why they're building whatever it is they're building, why it's important to their users, and how it functionally integrates with the rest of the app. If you design an API, for example, you’ll need to secure it against abuse; if you design a custom search index, you need to make sure users can actually find what they’re looking for.
On the one hand, because you're running on the same devices and platforms as your users (whether that a smartphone or an operating system), you're intricately familiar with the best UI patterns—how a button should operate, which transitions to make between screens—because every other app has made similar considerations. But on the other hand, you also need to deal with details such as memory management and CPU load to ensure the app is running optimally.
It’s not enough for an app to work well, as it must also look good. It's important to find a balance of both design sensibilities and technical limitations—or at least, a baseline knowledge of how everything works—in order to ship quality software.
Follow everything but only learn some things
When it comes to personal growth, learning to prioritize solutions to the problems you encounter can be critical in your development. For example, suppose you notice one day that your Postgres queries are executing slower than you would like. You should have a general awareness of how higher rates of traffic affects your database querying strategies, or how frequent writes affect the physical tables on disk. But that doesn't necessarily mean that you should sink a massive amount of time and effort to fine-tune these issues towards the most optimal strategy. When developing software, you will always have one of several choices to make, and rarely does one become the only true path forward. Sometimes, having the insight to know the trade-offs and accepting one sub-optimal approach above another makes it easier to cut losses and focus on the parts of your software which matter.
Sometimes, having the insight to know the trade-offs and accepting one sub-optimal approach above another makes it easier to cut losses and focus on the parts of your software which matter.
It seems like every year, a new web framework or programming language is released. This makes it difficult, if not impossible, to follow every single new item when they are announced. The inverse is also true. We might feel that adopting new technologies is one way to stay "relevant," but this attitude can be quite dangerous. If you are an early adopter, you run the risk of being on the hook for finding bugs, distracting you from your actual goal of shipping features for your own application. You should take a calculated approach to the pros and cons of any new tech. For example, switching your database entirely to MemSQL because you heard it's "faster" is less reasonable than making a switch after reading someone's careful evaluation of the technology, and realizing that it matched your own needs as well.
Keeping calm and steady
At the end of the day, you should be very invested in your own stack and the ecosystem you work in. That work can be something as simple as reading Medium posts or following Twitter accounts. Broaden your knowledge of other services outside your own realm of expertise only if you come across someone confronting problems similar to yours. You should own tools which you know how to operate, rather than keep a shed full of all sorts of shiny objects.
The post Evolving Alongside your Tech Stack appeared first on Heroku.
]]>Chatbots don't require much in terms of computational power or disk storage, as they rely heavily on APIs to send actions and receive responses. But as with any kind of software, scaling them to support millions of user’s requests across the world requires a fail-safe operational strategy. Salesforce offers a Live Agent…
The post Building and Scaling a Global Chatbot using Heroku + Terraform appeared first on Heroku.
]]>Chatbots don't require much in terms of computational power or disk storage, as they rely heavily on APIs to send actions and receive responses. But as with any kind of software, scaling them to support millions of user’s requests across the world requires a fail-safe operational strategy. Salesforce offers a Live Agent support product with a chatbot integration that reacts to customer inquiries.
In this post, we'll take a look at how the team uses Heroku for their chatbot's multi-regional requirements.
How users interact with the chatbot
Live Agent is an embeddable chatbot that can be added to any website or mobile app. Users can engage in a conversation with the chatbot, asking questions and performing actions along the way. For example, if a bank customer wants to learn how to set up two-factor authentication, they could ask the chatbot for guidance, rather than call the bank directly.
The aim of Live Agent is to augment a human support agent's capabilities for responding to events that happen at a high scale. Because everybody learns and interacts a little bit differently, it's advantageous to provide help through various mediums, like videos and documentation. Chatbots offer another channel, with guided feedback that offers more interactive information. Rather than providing a series of webpages with static images, a chatbot can make processes friendlier by confirming to users their progress as they go through a sequence of steps.
Live Agent hooks into Apex, a Java-like programming language that is tied directly into Salesforce's object models, allowing it to modify and call up CRM records directly. You can also have a Live Agent chatbot call out to any API and pretty much do anything on the web.
With their open-ended nature, chatbots can perform endless operations across a variety of communication platforms. Facebook Messenger, for example, is the third most popular app in the world, and you could have a Live Agent backend running on the Messenger platform to respond to user queries.
Running Live Agent on Heroku
With such a large scope across disparate mediums, there's a significant number of requests coming into Live Agent chatbots and vast amounts of data they can access. It may surprise you to learn that there are only eight engineers responsible for running Live Agent! In addition to coding the features, they own the entire product. This means that they are also responsible for being on-call for pager rotations and ensuring that the chatbots can keep up with incoming traffic.
The small team didn't want to waste time configuring their platform to run on bare metal or on a cloud VM, and they didn't want the administrative overhead of managing databases or other third-party services. Since Salesforce customers reside all over the world, the Live Agent chatbots must also be highly available across multiple regions.
The Live Agent team put its trust into Heroku to take care of all of those operational burdens. Heroku already manages millions of Postgres databases for our customers, and we have a dedicated staff to manage backups, perform updates, and respond to potential outages. The Live Agent chatbot runs on Java, and Heroku's platform supports the entire Java ecosystem, with dedicated Java experts to handle language and framework updates, providing new features and responding to security issues.
In order to serve their customers worldwide, the core Live Agent infrastructure matches Heroku's availability in every region around the world. All of their services are managed by Heroku, ensuring that their Heroku Postgres, Redis, and Apache Kafka dependencies are blazing fast no matter where a request comes from.
The beauty of it all is how simple it is to scale, without any of Live Agent's team needing to be responsible for any of the maintenance and upkeep.
Leveraging Terraform for replication and Private Spaces for security
The Live Agent platform is comprised of ten separate apps, each with their own managed add-ons and services. To fully isolate the boundaries of communication, the collection of apps are deployed into a Heroku Private Space. Private Spaces establish an isolated runtime for the apps to ensure that the data contained within the network is inaccessible from any outside service.
Private Spaces are available in a variety of regions; if a new region becomes available, the Live Agent team wanted to be able to automatically redeploy the same apps and add-ons there. And if they ever need to create a new app, they also wanted to add it to all of the Private Spaces in those geographic locations.
To easily replicate their architecture, the Live Agent team uses Terraform to automate deployment and configuration of the Live Agent platform. Terraform is the driver behind everything they do on Heroku. With it, they can explicitly and programmatically define their infrastructure–the apps and add-ons, custom domains, and logging and profiling setup–and have it securely available in any region, instantly. Whenever a new configuration is necessary, they can implement that update with just a few lines of code and make it live everywhere with the merge of a pull request.
For example, to automatically set up a Node.js Heroku app that requires a Postgres database and logging through Papertrail, a Terraform config file might just look something like this:
resource "heroku_app" "server" {
name = "my-app"
region = "us"
provisioner "local-exec" {
command = "heroku buildpacks:set heroku/nodejs --app ${heroku_app.server.name}"
}
}
resource "heroku_addon" "database" {
app = "${heroku_app.server.name}"
plan = "heroku-postgresql:hobby-dev"
}
# Papertrail addon (for logging)
resource "heroku_addon" "logging" {
app = "${heroku_app.server.name}"
plan = "papertrail:choklad"
}
Here are some details on how to use Terraform with Heroku.
Learning more
If you'd like to learn more about how Live Agent uses Heroku to scale their platform, our podcast Code[ish], has an interview with their team, where they dive into more of the technical specifics.
We also have not one but two posts on dev.to listing all the DevOps chores which Heroku automatically takes care of for you.
The post Building and Scaling a Global Chatbot using Heroku + Terraform appeared first on Heroku.
]]>Alex Hendricks turns up the radio in the cabin of his ‘91 Ford LT8501. He’s drowning out the noise of the construction crew 100ft ahead as they make progress on a brand new bridge in Waco, Texas. Alex isn’t here to take in the sight of fresh new infrastructure. He’s in his truck waiting for the go-ahead to deliver a payload of hot mastic asphalt to the bridge crew.
Alex has a ticket in his hands that needs a sign-off from the project’s contractor — a signature that proves he made his delivery, and on time.…
The post Impending Vroom — How Ruckit Will Modernize Construction Right in the Nick of Time appeared first on Heroku.
]]>
Alex Hendricks turns up the radio in the cabin of his ‘91 Ford LT8501. He’s drowning out the noise of the construction crew 100ft ahead as they make progress on a brand new bridge in Waco, Texas. Alex isn’t here to take in the sight of fresh new infrastructure. He’s in his truck waiting for the go-ahead to deliver a payload of hot mastic asphalt to the bridge crew.
Alex has a ticket in his hands that needs a sign-off from the project’s contractor — a signature that proves he made his delivery, and on time. Without it, he doesn’t get paid, and the clock is ticking. Each ticket earns him about $60, and missing any of today’s three deliveries will start to make him sweat. His wife, at home with their two-year-old, will start to worry. A technical issue stalls the bridge crew, and the hot asphalt sitting in the bed of Alex’s truck begins to harden.
If Alex's truck rests for too long, the asphalt will solidify, then the contractor will lose the materials, the asphalt company blamed, and the project delayed. Alex will have to fess up to his broker, Sascha Novarro, who texted him the night before to see if he could run the asphalt today, and since he needed the cash, to which he replied with an emphatic "Yes!".
Thankfully, Alex isn’t real. Sascha isn’t real, nor is the bridge project in Waco, nor the contractor about to lose his materials — but the situation they find themselves in occurs every day on thousands of construction sites across the United States.
Timing and coordination are paramount between contractors, foremen, material providers, brokers, and their truckers. These parties are often entirely independent of each other. They form a micro-gig economy that’s been around long before Uber was an idea, and they struggle to coordinate the daily logistics required to achieve their goals. The "endless" highway construction project you’re stuck commuting through daily is built on problems of fraud and inefficiency in the workflow, problems that software company Ruckit tackles every day.
As digital transformations revitalize labor-intensive processes across all industry sectors, opportunities such as trucking, those that pose "too big of a lift," go ignored — but not by Ruckit. In 2018, Ruckit launched a comprehensive platform targeting the construction industry, one of the nation’s un-techiest sectors. The lack of a digital ticketing system, of instant coordination between parties, of real-time logistics, and of fraud-prevention mechanisms all helped trucking become a 40% line-item on the budget for any given construction project.
This is the problem Ruckit solves every day, and they’re pretty much doing it solo.
Construction obstruction
The key challenge in bringing this century’s technical advancements to trucking has little to do with technology and everything to do with the guy in the driver’s seat.
Ruckit discovered that within a given horizontal construction project (bridge, road, highway, railroad, airfield, and similar), each requires the cooperation of approximately 16 unique, and often independent, personas. These range from the project manager to the back-office accountants to the contractor, foremen, broker, material provider, and of course, the trucker.
It was insufficient to digitize any one aspect of construction without digitizing the lot — one missing link in the chain forces all parties into a two-process system (blending the old with the new, and thereby multiplying the logistics). While Ruckit encountered few objections when prescribing their digital panacea to accountants and college-educated project managers, blue-collar truckers had one major hang-up: “What’s in it for me?”
Michael Bordelon, CTO of Ruckit, notes the company found success by satisfying the unique needs of every player along the construction pipeline. Scoping and bifurcating the product experience to enable each individual persona proved a critical decision. For the simple trucker trying to make ends meet, a full digital transformation proved a much tougher sell than most technologists would assume.
Paper tickets make perfect sense to truckers; they meant dollars and cents. These tickets are money they hold in the palms of their hands, not promises of cash from "the cloud." The cloud is hard to understand, and the paper in their hands, not so much.
Rather than fight an uphill battle, Ruckit knew the best way forward was to meet the market where it was. Without turning each trucker’s world into a series of zeroes and ones, Ruckit digitized their contributions and folded them into the bigger system without alienating them or talking down to them. They achieved this by releasing a mobile app that allows truckers to scan their paper tickets and take photos of their trucks on-site to verify deliveries. To entice the independent trucker to adopt the software, the app integrates the entire project pipeline (including backend accounting) to notify the trucker when their brokers submit an invoice for their tickets, when the invoice pays out, and when the trucker can expect money in their bank.
Beyond that, by integrating every animal along the construction food chain, truckers can receive and accept jobs from a single interface without going back-and-forth in phone calls and text messages.
And Ruckit achieved all of this without inventing anything new.
“We’re not inventing any new tech.”
— Michael Bordelon, CTO, Ruckit
Building for the future
Michael admits, emphatically, that Ruckit did not set out to reinvent any tech wheels — all the parts needed to construct and provide their multi-tenant platform showed up turn-key and powerful right out of the box.
From custom mapping tools that help trucks avoid traffic violations and comply with city ordinances, to the AI-enabled OCR (optical character recognition) used to digitize photographs of paper tickets, Ruckit applies best practice and open source tooling to deliver immense value to this underserved market.
The Heroku platform makes it easy for Michael and his team to embed new technology into their Ruby on Rails and Django environments. For example, Ruckit applies machine learning to several layers of their application, one of which helps schedule deliveries to maximize efficiency and circumvent traffic flow — technology that came off the shelf now saves their customers tens of thousands of dollars per year. Cost savings compound when every player on the scene aligns on the Ruckit platform, which happens to be Ruckit’s vision for the future of construction. Over the next decade, Ruckit plans to inspire trust among truckers, a level of trust sufficient to convince them to switch to a purely digital ecosystem — "go paperless," if you will.
By receiving, delivering, and tracking all payloads digitally, Ruckit will have removed the last paper trail holdouts in the construction world. With a pure digital system, Ruckit expects a significant reduction in human error and in delays resulting from the digitization of paper tickets.
That’s their long game, and as of March 2020, the month which saw the dawn on a COVID-19 America, Ruckit is plowing full steam ahead.

Certainly uncertain
Michael approaches the near-term future with trepidation, yet also with optimism. He notes that in times of recession, as those we can expect in the coming years, the construction industry fairs better than most. It is in dire times such as these that governments unlock additional funds to improve infrastructure and push planned public works forward — as a consequence, they put millions of people to work on job sites.
While Ruckit may not be at the center of every project, Michael continues to field two sales calls per day to handle the immense interest in the Ruckit platform.
As our country, and the world at large, begin to recover from the personal and economical impacts of the COVID-19 virus, platforms such as Ruckit will be there to help coordinate the human effort which defines us as a civilized people: building.
“You can’t off-shore construction, and you can’t fake a bridge.”
— Michael Bordelon, CTO, Ruckit
With that, Michael enlightens a long-held perspective on construction as an "unsexy" industry. In reality, whether we’re constructing the information superhighway or the regular kind, we’re still building. In either scenario, we come together as people to create beneficial structures for society. Without new and remodeled roads, highways, bridges, and beyond, the network of travel which modern life relies upon goes unmaintained. Without a system to organize the disparate efforts required, we shed efficiency and precious resources along the way.
Much like Ruckit helps construction projects focus on the deliverables, Heroku helps Ruckit focus on value.
Heroku as a utility
“When you open an office,” Michael reminds, “you don’t buy your own generator, pump it with gas, and plug in your desk lamp. You rely on the power grid. Same goes for our tech.” With Heroku, Ruckit is happy to do away with managing remote servers, load-balancing, uptime, and a host of DevOps tasks that otherwise require complete commitment from specialized employees.
“If there’s a usage spike, we spin up a couple more dynos, and that costs me an extra latte,” he smiles. With Heroku on the backend, Ruckit in the middle, and a host of construction professionals at the frontlines, together we offer a trickle-down efficiency that benefits all parties — it’s a win-win-win.
“I don’t want my team busy wasting resources on DevOps. I want them focused on delivering functionality and value to our end users. Heroku enables that, and I’m never going back.”
— Michael Bordelon, CTO, Ruckit
With Heroku powering Ruckit, and Ruckit powering more of the country’s construction efforts, we can expect a marvelous surge of efficiency and throughput from an industry that was long overdue for a high-tech makeover.
Read the Ruckit case study to learn more about how Michael and team built Ruckit on Heroku.
The post Impending Vroom — How Ruckit Will Modernize Construction Right in the Nick of Time appeared first on Heroku.
]]>A word of caution from a former AP Computer Science teacher who, with zero real-world programming experience, quit her dependable teaching gig to become a software engineer: Imposter Syndrome is never late to class.
When we grow competent in our craft, yet continue to feel unqualified for our role, that feeling is known as "Imposter Syndrome." The syndrome was with me before I started, it’s here with me now, and it will probably be with me for a long time to come.
If you’ve experienced it too, then reading that last sentence may leave you…
The post “Do I Qualify?” And Other Questions Imposters Must Ask Themselves appeared first on Heroku.
]]>
A word of caution from a former AP Computer Science teacher who, with zero real-world programming experience, quit her dependable teaching gig to become a software engineer: Imposter Syndrome is never late to class.
When we grow competent in our craft, yet continue to feel unqualified for our role, that feeling is known as "Imposter Syndrome." The syndrome was with me before I started, it’s here with me now, and it will probably be with me for a long time to come.
If you’ve experienced it too, then reading that last sentence may leave you feeling pessimistic, grim even — as if we anticipate a future where we never feel completely worthy of our position in life. But to that, I say: “So what?”
We do not control our feelings and we cannot simply "choose" to feel worthy, but we can control who we partner with and how we speak to ourselves. This is the story of how I found the perfect sidekick to my career-changing journey — a journey that swallows better people whole.
Do you team up?
As a computer science student, and then teacher, my software engineering knowledge operated primarily at one level: high. I knew how to write Java, how to sort lists backwards and forwards, and how to bitwise AND an integer, but my knowledge merely served as an example and never lived in production. Imagine writing vaporware for a living — it was kind of like that.
But I loved to teach, and still do. I learned an incredible amount simply by expressing my knowledge to younger minds. Learning by teaching, however, has its limits. Several times throughout my tenure as CS teacher, I reached the point of no return. This is the dread of every instructor: the moment a pupil asks a valuable question to which you have no valuable answer.
So, unlike many who become software engineers in pursuit of higher earning power, my goal was to pursue a new wealth of wisdom to bring back to my students, wisdom only gained through experience — I needed to walk the walk.

From teacher to doer
After parting on good terms, I enrolled in a CS master’s program at Georgia Tech, studied for my interviews, and drafted up my resume. To my surprise, things moved too quickly. Despite having just started my transition from teacher to doer, companies clawed at me like I was the last Oreo in the sleeve. However, the enthusiasm was rarely mutual.
One after another, high-intensity interviews left me emotionally and mentally exhausted. Whiteboards were beginning to trigger me and daydreams of returning to my life as a teacher danced around my head. But somehow I knew the right opportunity was out there. Fate rewarded my perseverance when I discovered a curious startup named Panorama Education.
Panorama Education
Panorama provides a specialized data platform for educators. Their tool helps teachers and administrators track metrics of student success, and more importantly, student distress. The product itself was inspiration enough, but a student-focused software company was almost too natural a fit for someone who spent years focusing on her students. I was hooked. However, my limited but emotionally-taxing experience with software interviews prepared me for the worst. I was ready for Panorama to grill me with technical questions, lambast my absent semicolons, and chew me out of the room.
I’m grateful and overjoyed to express that none of these occurred.
Curious things happen at organizations that target the education market. When these companies align themselves with student outcomes, they adopt internally the same practices which deliver those outcomes; they place a focus on education. During my first interview at Panorama, rather than sit there and judge me as I "coded" on a whiteboard, my interviewers joined me on their feet. Two engineers bounced ideas off of me and one another to architect a fictitious web application.

The application was fake, but the experience was real — for the first time since leaving my students behind, I felt like a peer of the community I swore to join. The team invited me back for a second interview, one which pressed the education issue further.
By this point, I would’ve done three Olympic-worthy backflips to make the cut — and I stretched every night just in case — but in lieu of additional coding exercises or impromptu gymnastics routines, my interviewer expected me to learn.
During the interview, I learned git rebase, a topic which lacked immediate appeal. But I trembled with excitement to learn anything of value from a job interview outside of where they kept the good snacks. I paid close attention to the particulars of rebase, and my interviewer challenged me along the way to apply knowledge immediately. And as if this interview lacked originality, at the conclusion I was asked for my opinion.
Across several scenarios, would a merge have better communicated my work intent?
What price was paid by rebasing onto master rather than merging?
Should we change our workflows to avoid rebasing in the future? Why or why not?
I was less shocked by the content than I was by the line of questioning. The interviewer absorbed my beliefs on the subject despite me having discovered the technology moments ago. I felt important, needed, and valued.
Later, I realized this interview ensured I was capable of learning, adapting to new perspectives, and applying them in my day-to-day. Educating one another would reveal itself as a tenet of Panorama culture, one that ensured my opinion was valued and reminded me that I belonged.
Do you qualify?
When you’re switching careers to software engineering and you get that first job offer, that “I’ve made it” moment can be a trojan horse of Imposter Syndrome feelings. I stared at my job offer and wondered aloud, “I’m technically not an engineer, don’t they know that?”

On my first day, as I stood in a circle of the company’s latest recruits and prepared to share my name and role with everyone, anxiety swelled my throat. A high-school teacher was about to call herself a software engineer, and the words she needed had ditched class. The inadequacy and not-enoughness that composes Imposter Syndrome may always be present, but these feelings are strongest in moments when we must present ourselves to others. I wanted to say, “Hi, my name is Meg, and I’m a software engineer,” full-stop. Ten words, nary an error among them, simple and honest. But if you’re intimate with Imposter Syndrome, you’re familiar with qualifying your statements.
“Hi, my name is Meg, I’m a software engineer… but I used to be a high-school computer science teacher and this is my first time working at a place like this, professionally, err, so yeah, I’m here to learn from you guys and do my best!”
I qualify to protect myself, and shock is what I protect myself from.
My good friend Tom from college, several faculty and fellow teachers, and every single person in my yoga certification program shouldn’t have much in common, but they all suffered from the same shock. When I told them what I now did for a living, they cocked an eyebrow and repeated my title back to me as if I were the victim of some Freudian slip: “You’re a software engineer?!” The looks on their faces and tones of their voices combine to what I describe lovingly as the "Patronized Surprise" (PS).
PS is a look of endearing shock that one might express upon seeing a dog walking on its hind legs, a baby forming a sophisticated political opinion, or you know, a woman writing a conditional statement. People generally mean well, for their surprise conveys a sort of unintentional respect — for me having achieved something beyond their imagination — but their imaginations are the source of my, and many a woman’s, pain.
Reactions such as these leave me angry and anxious in anticipation of the next time I’m asked to articulate my role. But rather than confront my patronizers by examining their prejudice, I bury myself further — I qualify, again. I respond in the most sincere way possible with phrases such as, “I can’t believe it either!” or “Yeah, I’m really lucky,” or “Well, I’m still pretty new at it,” and that’s after two years on the job.
The flaw in qualifying ourselves is two-fold.

First, qualifying yourself reinforces the stereotypes presently entrenched in the other’s mind. The qualification namely seeks to extinguish the explosive brushfire of cognitive dissonance set ablaze by your words. The other hears your job title, your strong opinion, or worse, your objection, and upon processing these statements, your words contort their mind into a mental pretzel; a position they only escape by defying their reality or doubting yours.
The latter of the two is the path of least resistance — I’m right and always right, so you must be wrong. By saying things such as, “Well that’s what I read somewhere,” or “But it’s just a silly idea,” you gently nudge a mind teetering on the precipice of change back into its comfort zone.
Second, and far more critical to you and I, qualifying ourselves is a self-fulfilling prophecy. Phrases such as, “But I just started, so I’m still learning,” don’t come out of someone else’s mouth, we utter that drivel. The way we speak to ourselves and about ourselves (a process known as self-talk) reinforces what we believe about ourselves as well. If we spend entire workdays qualifying our ideas and roles, why wouldn’t we feel the same level of uncertainty as our mouth-character proclaims? Because ultimately, what we say is what we think.
For every qualifying statement I devised, I had to spend equal, if not more brain power undoing the damage and rebuilding my self-image — like having to constantly patch a wall that I insist on karate-punching a hole through.
Do you improve?
When I joined Panorama, education happened everywhere I looked: between team members during pair-programming sessions, between colleagues during our "lunchineering" talks, and more intimately, between fellow female engineers who spotted my self-qualifying speech and wanted to help me put an end to it.
They noticed it in person, but saw it more acutely in my messages on Slack. Someone would catch me pre-qualifying my statements with, “I think…,” “Sorry to bother you…,” “Maybe we might want to possibly consider…,” and a host of other filler phrases that required my colleagues to read more words but gain fewer insights.

After taking a hard look at this pattern, I came up with a trick that I continue to use today. Before sending off a formal Slack message or an email, I first send it to myself. The sending is key because I need to read my text from the perspective of my recipient, a colleague or peer receiving my message with fresh eyes. After re-reading what I plan to send, I diligently purge all qualifying statements from my paragraphs. Also, keeping in line with self-talk, I re-read it to myself as an affirmation of my skills and confidence before sending it off — no walls to patch here.
If what we say truly reflects what we think, then the extra couple minutes we spend editing ourselves before presenting to the world is a highly valuable two minutes.
Do you fear the imposter?

Earlier, I wrote of keeping Imposter Syndrome with me as a sort of gaudy souvenir, something that I would cling to for years to come. I can’t say for sure if that statement about Imposter Syndrome is a fact, but in stating it, I’m certain I’ve removed its power. Imposter Syndrome is not something to be feared or conquered, it is a series of natural reactions to new responsibilities and roles in which we do not yet feel comfortable. But as so many great thinkers have already shown us: nothing grows in comfort, pressure creates diamonds, and to gain something you’ve never had, you must do something you’ve never done (me, Patton, and Jefferson, respectively).
I encourage you to look at Imposter Syndrome not as a source of pain, but as a symptom of personal growth and great things to come. When it rears itself, remember that it is merely a reflection of how you perceive you. Keep it calm by teaming up with people who encourage you to learn, make mistakes, and share your thoughts. Then treat your knowledge with the same respect that you treat others’.
I wish you the best of luck on your journey, and may it be as fruitful and life-changing as my own.
The post “Do I Qualify?” And Other Questions Imposters Must Ask Themselves appeared first on Heroku.
]]>The post Building with Web Components appeared first on Heroku.
]]>Web components seek to tilt the balance of web development back towards a standard agreed upon by browser vendors and developers. Various polyfills and proprietary frameworks have achieved what web components are now trying to standardize: composable units of JavaScript and HTML that can be imported and reused across web applications. Let's explore the history of web components and the advantages they provide over third-party libraries.
How it all began
After some attempts by browser vendors to create a standard—and subsequent slow progress—front-end developers realized it was up to them to create a browser-agnostic library delivering on the promise of the web components vision. When React was released, it completely changed the paradigm of web development in two key ways. First, with a bit of JavaScript and some XML-like syntax, React allowed you to compose custom HTML tags it called components:
class HelloMessage extends React.Component {
render() {
return (
<h1>
Hello <span class="name">{this.props.name}</span>
</h1>
);
}
}
ReactDOM.render(
<HelloMessage name="Johnny" />,
document.getElementById('hello-example-container')
);
This trivial example shows how you can encapsulate logic to create React components which can be reused across your app and shared with other developers.
Second, React popularized the concept of a virtual DOM. The DOM is your entire HTML document, all the HTML tags that a browser slurps up to render a website. However, the relationship between HTML tags, JavaScript, and CSS which make up a website is rather fragile. Making changes to one component could inadvertently affect other aspects of the site. One of the benefits of the virtual DOM was to make sure that UI updates only redrew specific chunks of HTML through JavaScript events. Thus, developers could easily build websites rendering massive amounts of changing data without necessarily worrying about the performance implications.
Around 2015, Google began developing the Polymer Project as a means of demonstrating how they wanted web standards to evolve through polyfills. Over the years and various releases, the ideas presented by Polymer library began to be incorporated by the W3C for standardization and browser adoption. The work started back in 2012 by the W3C (and originally introduced by Alex Russell at Fronteers Conference 2011) began to get more attention, undergoing various design changes to address developers' concerns.
The web components toolkit
Let's take a look at the web standards which make up web components today.
Custom elements
Custom elements allows you to create custom HTML tags which can exhibit any JavaScript behavior:
class SayHello extends HTMLElement {
constructor() {
super();
let p = document.createElement(“p”);
let text = document.createTextNode(“Hello world!”);
p.appendChild(text);
this.appendChild(p);
}
}
customElements.define('say-hello', SayHello);
Custom elements can be used to encapsulate logic across your site and reused wherever necessary. Since they're a web standard, you won't need to load an additional JavaScript framework to support them.
HTML templates
If you need to reuse markup on a website, it can be helpful to make use of an HTML template. HTML templates are ignored by the browser until they are called upon to be rendered. Thus, you can create complicated blocks of HTML and render them instantaneously via JavaScript.
To create an HTML template, all you need to do is wrap up your HTML with the new <template> tag:
<template id="template">
<script>
const button = document.getElementById('click-button');
button.addEventListener('click', event => alert(event));
</script>
<style>
#click-button {
border: 0;
border-radius: 4px;
color: white;
font-size: 1.5rem;
padding: .5rem 1rem;
}
</style>
<button id="click-button">Click Me!</button>
</template>
Shadow DOM
The shadow DOM is another concept which provides support for further web page encapsulation. Any elements within the shadow DOM are not affected by the CSS styles of any other markup on the page, and similarly, any CSS defined within the shadow DOM doesn't affect other elements. They can also be configured to not be affected by external JavaScript, either. Among other advantages, this results in lower memory usage for the browser and faster render times. If it's helpful, you can think of elements in the shadow DOM as more secure iframes.
To add an element to the shadow DOM, you call attachShadow() on it:
class MyWebComponent extends HTMLElement {
constructor() {
super();
this.attachShadow({ mode: "open" });
}
connectedCallback() {
this.shadowRoot.innerHTML = `
<p>I'm in the Shadow Root!</p>
`;
}
}
window.customElements.define("my-web-component", MyWebComponent);
This creates a custom element, <my-web-component>, whose p tag would not be affected by any other styles on the page.
Web component ecosystems
The greatest advantage web components have over using a library is their ability to provide standards-compliant, composable HTML elements. What this means is that if you have built a web component, you can package it up as a release for other developers to consume as a dependency in their project, just like any other Node or Ruby package, and those developers can be assured that that web component will work across all (well, most) web browsers without requiring the browser to load a front-end framework like React, Angular, or Vue.
To give an example, Shader Doodle is a custom element which sets up the ability to easily create fragment shaders. Developers who need this functionality can just fetch the package and insert it as a <shader-doodle> tag in their HTML, rather than creating the functionality of Share Doodle from scratch.
Now, with the great interoperability that web components give you, many frameworks and libraries like Vue or React have started to provide the option to generate web components out of their proprietary code. That way you don't have to learn all the low-level APIs of the aforementioned standards, and can instead focus on coding. There many other libraries for creating web components, like Polymer, X-Tag, slim.js, Riot.js, and Stencil.
Another great example of this are Salesforce’s Lightning Web Components, a lightweight framework that abstracts away the complexity of the different web standards. It provides a standards-compliant foundation for building web components which can be used in any project.
Getting more involved web components
We recorded an episode of Code[ish], our podcast on all things tech, that meticulously went through the history (and future!) of web components. Be sure to check out that interview from someone who literally wrote the book on web components.
You can also join the Polymer Slack workspace to chat with other web developers about working with these standards.
The post Building with Web Components appeared first on Heroku.
]]>