Python Bokeh - Plotting Pluses on a Graph
Last Updated :
10 Jul, 2020
Bokeh is a Python interactive data visualization. It renders its plots using HTML and JavaScript. It targets modern web browsers for presentation providing elegant, concise construction of novel graphics with high-performance interactivity.
Bokeh can be used to plot pluses on a graph. Plotting pluses on a graph can be done using the
plus() method of the
plotting module.
plotting.figure.plus()
Syntax : plus(parameters)
Parameters :
- x : x-axis coordinates of the center the plus markers
- y : y-axis coordinates of the plus markers
Returns : an object of class GlyphRenderer
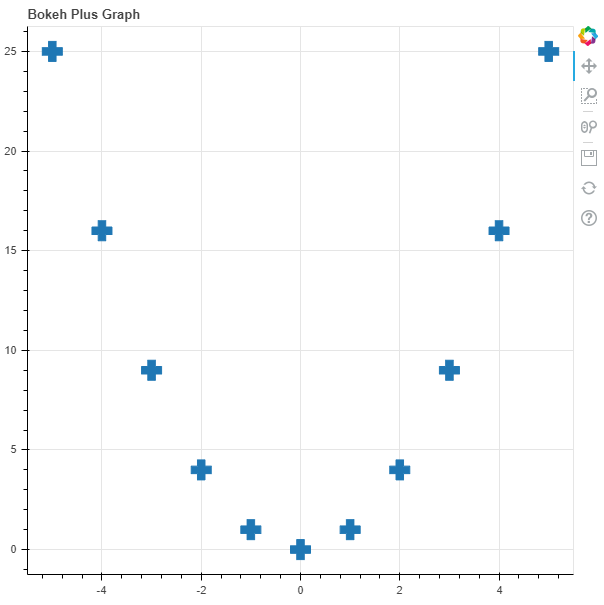
Example 1 : In this example we will be using the default values for plotting the graph.
Python3
# importing the modules
from bokeh.plotting import figure, output_file, show

# file to save the model
output_file("gfg.html")

# instantiating the figure object
graph = figure(title = "Bokeh Plus Graph")

# the points to be plotted
x = [-5, -4, -3, -2, -1, 0, 1, 2, 3, 4, 5]
y = [i ** 2 for i in x]

# plotting the graph
graph.plus(x, y, size = 20)

# displaying the model
show(graph)
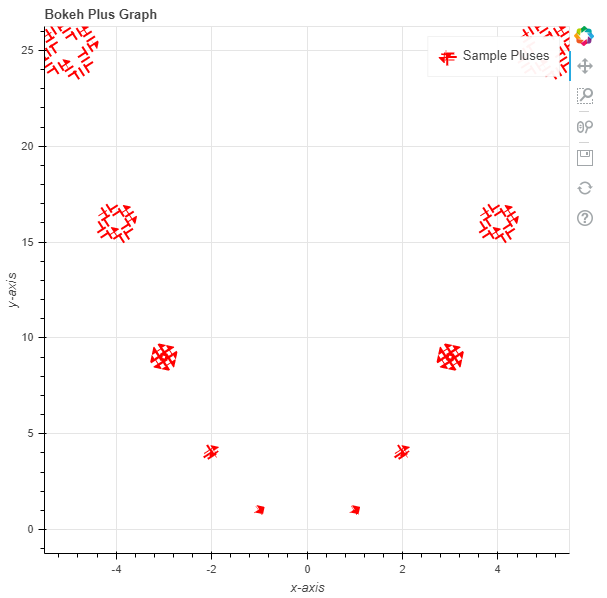
 Example 2 :
 In this example we will be plotting the pluses with dotted lines alongside other parameters and the size of the hexagons are in proportion to their values.
Python3
# importing the modules
from bokeh.plotting import figure, output_file, show

# file to save the model
output_file("gfg.html")

# instantiating the figure object
graph = figure(title = "Bokeh Plus Graph")

# name of the x-axis
graph.xaxis.axis_label = "x-axis"

# name of the y-axis
graph.yaxis.axis_label = "y-axis"

# the points to be plotted
x = [-5, -4, -3, -2, -1, 0, 1, 2, 3, 4, 5]
y = [i ** 2 for i in x]

# size of the hexagons
size = [i * 2 for i in y]

# angle of the hexagons
angle = 10

# fill color value
fill_color = None

# color of the line
line_color = "red"

# type of line
line_dash = "dotted"

# offset of line dash
line_dash_offset = 1

# width of the dashes
line_width = 10

# name of the legend
legend_label = "Sample Pluses"

# plotting the graph
graph.plus(x, y,
           size = size,
           angle = angle,
           fill_color = fill_color,
           line_color = line_color,
           line_dash = line_dash,
           line_dash_offset = line_dash_offset,
           line_width = line_width,
           legend_label = legend_label)


# displaying the model
show(graph)