| CARVIEW |
Select Language
HTTP/2 308
cache-control: public, max-age=0, must-revalidate
content-type: text/plain
date: Sun, 12 Oct 2025 23:13:17 GMT
location: /python/statistical-charts/
refresh: 0;url=/python/statistical-charts/
server: Vercel
strict-transport-security: max-age=63072000
x-vercel-id: bom1::lxl5r-1760310797038-4a9a3e70241b
HTTP/2 200
accept-ranges: bytes
access-control-allow-origin: *
age: 0
cache-control: max-age=600
content-encoding: gzip
content-type: text/html; charset=utf-8
date: Sun, 12 Oct 2025 23:13:17 GMT
etag: W/"68e952e4-97f3"
expires: Sun, 12 Oct 2025 23:23:17 GMT
last-modified: Fri, 10 Oct 2025 18:39:32 GMT
server: Vercel
strict-transport-security: max-age=63072000
vary: Accept-Encoding
via: 1.1 varnish
x-cache: MISS
x-cache-hits: 0
x-fastly-request-id: 65524ef224d2ce90265cfb9d371bafc83ee11687
x-github-request-id: 871B:ACC3E:184827:1DB4DB:68EC3609
x-origin-cache: HIT
x-proxy-cache: MISS
x-robots-tag: index
x-served-by: cache-bom-vanm7210082-BOM
x-timer: S1760310797.081943,VS0,VE285
x-vercel-cache: MISS
x-vercel-id: bom1::lxl5r-1760310797062-e7c6cc1bbd67
content-length: 7200
Statistical charts in Python


Plotly Python Open Source Graphing Library Statistical Charts
Plotly's Python graphing library makes interactive, publication-quality graphs online. Examples of how to make statistical charts such as box plots, histograms, and distribution plots.
Plotly Studio: Transform any dataset into an interactive data application in minutes with AI. Try Plotly Studio now.
-
Error BarsView Tutorial

-
Box PlotsView Tutorial

-
HistogramsView Tutorial

-
DistplotsView Tutorial

-
2D HistogramsView Tutorial

-
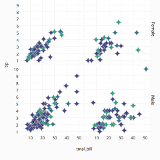
Scatterplot MatrixView Tutorial

-
Facet and Trellis PlotsView Tutorial
-
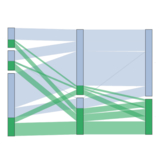
Parallel Categories DiagramView Tutorial
-
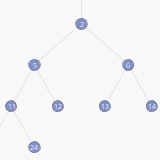
Tree-plotsView Tutorial
-
Violin PlotsView Tutorial

-
2D Histogram ContourView Tutorial

-
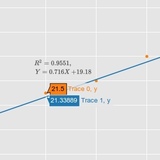
Linear and Non-Linear TrendlinesView Tutorial
-
Marginal Distribution PlotsView Tutorial

-
Strip ChartsView Tutorial
-
Continuous Error BandsView Tutorial
-
Empirical Cumulative Distribution PlotsView Tutorial
Statistical charts in Dash
Dash is the best way to build analytical apps in Python using Plotly figures. To run the app below, run pip install dash, click "Download" to get the code and run python app.py.
Get started with the official Dash docs and learn how to effortlessly style & deploy apps like this with Dash Enterprise.