| CARVIEW |
Select Language
HTTP/2 308
cache-control: public, max-age=0, must-revalidate
content-type: text/plain
date: Tue, 14 Oct 2025 14:56:38 GMT
location: /python/plotly-fundamentals/
refresh: 0;url=/python/plotly-fundamentals/
server: Vercel
strict-transport-security: max-age=63072000
x-vercel-id: bom1::lpsfz-1760453798956-80196ede8a8f
HTTP/2 200
accept-ranges: bytes
access-control-allow-origin: *
age: 0
cache-control: max-age=600
content-encoding: gzip
content-type: text/html; charset=utf-8
date: Tue, 14 Oct 2025 14:56:39 GMT
etag: W/"68e952e4-c879"
expires: Tue, 14 Oct 2025 14:14:23 GMT
last-modified: Fri, 10 Oct 2025 18:39:32 GMT
server: Vercel
strict-transport-security: max-age=63072000
vary: Accept-Encoding
via: 1.1 varnish
x-cache: HIT
x-cache-hits: 0
x-fastly-request-id: 780b2b6671d30a0bb9685d5326d6dfc483c0d519
x-github-request-id: AE10:32B3A4:ADC7D:CCF72:68EE5867
x-origin-cache: HIT
x-proxy-cache: MISS
x-robots-tag: index
x-served-by: cache-bom-vanm7210085-BOM
x-timer: S1760453799.002104,VS0,VE286
x-vercel-cache: MISS
x-vercel-id: bom1::d6tzk-1760453798984-74532d9eccb7
content-length: 8160
Fundamentals in Python

Plotly Python Open Source Graphing Library Fundamentals
Plotly's Python graphing library makes interactive, publication-quality graphs online. Tutorials and tips about fundamental features of Plotly's python API.
Plotly Studio: Transform any dataset into an interactive data application in minutes with AI. Try Plotly Studio now.
-
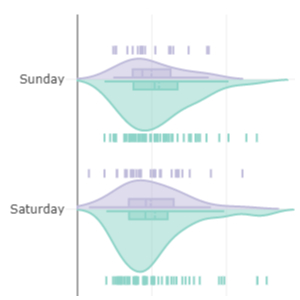
The Figure Data StructureView Tutorial
-
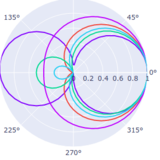
Creating and Updating FiguresView Tutorial
-
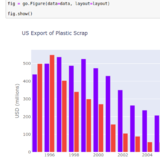
Displaying FiguresView Tutorial
-
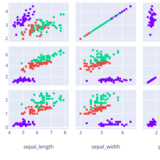
Plotly ExpressView Tutorial
-
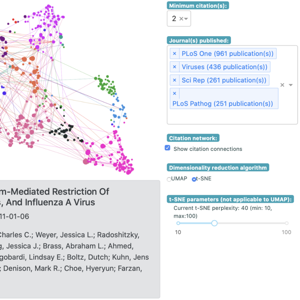
Analytical Apps with DashView Tutorial
-
Static Image ExportView Tutorial
-
Theming and templatesView Tutorial
-
Changes in Version 6View Tutorial
-
Orca ManagementView Tutorial

-
ConfigurationView Tutorial

-
Setting Graph SizeView Tutorial
-
Formatting TicksView Tutorial
-
Setting the Font, Title, Legend Entries, and Axis TitlesView Tutorial
-
AxesView Tutorial

-
LegendsView Tutorial
-
Multiple AxesView Tutorial
-
SubplotsView Tutorial

-
Multiple Chart TypesView Tutorial
-
Plotly Express ArgumentsView Tutorial

-
Styling MarkersView Tutorial
-
Continuous Color Scales and Color BarsView Tutorial
-
Text and AnnotationsView Tutorial
-
Hover Text and FormattingView Tutorial
-
ImagesView Tutorial

-
ShapesView Tutorial
-
IPython vs PythonView Tutorial
-
TroubleshootingView Tutorial

-
Built-in Continuous Color ScalesView Tutorial

-
Discrete ColorsView Tutorial

-
Styling Plotly Express FiguresView Tutorial

-
Interactive HTML ExportView Tutorial

-
Pandas Plotting BackendView Tutorial

-
Figure FactoriesView Tutorial
-
Plotly Express Wide-Form SupportView Tutorial

-
Graph ObjectsView Tutorial
-
Introspecting FiguresView Tutorial

-
Horizontal and Vertical Lines and RectanglesView Tutorial

-
SelectionsView Tutorial
-
Version 4 Migration GuideView Tutorial

-
Static Image Generation Changes in Plotly.py 6.1View Tutorial

-
Supported CSS ColorsView Tutorial

Plotly Express in Dash
Dash is the best way to build analytical apps in Python using Plotly figures. To run the app below, run pip install dash, click "Download" to get the code and run python app.py.
Get started with the official Dash docs and learn how to effortlessly style & deploy apps like this with Dash Enterprise.


