| CARVIEW |
Select Language
HTTP/2 308
cache-control: public, max-age=0, must-revalidate
content-type: text/plain
date: Mon, 13 Oct 2025 14:37:07 GMT
location: /python/financial-charts/
refresh: 0;url=/python/financial-charts/
server: Vercel
strict-transport-security: max-age=63072000
x-vercel-id: bom1::hv957-1760366227447-3d93429e099d
HTTP/2 200
accept-ranges: bytes
access-control-allow-origin: *
age: 0
cache-control: max-age=600
content-encoding: gzip
content-type: text/html; charset=utf-8
date: Mon, 13 Oct 2025 14:37:07 GMT
etag: W/"68e952e4-8381"
expires: Mon, 13 Oct 2025 12:34:51 GMT
last-modified: Fri, 10 Oct 2025 18:39:32 GMT
server: Vercel
strict-transport-security: max-age=63072000
vary: Accept-Encoding
via: 1.1 varnish
x-cache: HIT
x-cache-hits: 0
x-fastly-request-id: 186e723e77e28cef0b9145b4e60b58b68fea3558
x-github-request-id: 4E1F:2C78A2:2001A2:26C96C:68ECEF92
x-origin-cache: HIT
x-proxy-cache: MISS
x-robots-tag: index
x-served-by: cache-bom-vanm7210056-BOM
x-timer: S1760366227.487965,VS0,VE281
x-vercel-cache: MISS
x-vercel-id: bom1::q6rxp-1760366227471-8caa21726335
content-length: 6452
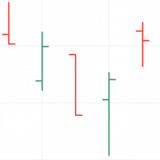
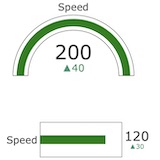
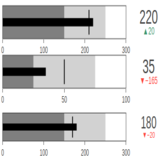
Financial charts in Python


Plotly Python Open Source Graphing Library Financial Charts
Plotly's Python graphing library makes interactive, publication-quality graphs online. Examples of how to make financial charts.
Plotly Studio: Transform any dataset into an interactive data application in minutes with AI. Try Plotly Studio now.