| CARVIEW |
Select Language
HTTP/2 200
accept-ranges: bytes
access-control-allow-origin: *
age: 0
cache-control: max-age=600
content-encoding: gzip
content-type: text/html; charset=utf-8
date: Sun, 12 Oct 2025 18:10:05 GMT
etag: W/"68e952e4-9017"
expires: Sun, 12 Oct 2025 14:01:48 GMT
last-modified: Fri, 10 Oct 2025 18:39:32 GMT
server: Vercel
strict-transport-security: max-age=63072000
vary: Accept-Encoding
via: 1.1 varnish
x-cache: HIT
x-cache-hits: 0
x-fastly-request-id: 40c3f9391f7ed3294f29984a25792162eed8ee81
x-github-request-id: BA52:36702D:14495A:18C618:68EBB26F
x-origin-cache: HIT
x-proxy-cache: MISS
x-robots-tag: index
x-served-by: cache-bom-vanm7210075-BOM
x-timer: S1760292605.430820,VS0,VE328
x-vercel-cache: MISS
x-vercel-id: bom1::kqckj-1760292605414-1255286f3e74
content-length: 6977
3d charts in Python


Plotly Python Open Source Graphing Library 3D Charts
Plotly's Python graphing library makes interactive, publication-quality graphs online. Examples of how to make 3D charts.
Plotly Studio: Transform any dataset into an interactive data application in minutes with AI. Try Plotly Studio now.
-
3D AxesView Tutorial

-
3D Scatter PlotsView Tutorial

-
3D Surface PlotsView Tutorial

-
3D SubplotsView Tutorial

-
3D Camera ControlsView Tutorial
-
3D Bubble ChartsView Tutorial

-
3D Line PlotsView Tutorial
-
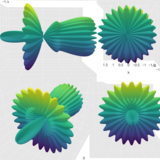
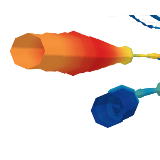
Trisurf PlotsView Tutorial

-
3D Mesh PlotsView Tutorial
-
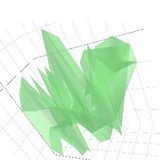
3D Isosurface PlotsView Tutorial
-
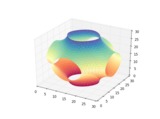
3D Volume PlotsView Tutorial

-
3D Cone PlotsView Tutorial

-
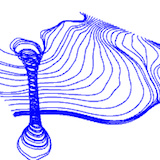
3D Streamtube PlotsView Tutorial
3D Charts in Dash
Dash is the best way to build analytical apps in Python using Plotly figures. To run the app below, run pip install dash, click "Download" to get the code and run python app.py.
Get started with the official Dash docs and learn how to effortlessly style & deploy apps like this with Dash Enterprise.