| CARVIEW |
Select Language
HTTP/2 308
cache-control: public, max-age=0, must-revalidate
content-type: text/plain
date: Wed, 30 Jul 2025 12:39:11 GMT
location: /javascript/scientific-charts/
refresh: 0;url=/javascript/scientific-charts/
server: Vercel
strict-transport-security: max-age=63072000
x-vercel-id: bom1::mbrqf-1753879151359-e7ed6aa0084c
HTTP/2 200
accept-ranges: bytes
access-control-allow-origin: *
age: 0
cache-control: max-age=600
content-encoding: gzip
content-type: text/html; charset=utf-8
date: Wed, 30 Jul 2025 12:39:11 GMT
etag: W/"687e6266-7d16"
expires: Wed, 30 Jul 2025 11:05:13 GMT
last-modified: Mon, 21 Jul 2025 15:53:10 GMT
server: Vercel
strict-transport-security: max-age=63072000
vary: Accept-Encoding
via: 1.1 varnish
x-cache: HIT
x-cache-hits: 0
x-fastly-request-id: 5723380246372eebfd1971d58c2b545922f6692d
x-github-request-id: C032:3A5B8B:169BF9:1A8084:6889FA10
x-origin-cache: HIT
x-proxy-cache: MISS
x-robots-tag: index
x-served-by: cache-bom-vanm7210095-BOM
x-timer: S1753879151.398255,VS0,VE210
x-vercel-cache: MISS
x-vercel-id: bom1::kwv84-1753879151387-7ee6c4c2f6d9
content-length: 6180
Scientific charts in JavaScript


Plotly.js Scientific Charts
Plotly.js makes interactive, publication-quality graphs online. Examples of how to make scientific graphs such as heatmaps and contour plots.
Plotly Studio: Transform any dataset into an interactive data application in minutes with AI. Sign up for early access now.
-
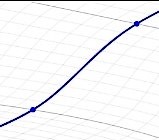
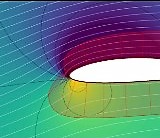
Contour PlotsView Tutorial

-
HeatmapsView Tutorial

-
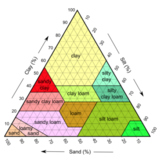
Ternary PlotsView Tutorial
-
Parallel Coordinates PlotView Tutorial

-
Log PlotsView Tutorial

-
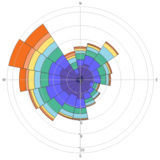
Wind Rose ChartsView Tutorial
-
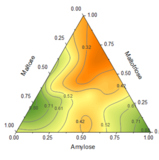
Ternary Contour PlotsView Tutorial
-
Radar ChartsView Tutorial

-
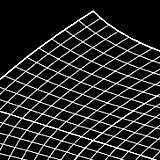
Carpet PlotView Tutorial
-
Carpet Scatter PlotView Tutorial
-
Carpet Contour PlotView Tutorial
-
Polar ChartsView Tutorial
