You signed in with another tab or window. Reload to refresh your session.You signed out in another tab or window. Reload to refresh your session.You switched accounts on another tab or window. Reload to refresh your session.Dismiss alert
A Python Matplotlib, Numpy library to manage wind data, draw windrose (also known as a polar rose plot), draw probability density function and fit Weibull distribution
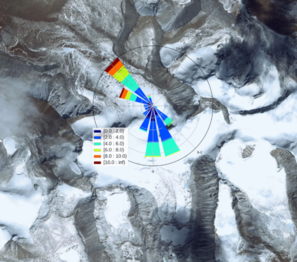
A wind rose is a graphic tool used by meteorologists to give a succinct view of how wind speed and direction are typically distributed at a particular location. It can also be used to describe air quality pollution sources. The wind rose tool uses Matplotlib as a backend. Data can be passed to the package using Numpy arrays or a Pandas DataFrame.
Windrose is a Python library to manage wind data, draw windroses (also known as polar rose plots), and fit Weibull probability density functions.
The initial use case of this library was for a technical report concerning pollution exposure and wind distributions analyzes. Data from local pollution measures and meteorologic information from various sources like Meteo-France were used to generate a pollution source wind rose.
It is also used by some contributors for teaching purpose.
Some academics use it to track lightning strikes during high intensity storms. They are using it to visualize the motion of storms based on the relative position of the lightning from one strike to the next.
A Python Matplotlib, Numpy library to manage wind data, draw windrose (also known as a polar rose plot), draw probability density function and fit Weibull distribution