

Visualkeras is a Python package to help visualize Keras (either standalone or included in tensorflow) neural network architectures. It allows easy styling to fit most needs. This module supports layered style architecture generation which is great for CNNs (Convolutional Neural Networks), and a graph style architecture, which works great for most models including plain feed-forward networks. For help in citing this project, refer here.
If you find this project helpful for your research please consider citing it in your publication as follows.
@misc{Gavrikov2020VisualKeras,
  author = {Gavrikov, Paul and Patapati, Santosh},
  title = {visualkeras},
  year = {2020},
  publisher = {GitHub},
  journal = {GitHub repository},
  howpublished = {\url{https://github.com/paulgavrikov/visualkeras}},
}
| Mode | Sequential | Functional | Subclassed models |
|---|---|---|---|
visualkeras.layered_view() |
yes(1) | partially(1,2) | not tested |
visualkeras.graph_view() |
yes | yes | not tested |
1: Any tensor with more than 3 dimensions will be rendered as 3D tensor with elongated z-axis.
2: Only linear models where each layer has no more than one in or output. Non-linear models will be shown in sequential order.
We currently only support Keras versions 2 and above. We plan to add support for Keras version 1 in the coming updates.
To install published releases from PyPi (last updated: July 19, 2024) execute:
pip install visualkerasTo update visualkeras to the latest version, add the --upgrade flag to the above commands.
If you want the latest (potentially unstable) features you can also directly install from the github master branch:
pip install git+https://github.com/paulgavrikov/visualkerasGenerating neural network architectures is easy:
import visualkeras
model = ...
visualkeras.layered_view(model).show() # display using your system viewer
visualkeras.layered_view(model, to_file='output.png') # write to disk
visualkeras.layered_view(model, to_file='output.png').show() # write and show
To help understand some of the most important parameters we are going to use a VGG16 CNN architecture (see example.py).
visualkeras.layered_view(model)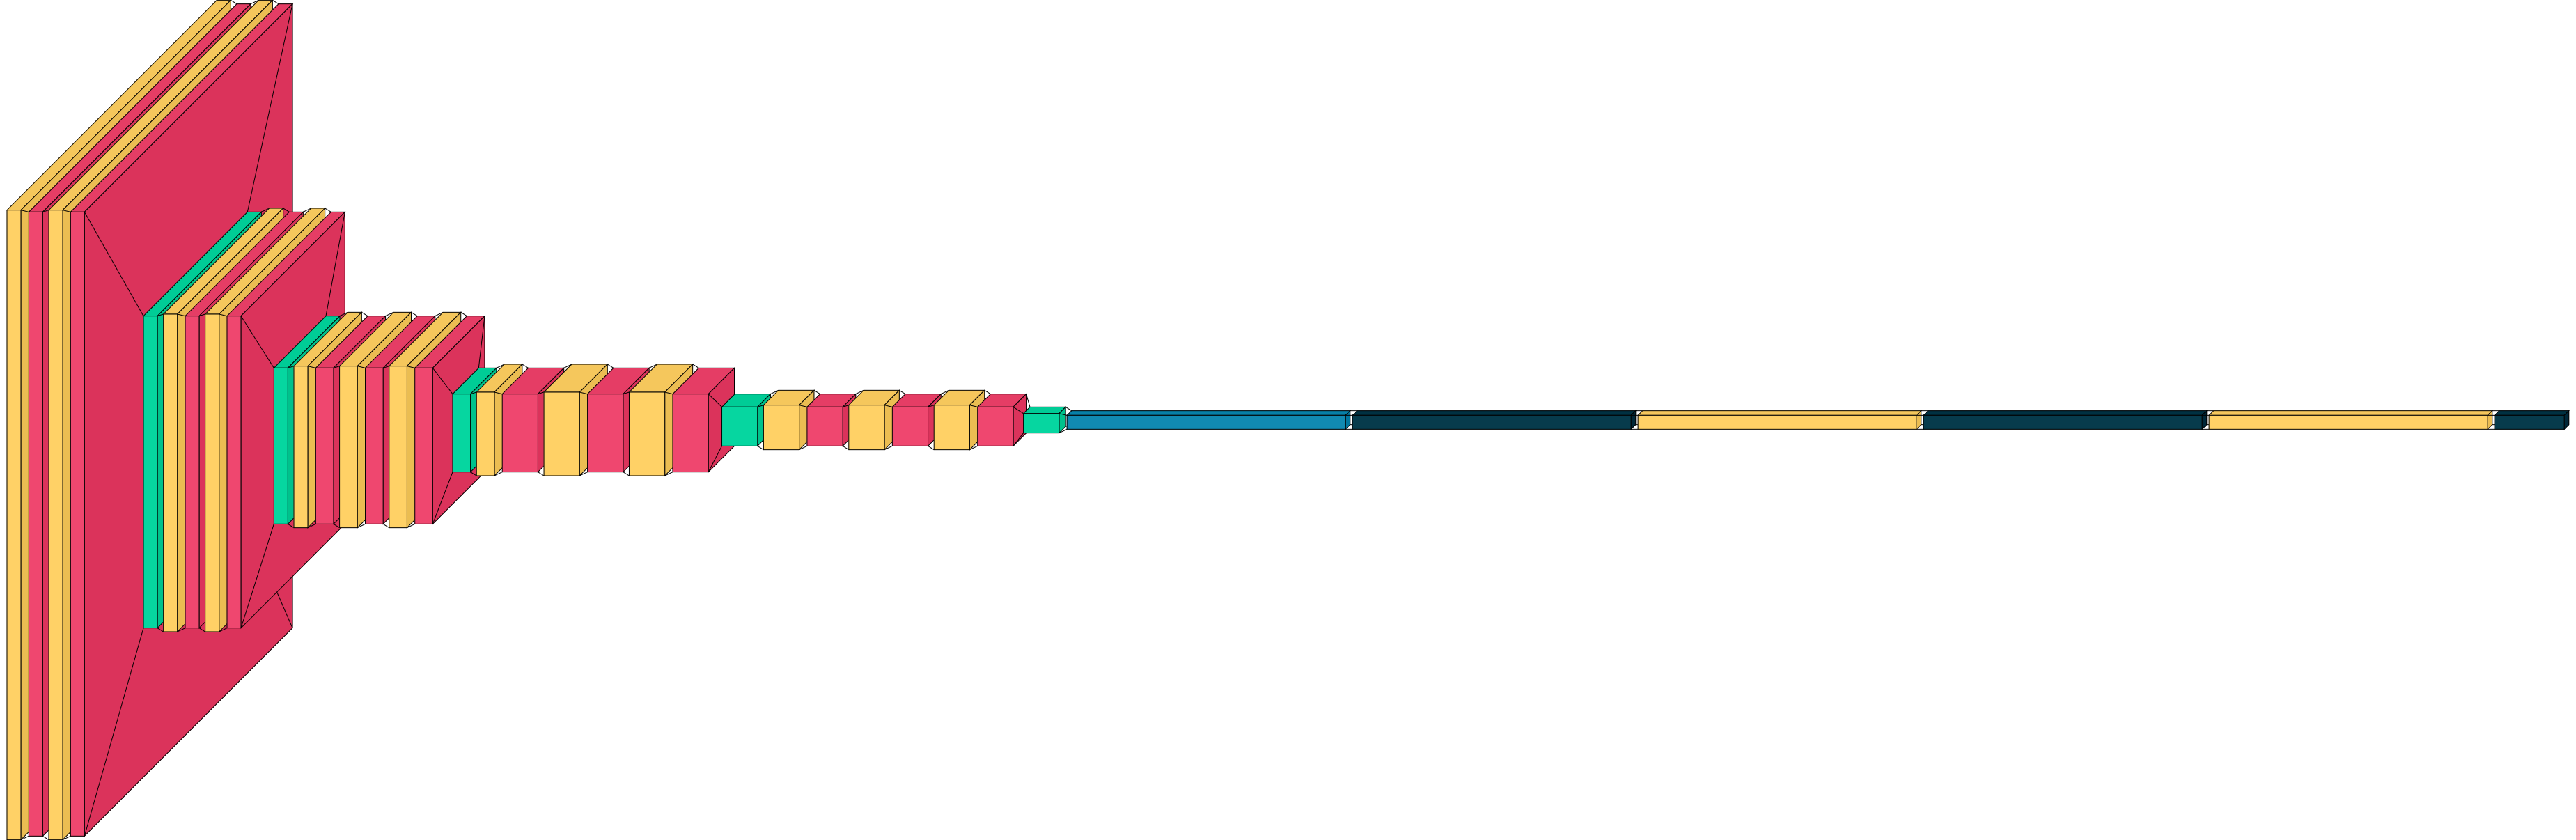
You can set the legend parameter to describe the relationship between color and layer types. It is also possible to pass
a custom PIL.ImageFont to use (or just leave it out and visualkeras will use the default PIL font). Please note that
you may need to provide the full path of the desired font depending on your OS.
from PIL import ImageFont
font = ImageFont.truetype("arial.ttf", 32)  # using comic sans is strictly prohibited!
visualkeras.layered_view(model, legend=True, font=font)  # font is optional!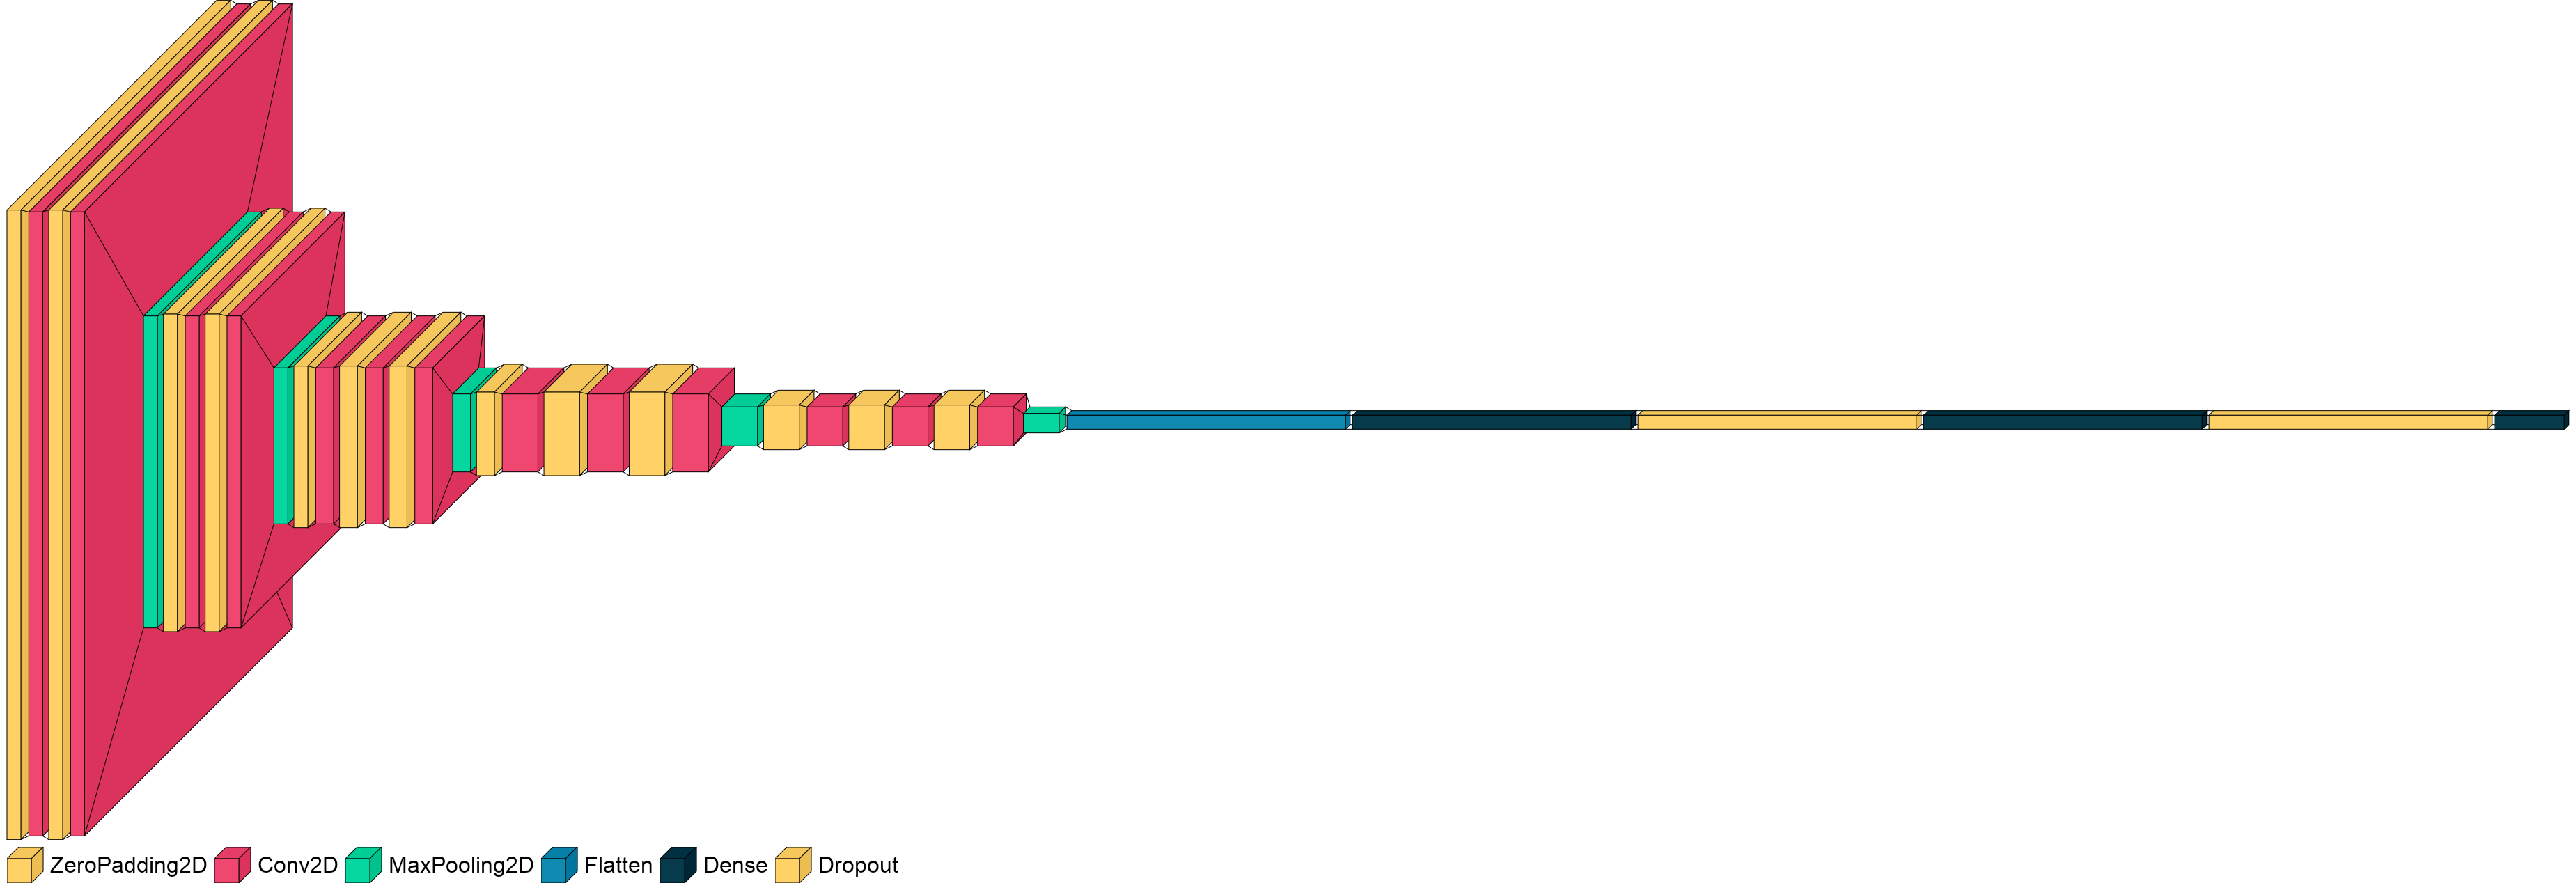
visualkeras.layered_view(model, draw_volume=False)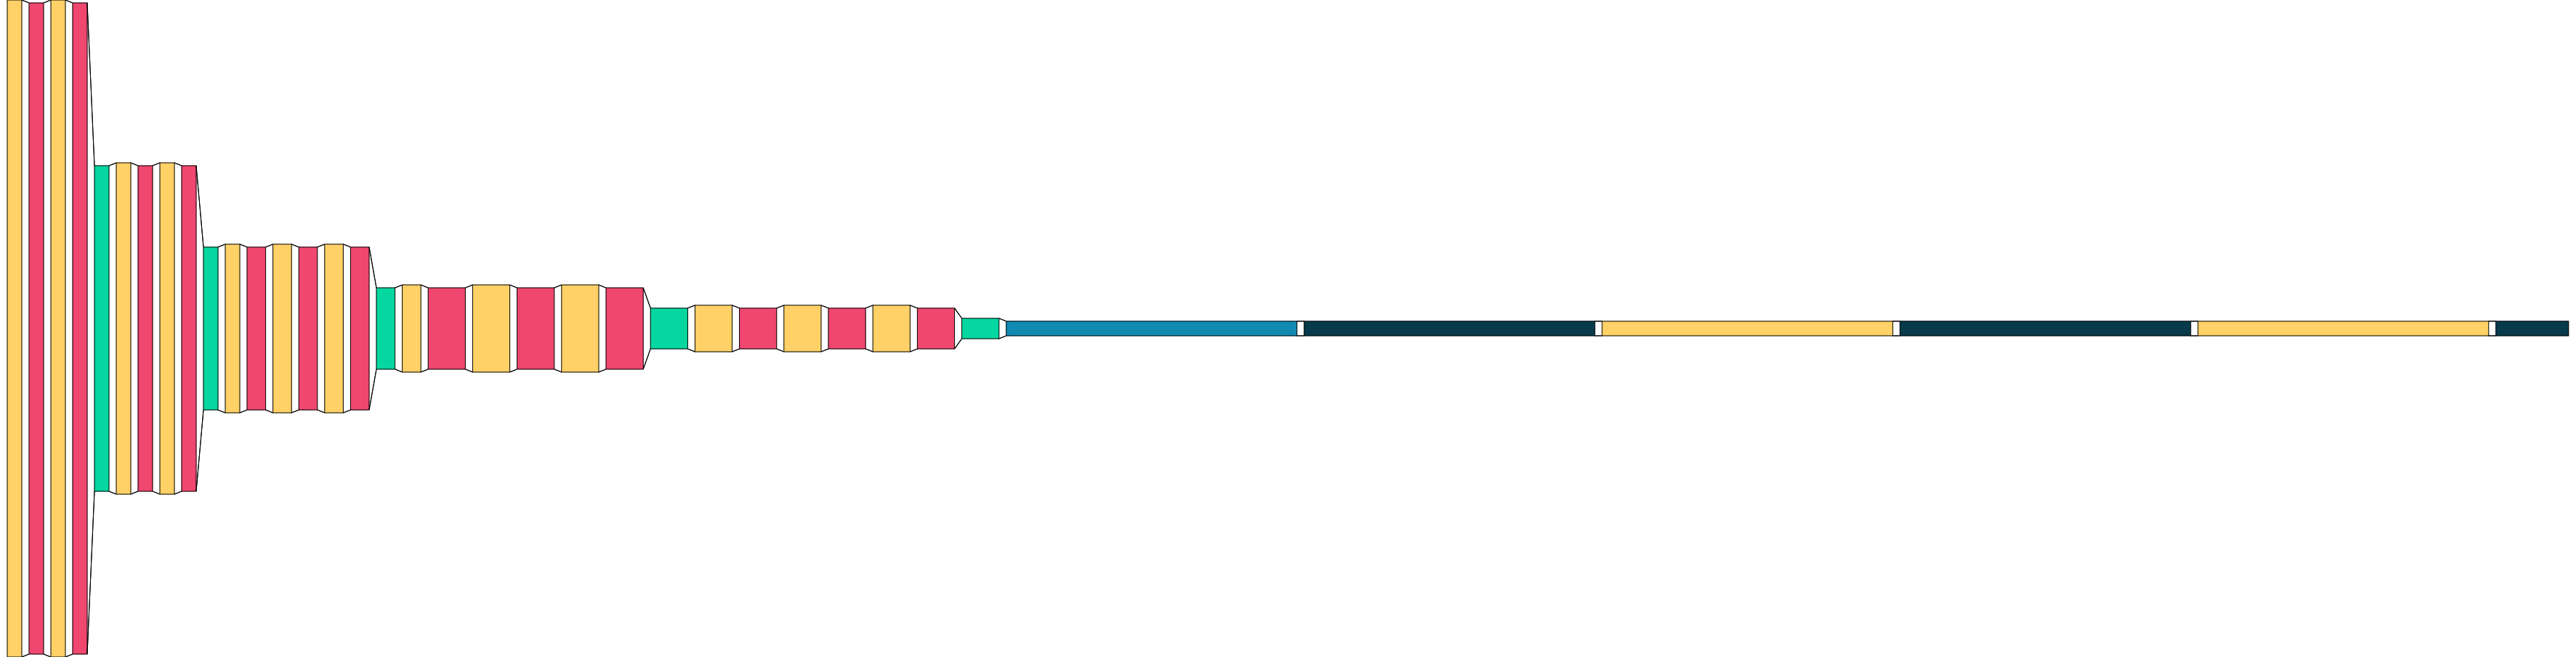
The global distance between two layers can be controlled with spacing. To generate logical groups a special dummy
keras layer visualkeras.SpacingDummyLayer() can be added.
model = ...
...
model.add(visualkeras.SpacingDummyLayer(spacing=100))
...
visualkeras.layered_view(model, spacing=0)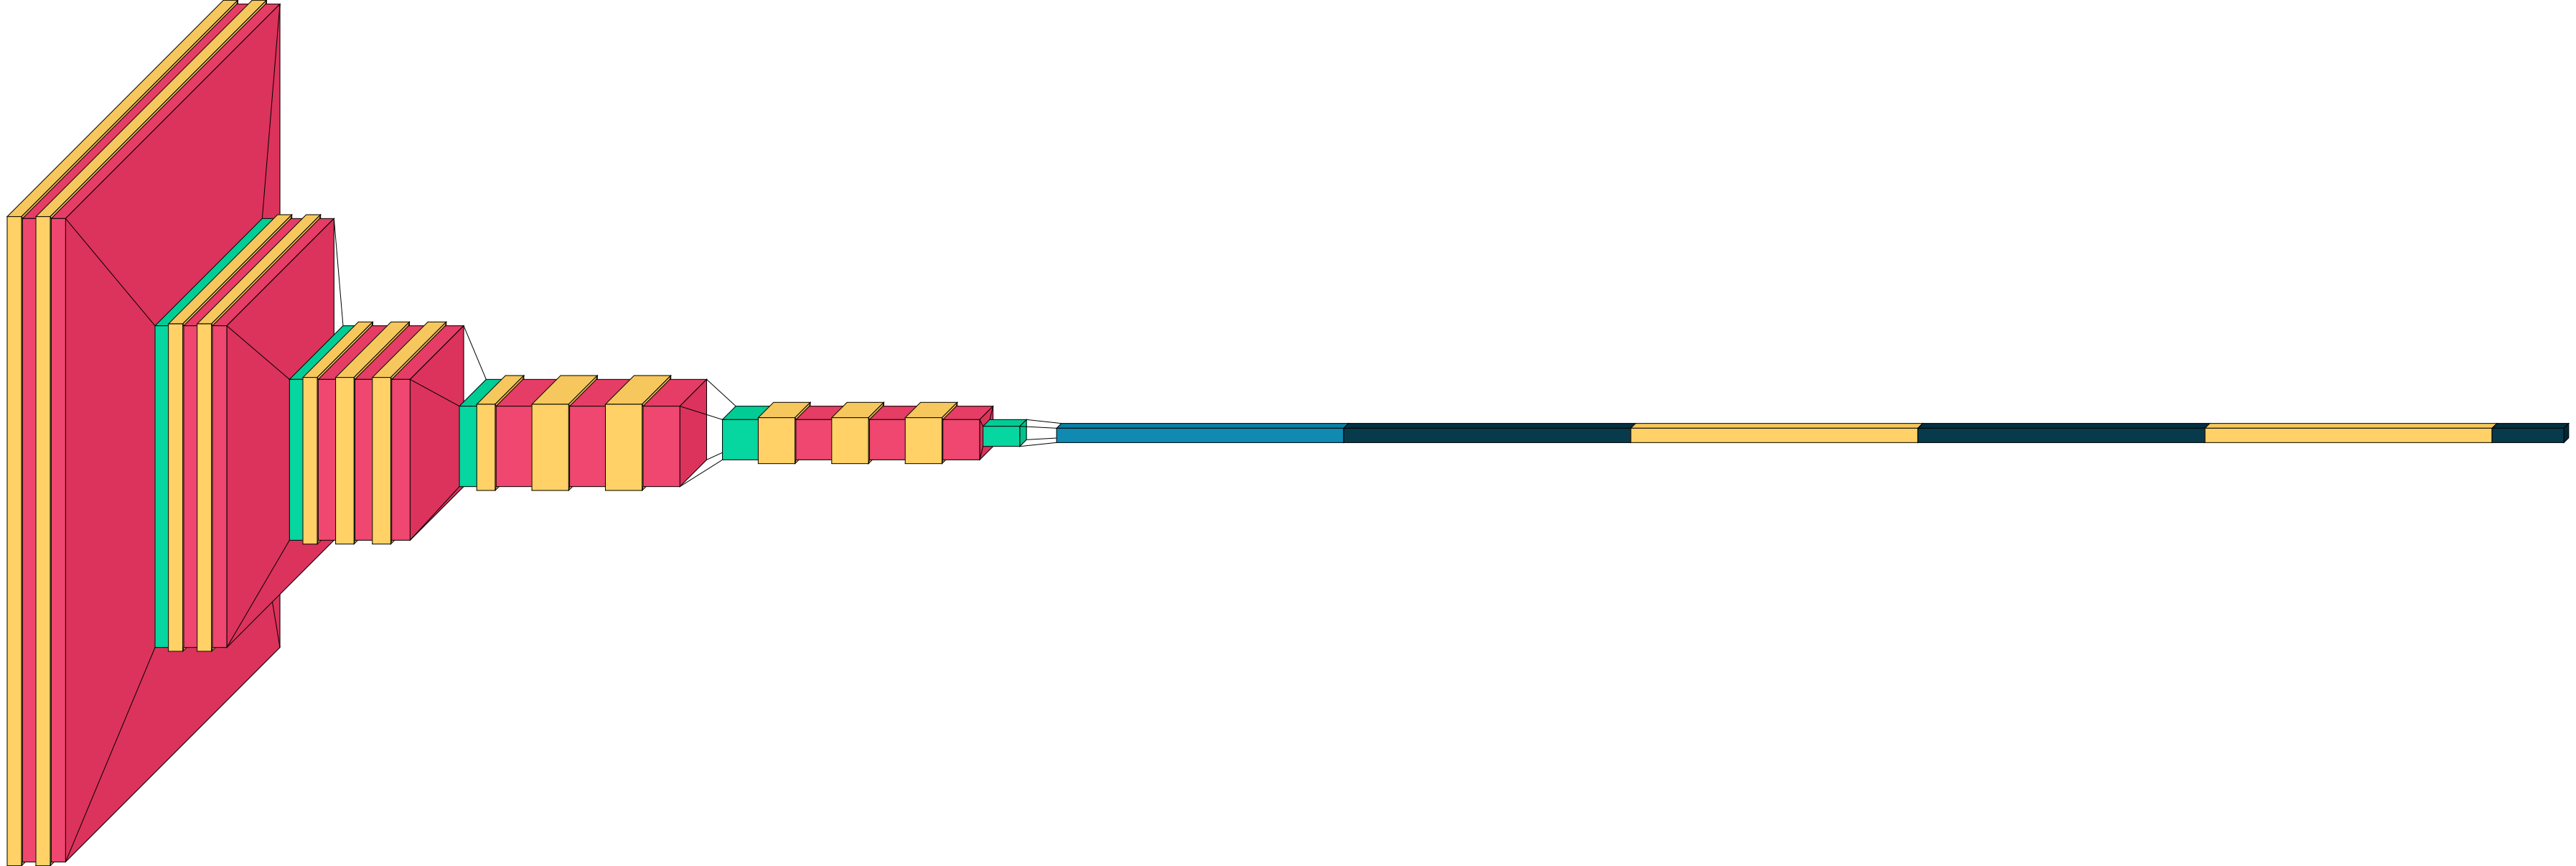
It is possible to provide a custom color map for fill and outline per layer type.
from tensorflow.python.keras.layers import Dense, Conv2D, Flatten, Dropout, MaxPooling2D, ZeroPadding2D
from collections import defaultdict
color_map = defaultdict(dict)
color_map[Conv2D]['fill'] = 'orange'
color_map[ZeroPadding2D]['fill'] = 'gray'
color_map[Dropout]['fill'] = 'pink'
color_map[MaxPooling2D]['fill'] = 'red'
color_map[Dense]['fill'] = 'green'
color_map[Flatten]['fill'] = 'teal'
visualkeras.layered_view(model, color_map=color_map)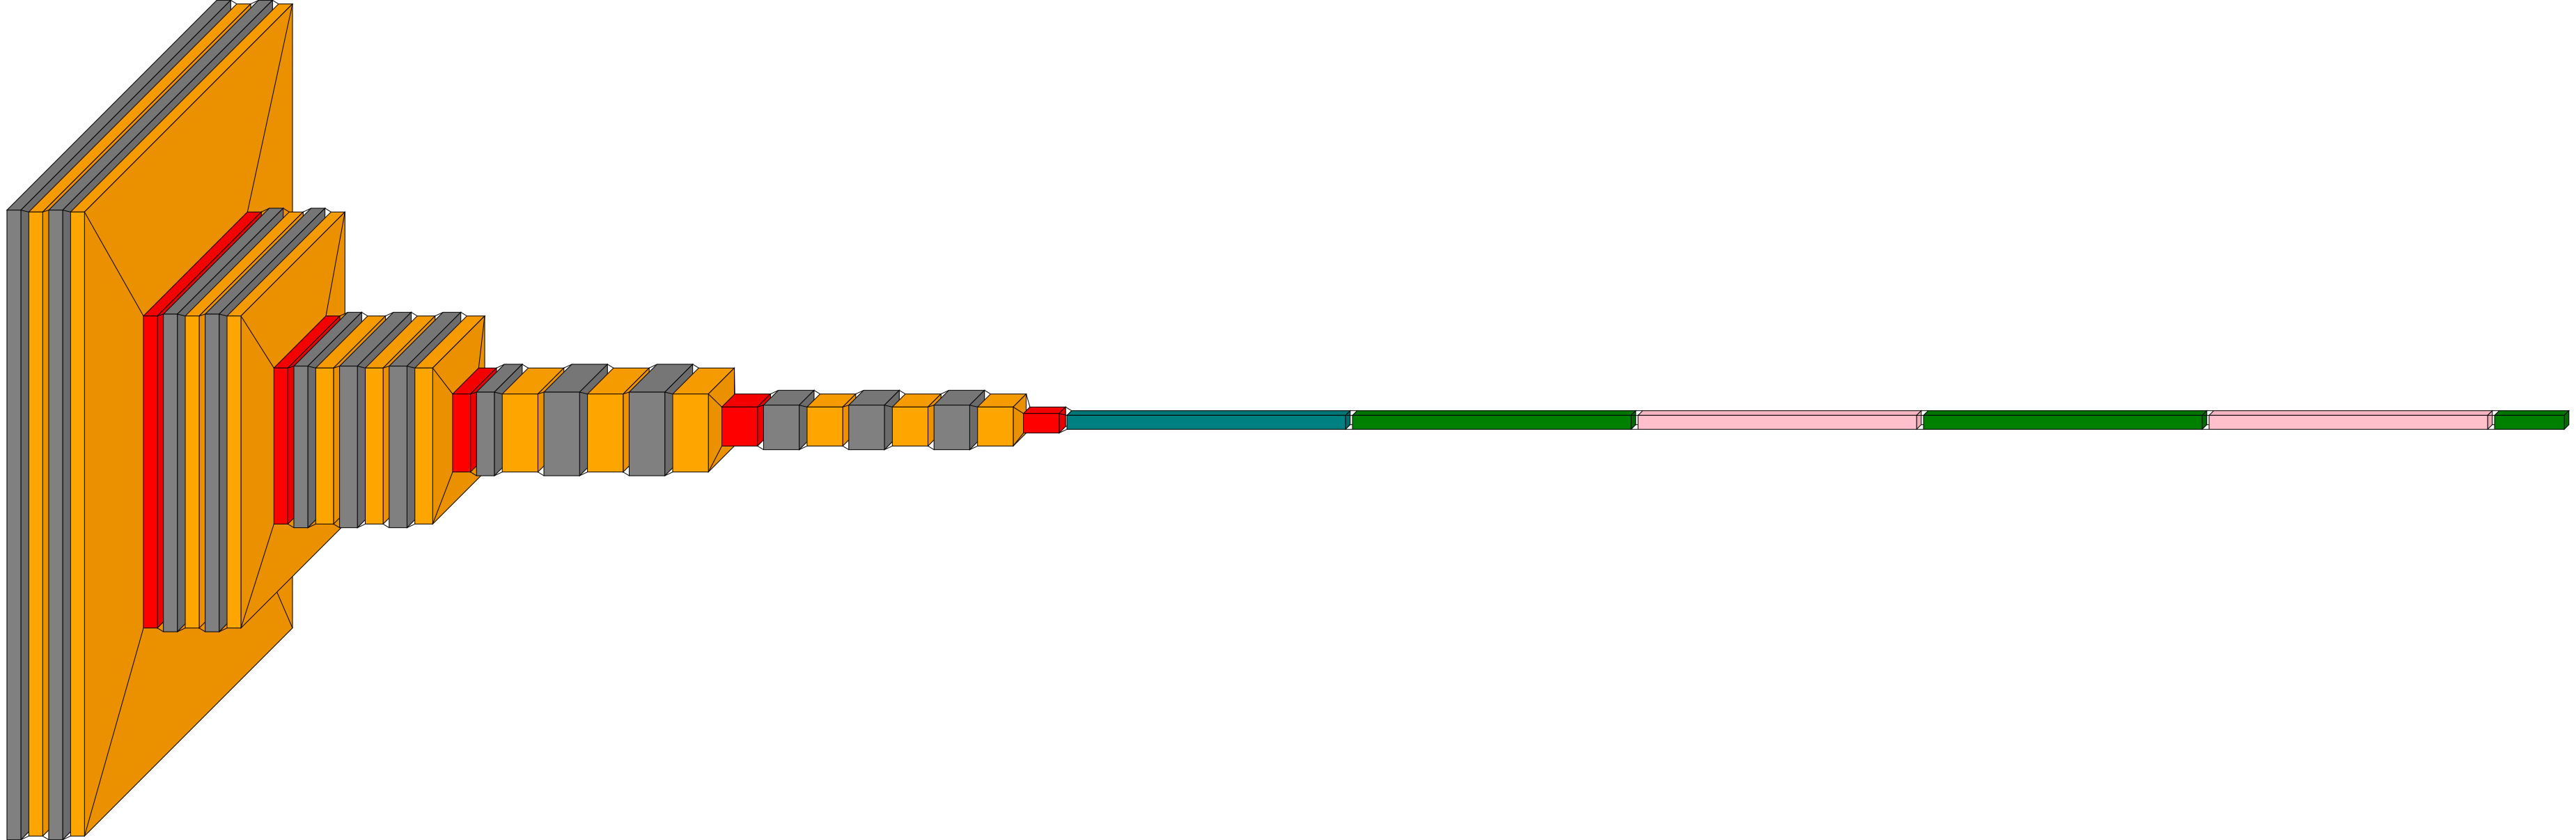
Some models may consist of too many layers to visualize or to comprehend the model. In this case it can be helpful to
hide (ignore) certain layers of the keras model without modifying it. Visualkeras allows ignoring layers by their type
(type_ignore) or index in the keras layer sequence (index_ignore).
visualkeras.layered_view(model, type_ignore=[ZeroPadding2D, Dropout, Flatten])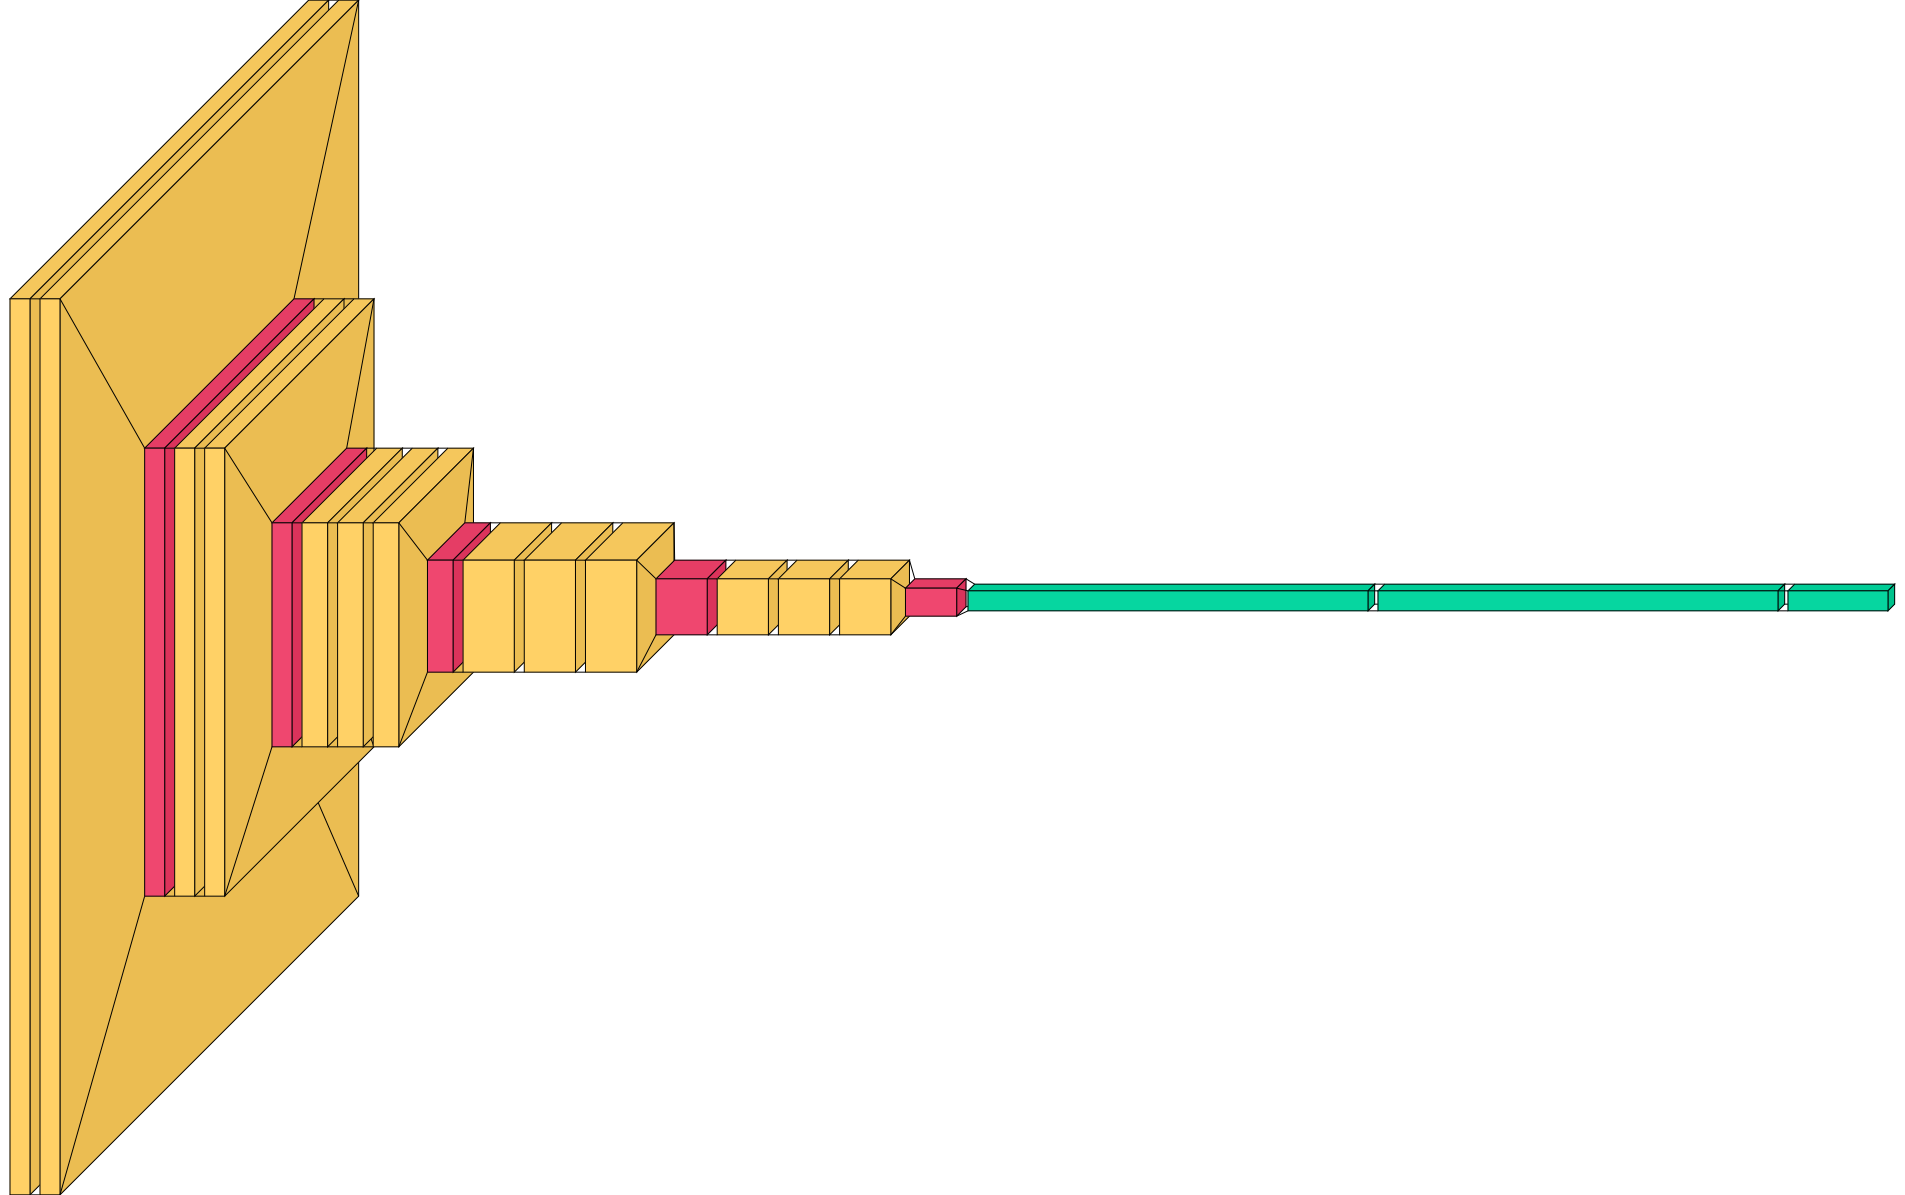
Visualkeras computes the size of each layer by the output shape. Values are transformed into pixels. Then, scaling is
applied. By default visualkeras will enlarge the x and y dimension and reduce the size of the z dimensions as this has
deemed visually most appealing. However, it is possible to control scaling using scale_xy and scale_z. Additionally,
to prevent to small or large options minimum and maximum values can be set (min_xy, min_z, max_xy, max_z).
visualkeras.layered_view(model, scale_xy=1, scale_z=1, max_z=1000) Note: Scaled models may hide the true complexity of a layer, but are visually more appealing.
Visualkeras provides multiple sizing strategies to handle different model architectures and visualization needs. You can control this behavior using the sizing_mode parameter:
Accurate mode (default): Uses actual layer dimensions with scaling
visualkeras.layered_view(model, sizing_mode='accurate')
Balanced mode: Smart scaling that balances accuracy with visual clarity
visualkeras.layered_view(model, sizing_mode='balanced')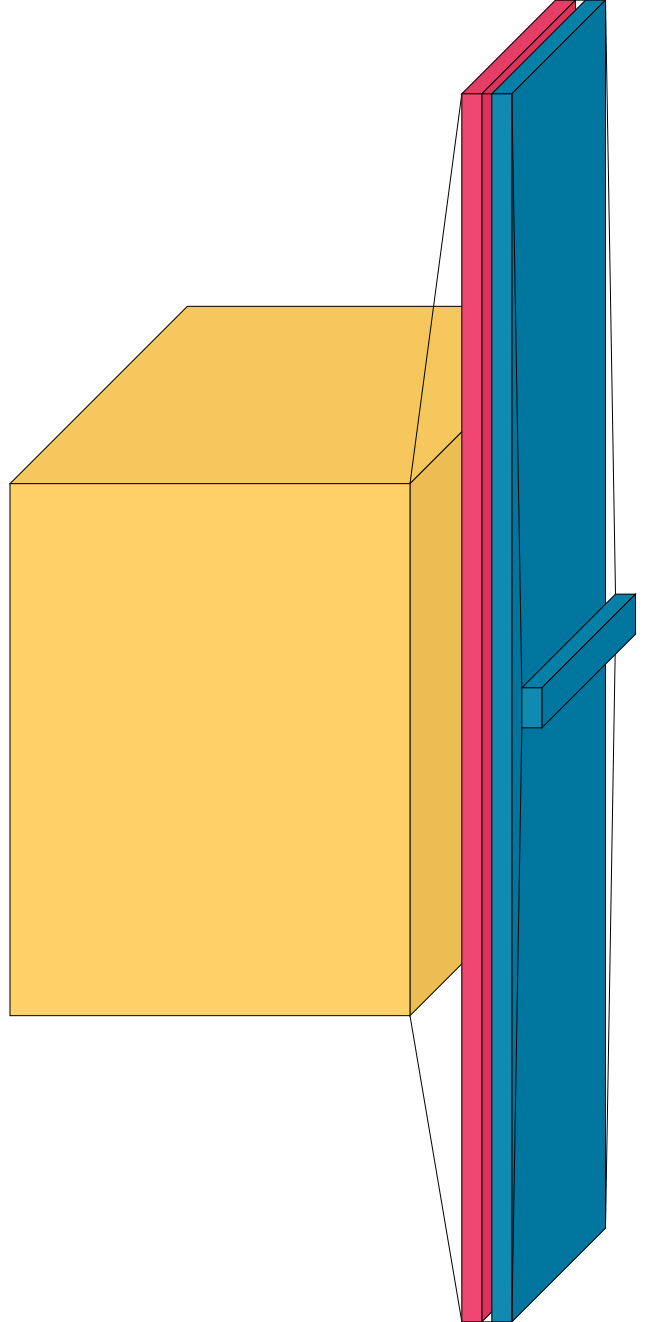
Capped mode: Caps dimensions at specified limits while preserving ratios
visualkeras.layered_view(model, sizing_mode='capped', dimension_caps={'channels': 200, 'sequence': 1000, 'general': 400})Here, dimension_caps is a dictionary that allows you to set maximum sizes for different dimensions:
channels: Maximum size for channel dimensions (default: max_z)sequence: Maximum size for sequence/spatial dimensions (default: max_xy)general: Maximum size for other dimensions (default: max(max_z, max_xy))
Logarithmic mode: Uses logarithmic scaling for very large dimensions
visualkeras.layered_view(model, sizing_mode='logarithmic')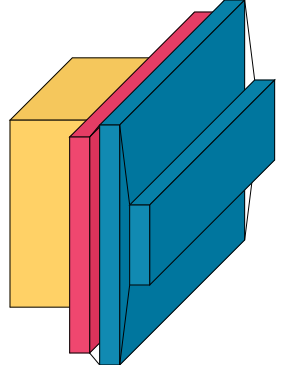
Relative mode: Proportional scaling where each layer's visual size is directly proportional to its dimension count, but scaled by a base size factor.
# Create a model with decreasing layer sizes for demonstration
model = tf.keras.Sequential([
    tf.keras.layers.Dense(64, input_shape=(100,)),  # Will be largest
    tf.keras.layers.Dense(32),                      # Half the size of previous
    tf.keras.layers.Dense(16),                      # Half the size of previous
    tf.keras.layers.Dense(8)                        # Half the size of previous
])
# Each layer will be visually proportional to its actual size
visualkeras.layered_view(model, sizing_mode='relative', relative_base_size=10)
In relative mode, if one layer has 64 units and the next has 32 units, the second layer will be exactly half the visual height of the first. The relative_base_size parameter controls the base scaling factor which represents the visual size (in pixels) that a dimension of size 1 would have. For example:
relative_base_size=5: A 64-unit layer gets 320 pixels, a 32-unit layer gets 160 pixelsrelative_base_size=20: A 64-unit layer gets 1280 pixels, a 32-unit layer gets 640 pixels
Comparison Example: Using a model with layers of sizes 64→32→16→8:
- Accurate mode: May show all layers at similar visual sizes (depending on scaling)
- Relative mode with base_size=10: Shows layers at 640→320→160→80 pixels (true proportional scaling)
Below is an example visualization of a different model using the relative sizing mode:
With the text_callable argument a function can be passed to the layered_view function which can be used to draw text below or above a specific layer. The function should have to following properties:
-
Accepts two arguments: First the index of the layer in the model. This index ignores layers listed in
type_ignore,index_ignoreand also ignores layers of classSpacingDummyLayer. The second arguments is the layer object used in the model at the index given in the first argument -
Returns two arguments: The first return value is a string containing the text to be drawn. The second return value is a bool value indicating if the text is to be drawn above the box representing the layer.
The following function aims to describe the names of layers and their dimensionality. It would produce the output shown in the figure below:
def text_callable(layer_index, layer):
    # Every other piece of text is drawn above the layer, the first one below
    above = bool(layer_index%2)
    # Get the output shape of the layer
    if hasattr(layer, 'output_shape'):
        # ───────────────────────────────
        # Legacy Keras (standalone 2.x) or TF-Keras <2.11
        # ───────────────────────────────
        # this will work so long as `layer.output_shape` exists
        output_shape = [x for x in list(layer.output.shape) if x is not None]
    else:
        # ───────────────────────────────
        # Modern TF-Keras (>= 2.11) – attribute removed
        # ───────────────────────────────
        output_shape = layer.output.shape.as_list()
    # If the output shape is a list of tuples, we only take the first one
    if isinstance(output_shape[0], tuple):
        output_shape = list(output_shape[0])
        output_shape = [x for x in output_shape if x is not None]
    # Variable to store text which will be drawn
    output_shape_txt = ""
    # Create a string representation of the output shape
    for ii in range(len(output_shape)):
        output_shape_txt += str(output_shape[ii])
        if ii < len(output_shape) - 2: # Add an x between dimensions, e.g. 3x3
            output_shape_txt += "x"
        if ii == len(output_shape) - 2: # Add a newline between the last two dimensions, e.g. 3x3 \n 64
            output_shape_txt += "\n"
    # Add the name of the layer to the text, as a new line
    output_shape_txt += f"\n{layer.name}"
    # Return the text value and if it should be drawn above the layer
    return output_shape_txt, above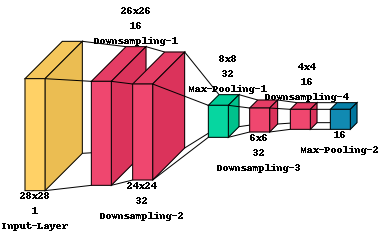
Note: Use the padding argument to avoid long text being cut off at the left or right edge of the image. Also use SpacingDummyLayers to avoid interleaving text of different layers.
In certain use cases, it may be useful to reverse the view of the architecture so we look at the back of each layer. For example, when visualizing a decoder-like architecture. In such cases, we can switch draw_reversed to True. The following two figures show the same model with draw_reversed set to False and True, respectively.
visualkeras.layered_view(model, draw_reversed=False) # Default behavior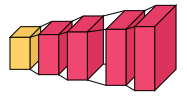
visualkeras.layered_view(model, draw_reversed=True)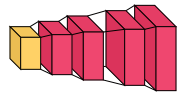
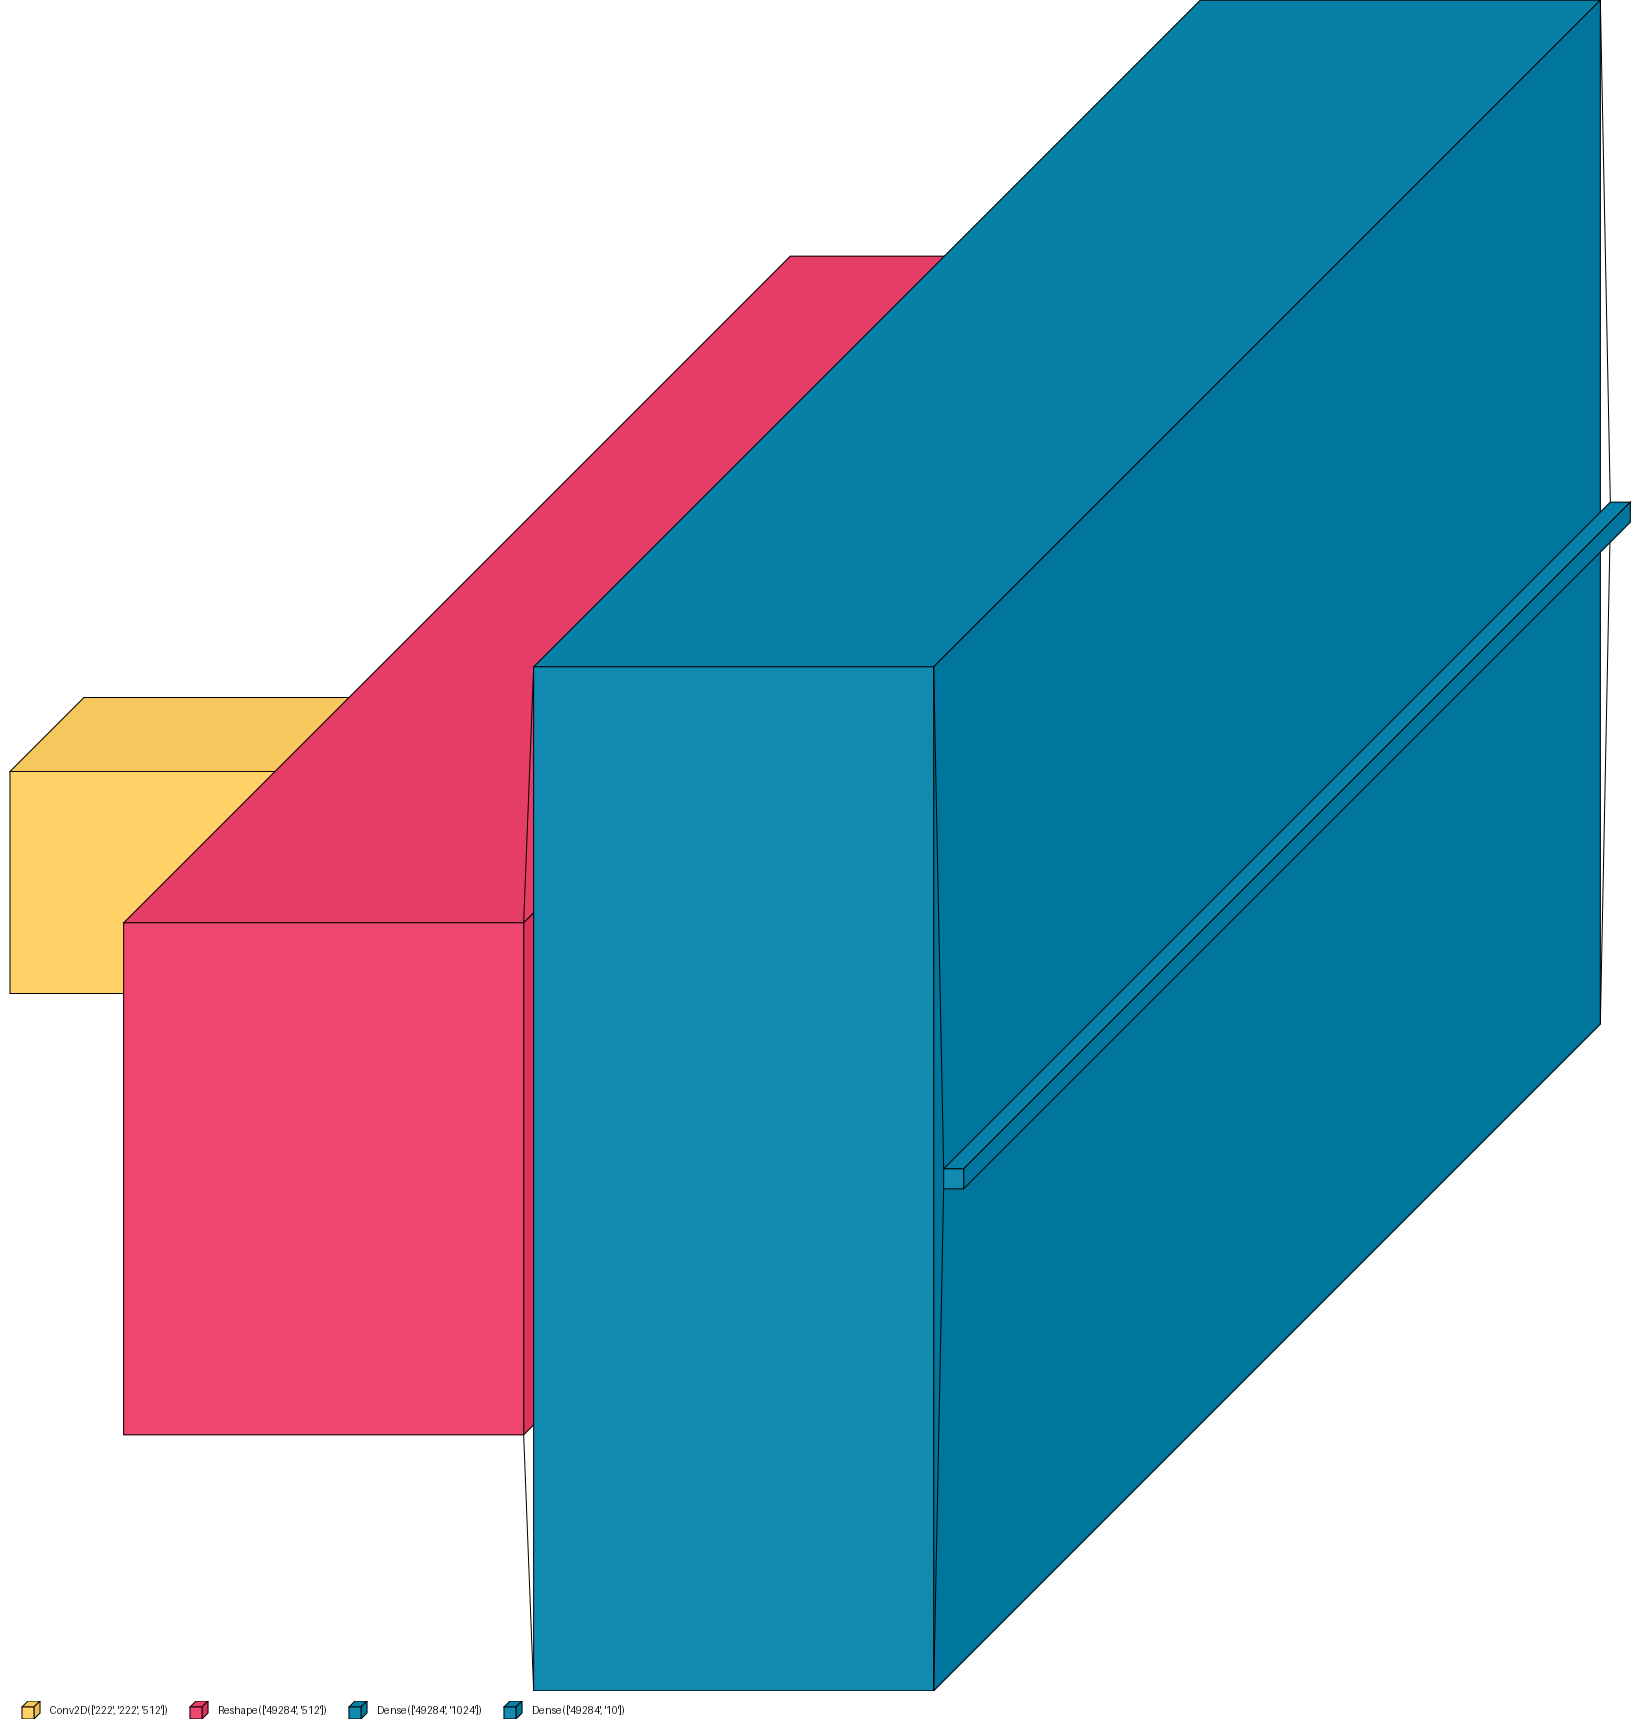
It is possible to display layer dimensions in the legend. To do so, set legend=True and show_dimension=True in layered_view. This is a simpler alternative to creating a callable for the text_callable argument to display dimensions above or below each layer.
visualkeras.layered_view(model, legend=True, show_dimension=True)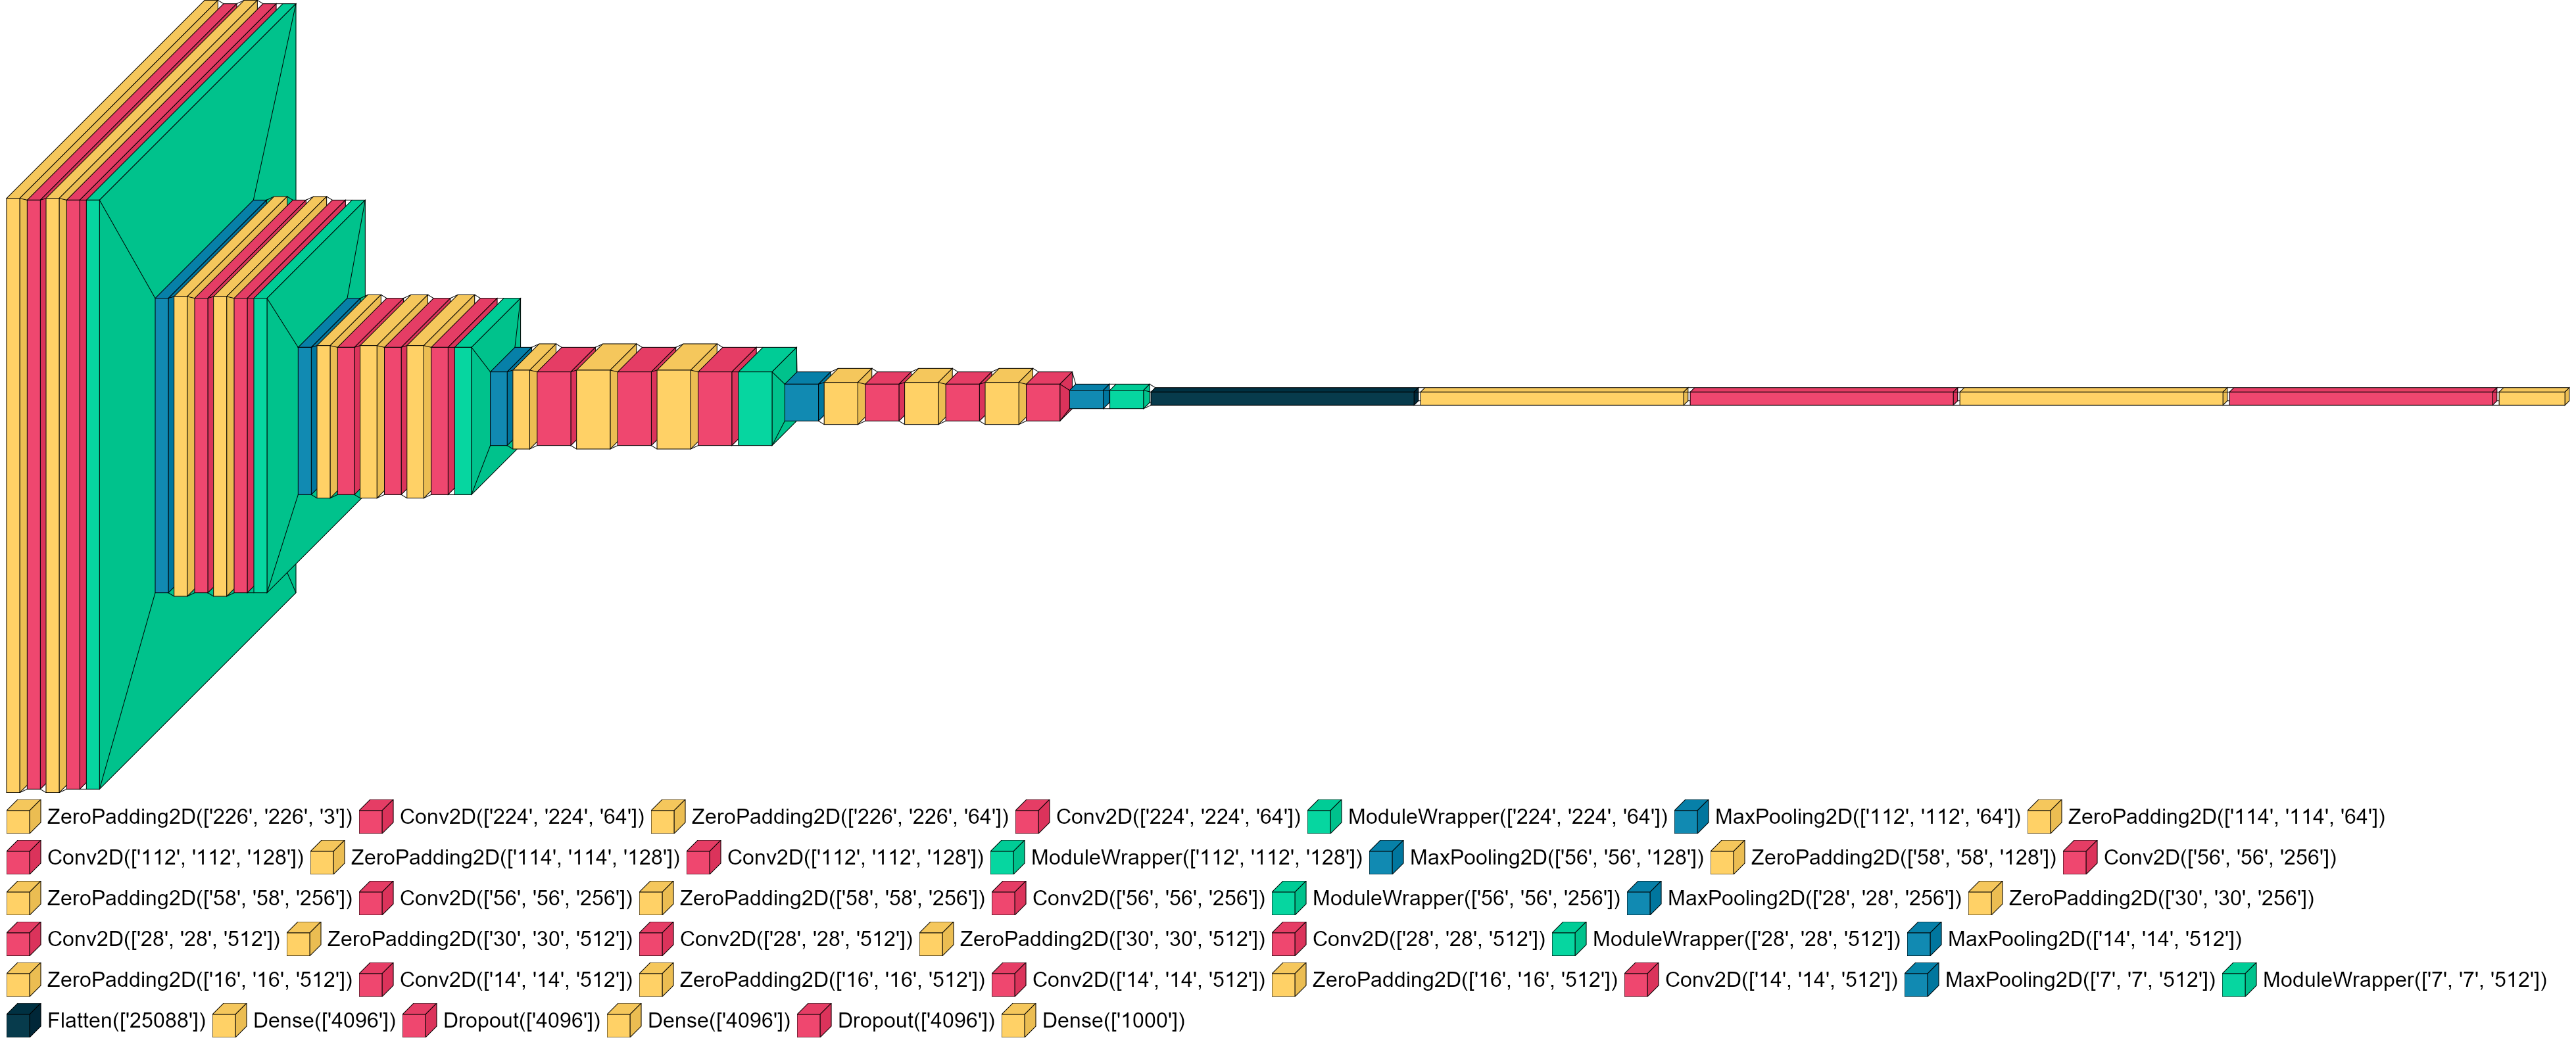
The main branch may be ahead of pypi. Consider upgrading to the latest (perhaps unstable) build as discussed in Installation.
This is most likely due to missing gcc / g++ components (e.g. on Elementary OS). Try installing them via your package manager, e.g.:
sudo apt-get install gcc
sudo apt-get install g++You have probably not configured your default image viewer. You can install imagemagick via most package managers:
sudo apt-get install imagemagickThese are features we plan to add in the future. If you're up for it, open an issue about a feature and code up a PR to add it!
- Multi-modal model support
- ResNet visualizations
- LeNet-style basic sequential visualizations
- Concatenation visualizations
- More professional and academic visualizations for
graph_view(example) - Annotate repeated layers or blocks (e.g., overarching double-arrow line w/ "3x" over it)
- Automated testing with GitHub actions