You signed in with another tab or window. Reload to refresh your session.You signed out in another tab or window. Reload to refresh your session.You switched accounts on another tab or window. Reload to refresh your session.Dismiss alert
You can install via Homebrew with the follow command:
$ brew install mgartner/tap/pg_flame
Download pre-compiled binary
Download one of the compiled binaries in the releases
tab. Once downloaded, move
pg_flame into your $PATH.
Docker
Alternatively, if you'd like to use Docker to build the program, you can.
$ docker pull mgartner/pg_flame
Build from source
If you'd like to build a binary from the source code, run the following
commands. Note that compiling requires Go version 1.13+.
$ git clone https://github.com/mgartner/pg_flame.git
$ cd pg_flame
$ go build
A pg_flame binary will be created that you can place in your $PATH.
Usage
The pg_flame program reads a JSON query plan from standard input and writes
the flamegraph HTML to standard ouput. Therefore you can pipe and direct input
and output however you desire.
Example: One-step
$ psql dbname -qAtc 'EXPLAIN (ANALYZE, BUFFERS, FORMAT JSON) SELECT id FROM users' \
    | pg_flame \
    > flamegraph.html \
    && open flamegraph.html
Example: Multi-step with SQL file
Create a SQL file with the EXPLAIN ANALYZE query.
-- query.sql
EXPLAIN (ANALYZE, BUFFERS, FORMAT JSON)
SELECT id
FROM users
Then run the query and save the JSON to a file.
$ psql dbname -qAtf query.sql > plan.json
Finally, generate the flamegraph HTML.
$ cat plan.json | pg_flame > flamegraph.html
Example: Docker
If you've followed the Docker installation steps above, you can pipe query plan
JSON to a container and save the output HTML.
$ psql dbname -qAtc 'EXPLAIN (ANALYZE, BUFFERS, FORMAT JSON) SELECT id FROM users' \
    | docker run -i pg_flame \
    > flamegraph.html
Background
Flamegraphs were invented by
Brendan Gregg to visualize CPU consumption per code-path of profiled software.
They are useful visualization tools in many types of performance
investigations. Flamegraphs have been used to visualize Oracle database
query
plans
and query
executions
, proving useful for debugging slow database queries.
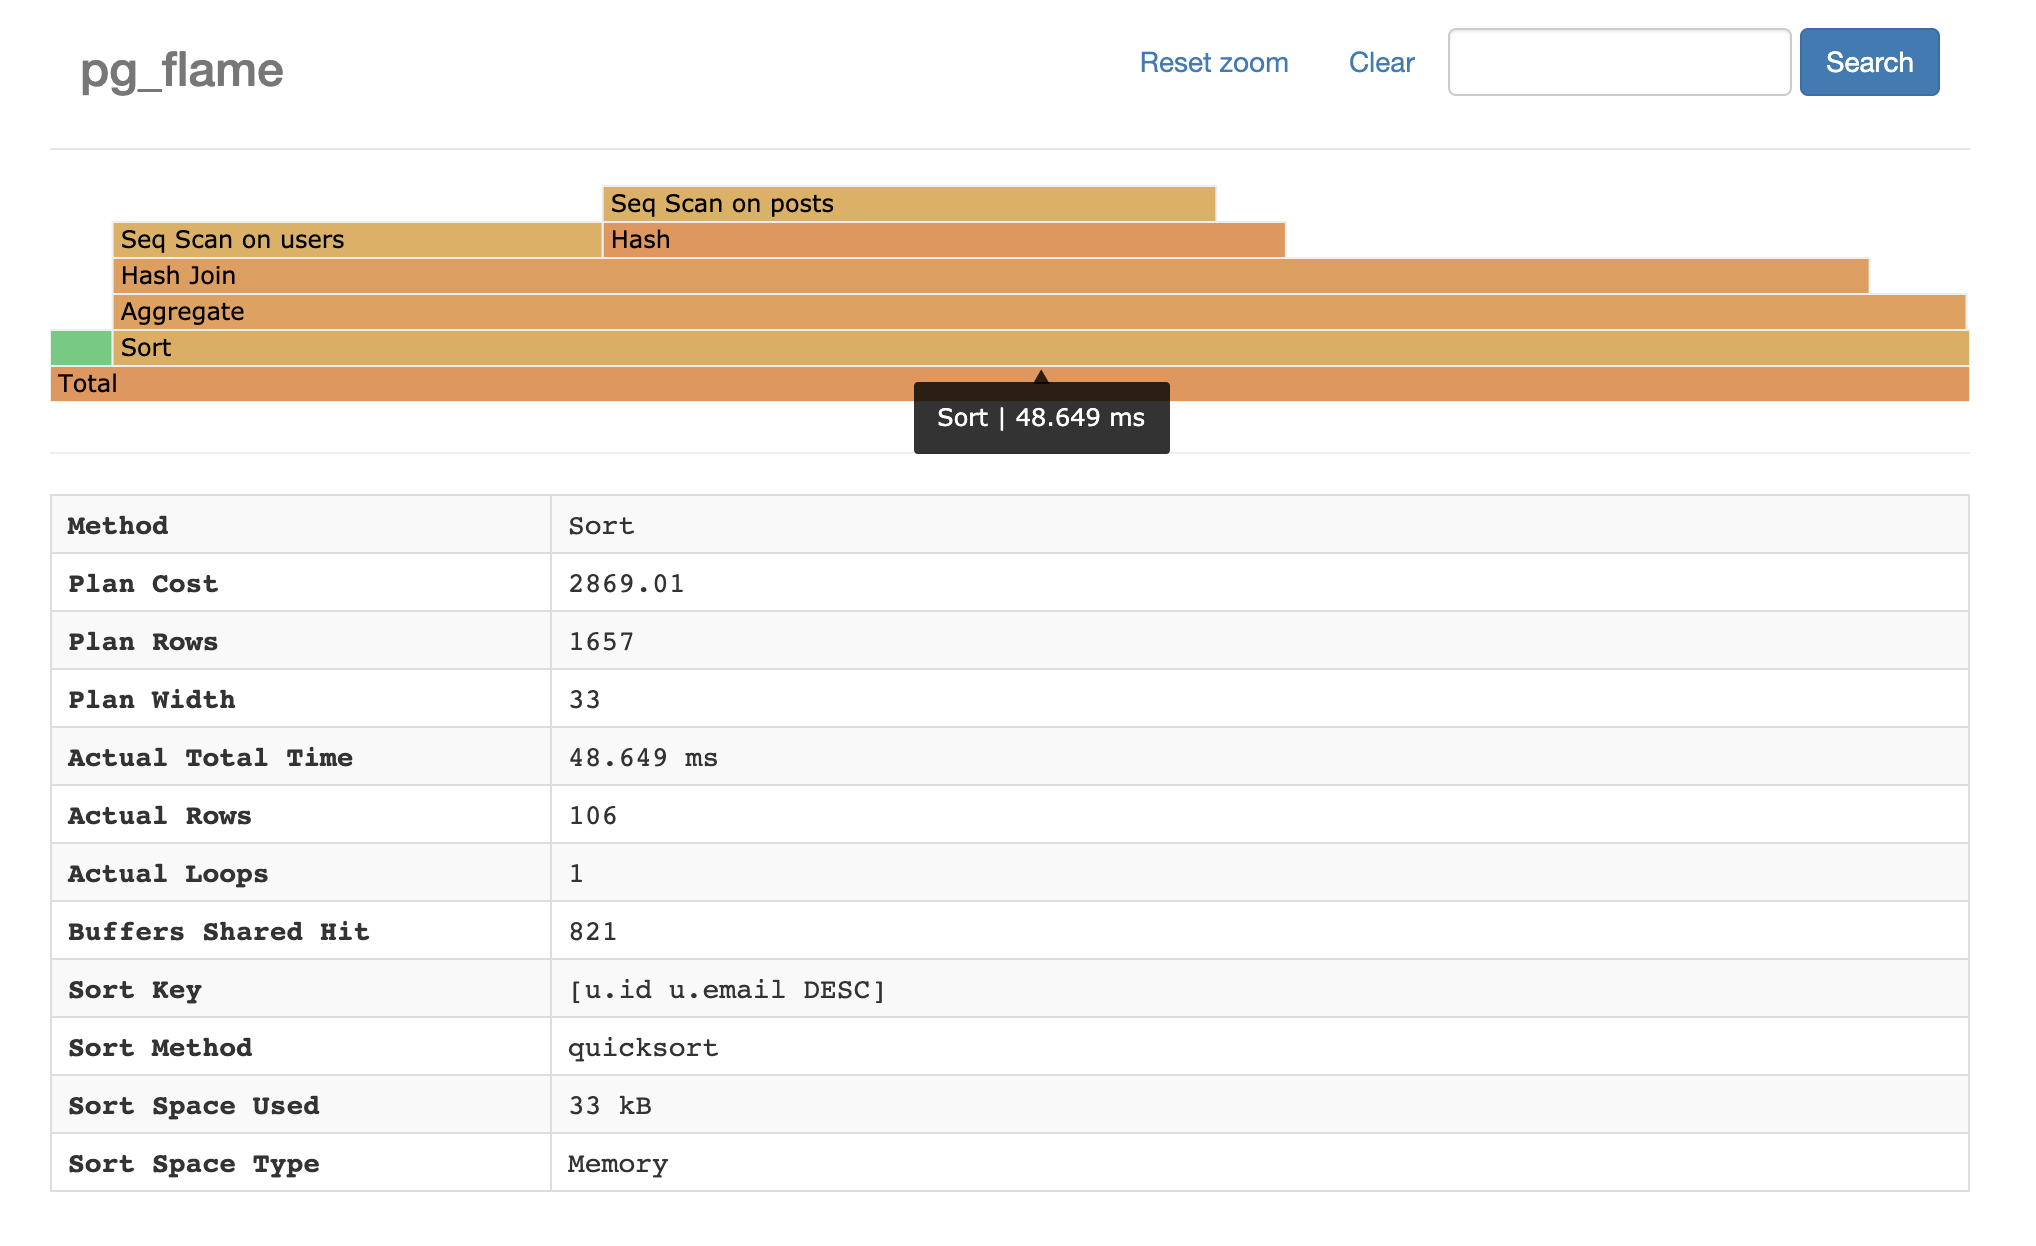
Pg_flame is in extension of that work for Postgres query plans. It generates a
visual hierarchy of query plans. This visualization identifies the relative
time of each part of a query plan.