You signed in with another tab or window. Reload to refresh your session.You signed out in another tab or window. Reload to refresh your session.You switched accounts on another tab or window. Reload to refresh your session.Dismiss alert
Smashing widget to monitor the status of Hosts and Services from Nagios XI.
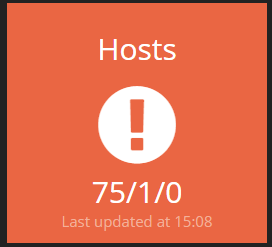
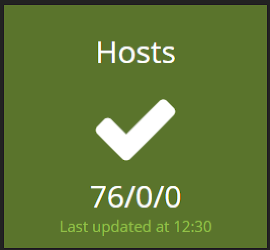
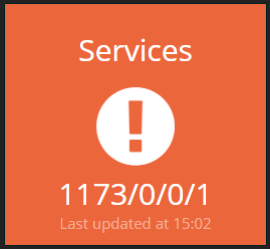
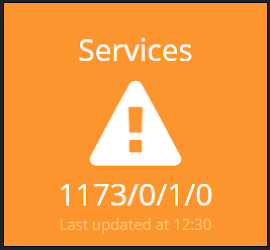
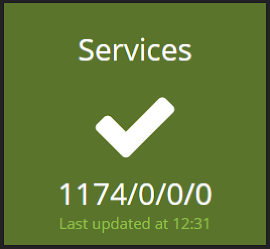
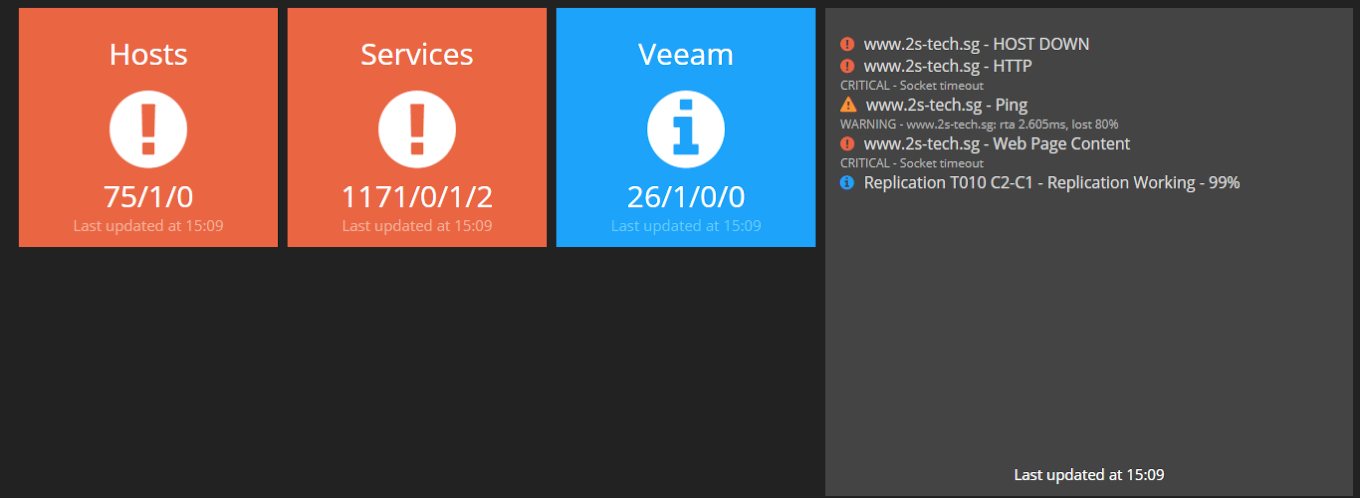
The numbers in the tiles represent the following:
Hosts: OK/DOWN/UNREACHABLE
Services: OK/UNKNOWN/WARNING/CRITICAL
Example
Installation and Configuration
This widget uses rest-client and json. make sure to add them in your dashboard Gemfile
gem 'rest-client'
gem 'json'
and to run the update command to download and install them.
$ bundle update
Create a nagiosxi folder in your /widgets directory and clone this repository inside it. make a symolic link of the file jobs/nagiosxi.rb in the /jobs/ directory of your dashboard. For example, if your smashing installation directory is in /opt/dashboard/ you would run this:
Since this widget only displays the status of the Services and Hosts, I had the need to visualize the details in case the status was not OK. The nagiosxi.rb job is setup in a way to send detailed information to the widget Messages I developed to organize "messages" of other widgets in a single box.