You signed in with another tab or window. Reload to refresh your session.You signed out in another tab or window. Reload to refresh your session.You switched accounts on another tab or window. Reload to refresh your session.Dismiss alert
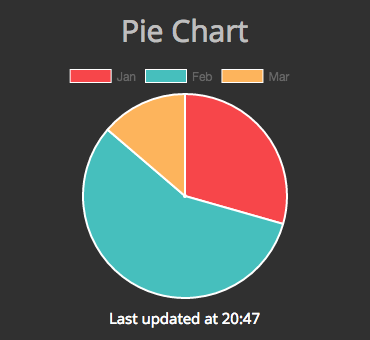
Simple Smashing/Dashing
widget (and associated job) to render pie charts. Uses Chart.js library.
Dependencies
Download the latest v2.x.x release of Chart.bundle.min.js from
https://github.com/chartjs/Chart.js/releases
and copy it into assets/javascripts. Make sure to remove any older versions
of Chart.js from the assets/javascripts folder.
NOTE: dashing-piechart is compatible with v2 of Chart.js. If you still
want to use the older version of Chart.js, you need to download the latest v1
of Chart.min.js and install v1.0
of this widget. Although, remember that older versions are not maintained
anymore.
Usage
Create the directory widgets/pie_chart and copy this widget's files
into that folder.
# Note: change this to obtain your chart data from some external sourcelabels=['Jan','Feb','Mar']data=[{data: Array.new(3){rand(30)},backgroundColor: ['#F7464A','#46BFBD','#FDB45C',],hoverBackgroundColor: ['#FF6384','#36A2EB','#FFCE56',],},]options={}send_event('piechart',{labels: labels,datasets: data,options: options})
Title Position
By default the title will be displayed on the top of the widget. If you
prefer to move it to the center, change the $title-position variable on the
SCSS file. Example:
$title-position: center;
Margins
You can also adjust the chart's margins: top, left, right and bottom. By
default they are all 0 (pixels) to use the whole available space. But if
needed you can change their value using the data- attributes. Example:
If not set, both right and bottom margins will be equal to left and top margins
respectively. This is likely what you want to keep the chart centered within
the widget. If not, set their values also using the data- attributes: