You signed in with another tab or window. Reload to refresh your session.You signed out in another tab or window. Reload to refresh your session.You switched accounts on another tab or window. Reload to refresh your session.Dismiss alert
The format will be inferred from the name of the output file; you
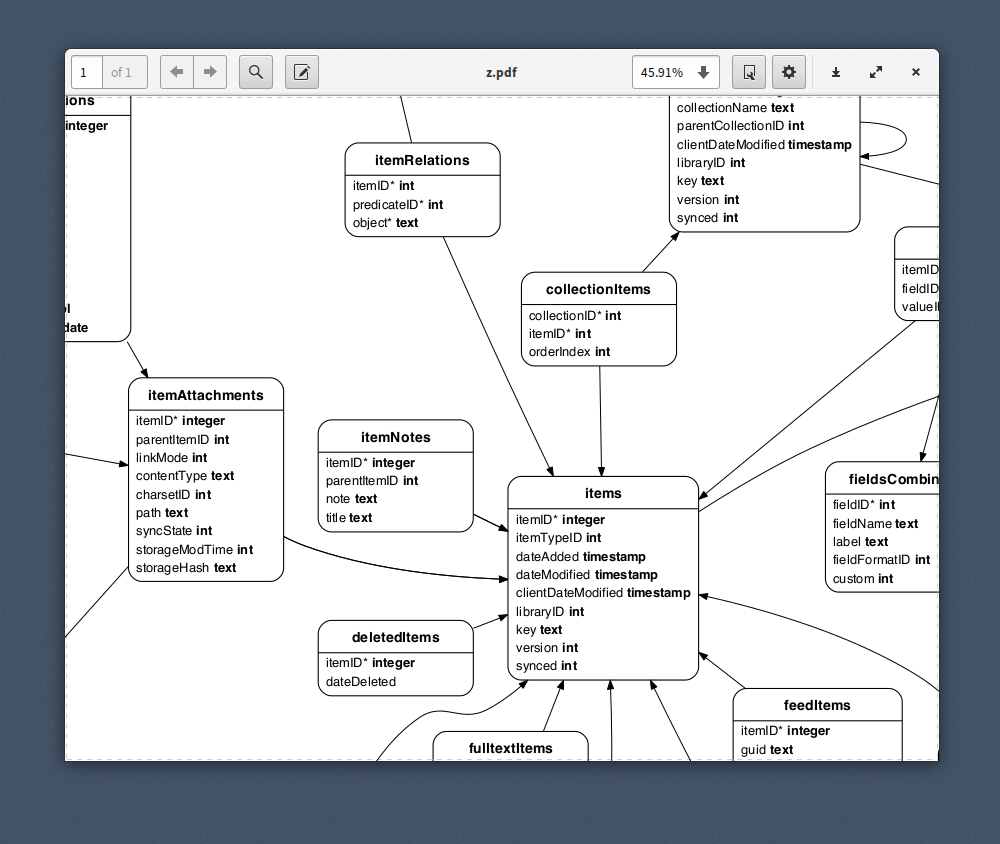
can use any format supported by graphviz (png, pdf, svg, and many more).
Usage
Usage: sqleton [options] <db-file>
Options:
  -h, --help        Print this help text and exit
  -v, --version     Print program version and exit
  -L, --layout      The layout command, one of:
                      "neato", "dot", "circo",
                      "fdp" (default),
                      "osage", "sfdp", "twopi"

  -e, --edge-labels  Label foreign key edges
  -t, --title        Optional title string
  -f, --font         The font to use, by default "Helvetica"
  -d, --direction    Graph direction, "TB" or "LR" (default)
  -o, --out          Output file (determines output format)
                     if not given DOT will be printed to stdout
      --skip-index   Skip writing table indexes
Fine-Tuning
To fine-tune your graph, the best option is to use .dot as your output
format and adjust the parameters in the file.
Node.js
constsqleton=require('sqleton')// Open your database and writable stream// ....sqleton(db,stream,options).then(()=>{db.close()}).then(()=>{stream.end()})
What about PostgreSQL or other databases?
sqleton was written to visualize SQLite schemata. Having said that,
you can try to dump your schema and create a new SQLite database for
visualisation from it.