You signed in with another tab or window. Reload to refresh your session.You signed out in another tab or window. Reload to refresh your session.You switched accounts on another tab or window. Reload to refresh your session.Dismiss alert
Vega-Altair is a declarative statistical visualization library for Python. With Vega-Altair, you can spend more time understanding your data and its meaning. Vega-Altair's
API is simple, friendly and consistent and built on top of the powerful
Vega-Lite JSON specification. This elegant
simplicity produces beautiful and effective visualizations with a minimal amount of code.
Vega-Altair was originally developed by Jake Vanderplas and Brian
Granger in close collaboration with the UW
Interactive Data Lab.The Vega-Altair open source project is not affiliated with Altair Engineering, Inc.
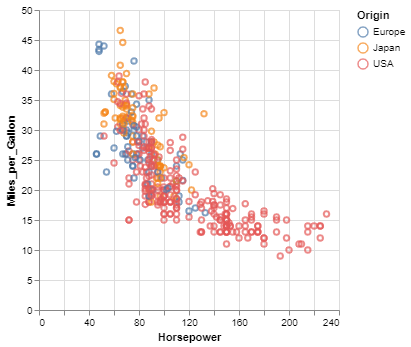
Here is an example using Vega-Altair to quickly visualize and display a dataset with the native Vega-Lite renderer in the JupyterLab:
importaltairasalt# load a simple dataset as a pandas DataFramefromvega_datasetsimportdatacars=data.cars()
alt.Chart(cars).mark_point().encode(
x='Horsepower',
y='Miles_per_Gallon',
color='Origin',
)
One of the unique features of Vega-Altair, inherited from Vega-Lite, is a declarative grammar of not just visualization, but interaction.
With a few modifications to the example above we can create a linked histogram that is filtered based on a selection of the scatter plot.
If you have a question that is not addressed in the documentation,
you can post it on StackOverflow using the altair tag.
For bugs and feature requests, please open a Github Issue.
Development
For information on how to contribute your developments back to the Vega-Altair repository, see
CONTRIBUTING.md
@article{VanderPlas2018,
    doi = {10.21105/joss.01057},
    url = {https://doi.org/10.21105/joss.01057},
    year = {2018},
    publisher = {The Open Journal},
    volume = {3},
    number = {32},
    pages = {1057},
    author = {Jacob VanderPlas and Brian Granger and Jeffrey Heer and Dominik Moritz and Kanit Wongsuphasawat and Arvind Satyanarayan and Eitan Lees and Ilia Timofeev and Ben Welsh and Scott Sievert},
    title = {Altair: Interactive Statistical Visualizations for Python},
    journal = {Journal of Open Source Software}
}
@article{Satyanarayan2017,
    author={Satyanarayan, Arvind and Moritz, Dominik and Wongsuphasawat, Kanit and Heer, Jeffrey},
    title={Vega-Lite: A Grammar of Interactive Graphics},
    journal={IEEE transactions on visualization and computer graphics},
    year={2017},
    volume={23},
    number={1},
    pages={341-350},
    publisher={IEEE}
}