You signed in with another tab or window. Reload to refresh your session.You signed out in another tab or window. Reload to refresh your session.You switched accounts on another tab or window. Reload to refresh your session.Dismiss alert
geoplot is a high-level Python geospatial plotting library. It's an extension to cartopy and matplotlib which makes mapping easy: like seaborn for geospatial. It comes with the following features:
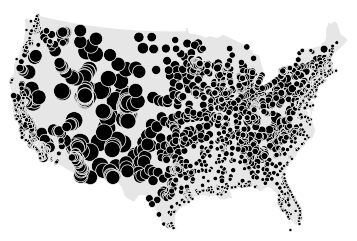
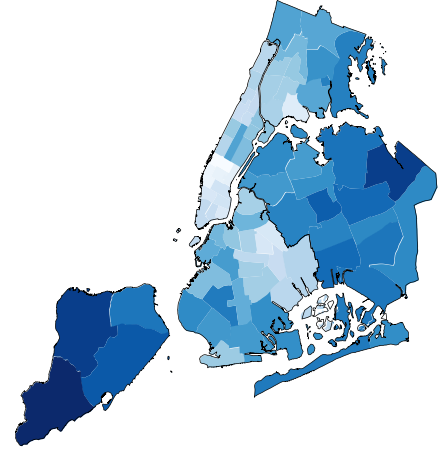
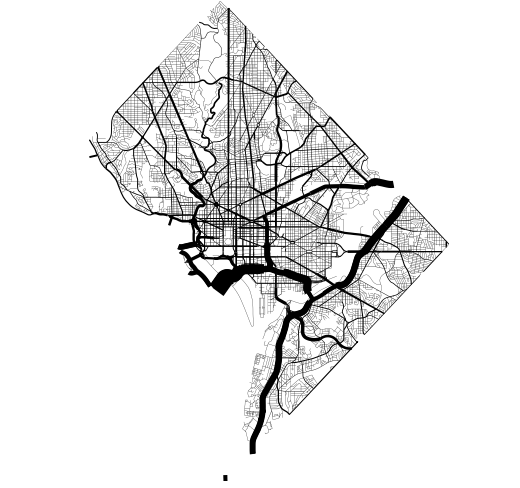
High-level plotting API: geoplot is cartographic plotting for the 90% of use cases. All of the standard-bearermaps that you’ve probably seen in your geography textbook are easily accessible.
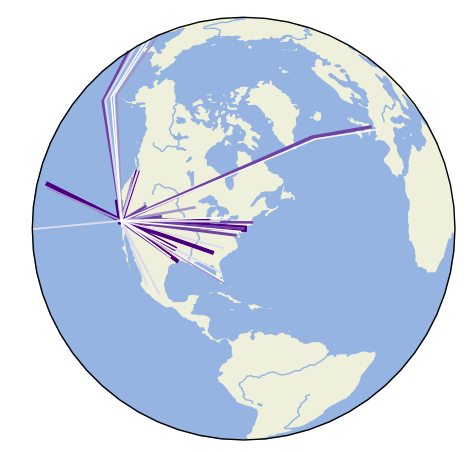
Native projection support: The most fundamental peculiarity of geospatial plotting is projection: how do you unroll a sphere onto a flat surface (a map) in an accurate way? The answer depends on what you’re trying to depict. geoplot provides these options.
Compatibility with matplotlib: While matplotlib is not a good fit for working with geospatial data directly, it’s a format that’s well-incorporated by other tools.
Author note: geoplot is currently in a maintenence state. I will continue to provide bugfixes and investigate user-reported issues on a best-effort basis, but do not expect to see any new library features anytime soon.
About
High-level geospatial data visualization library for Python.