You signed in with another tab or window. Reload to refresh your session.You signed out in another tab or window. Reload to refresh your session.You switched accounts on another tab or window. Reload to refresh your session.Dismiss alert
The packaged release tends to lag significantly behind the Git version.
Via Git
Download:
git clone https://github.com/PatMartin/Dex.git
Run
cd Dex
java -jar Dex.jar
Example Visualizations
The following are a small sample of the 50+ data visualizations Dex is capable of generating.
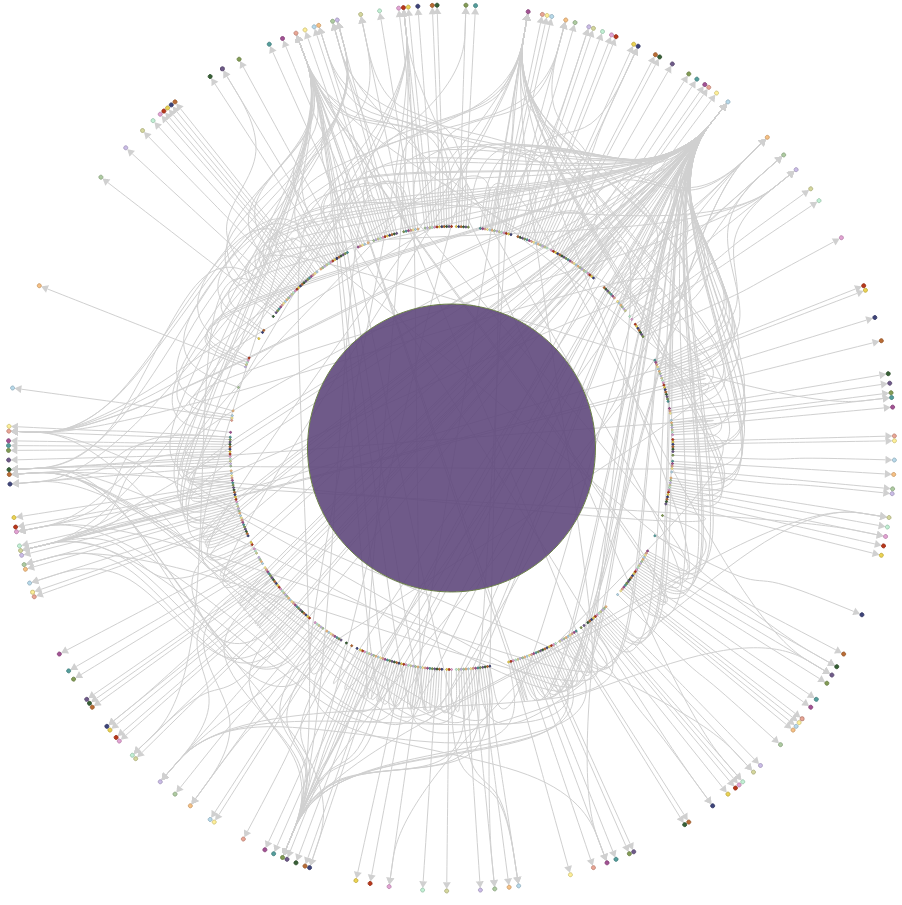
Ring Network
This visualization was created with Dex to visualize the relationships between Dr Who villans and motivations.
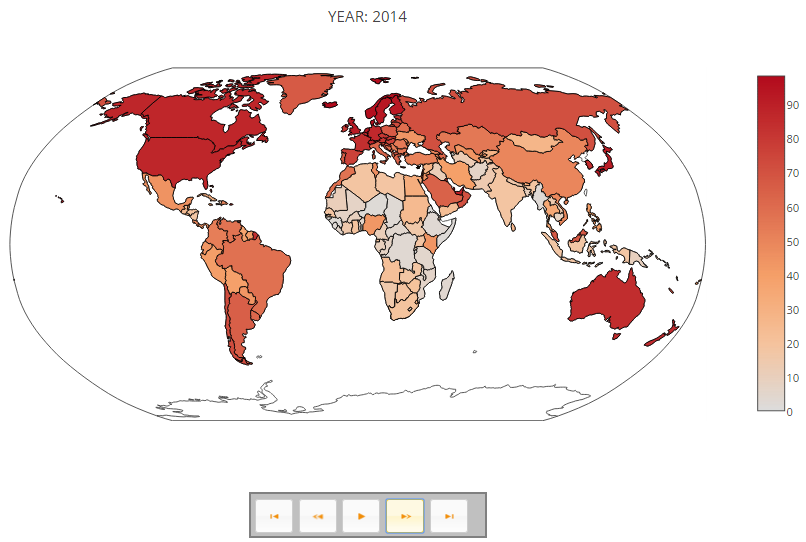
Maps
This visualization was created with Dex to visualize internet use across the world over the past 20 years.
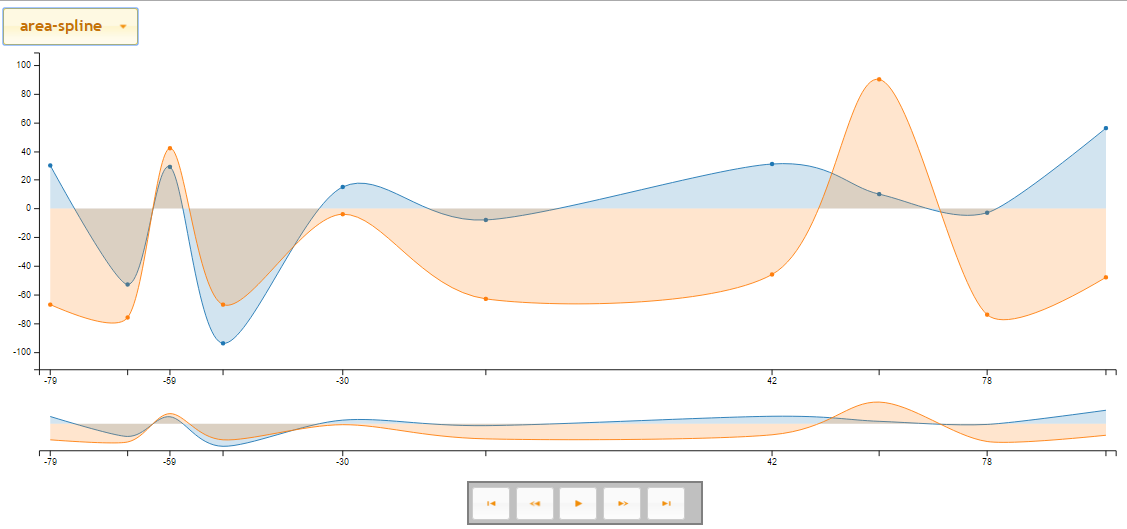
Time Visualizations
This visualization depicts a small series over time.
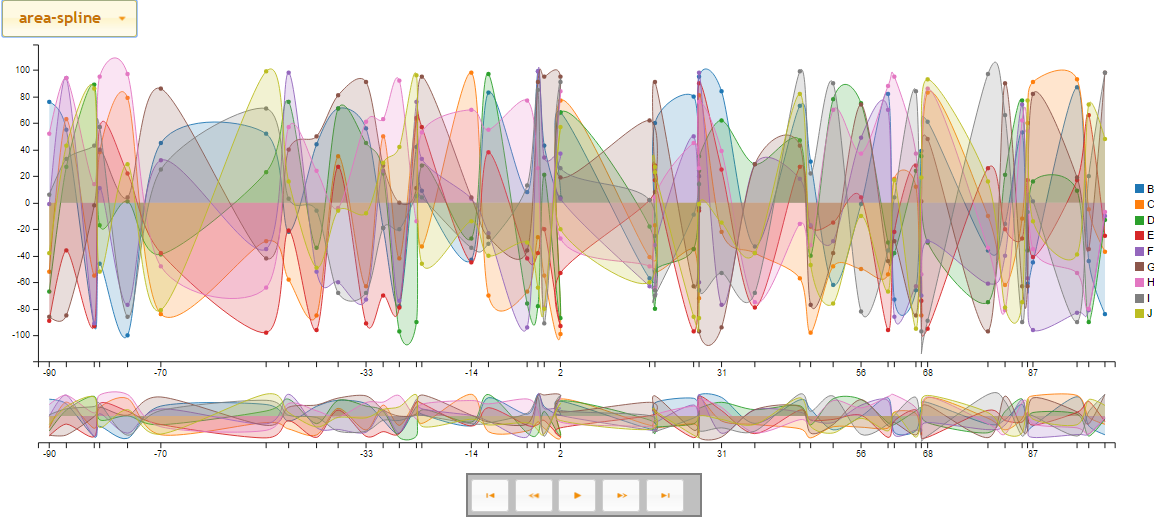
This visualization depicts a more complex series over time.
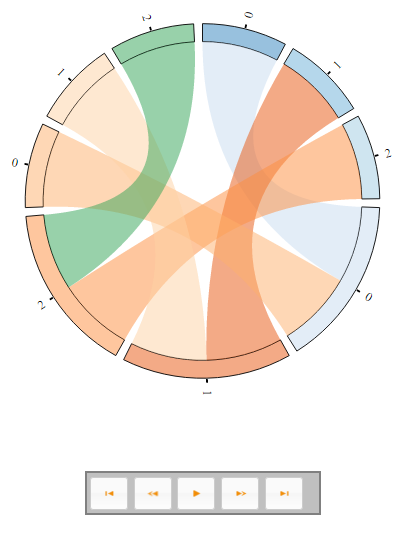
Chord Visualizations
This visualization depicts relationships via a Chord diagram over time.
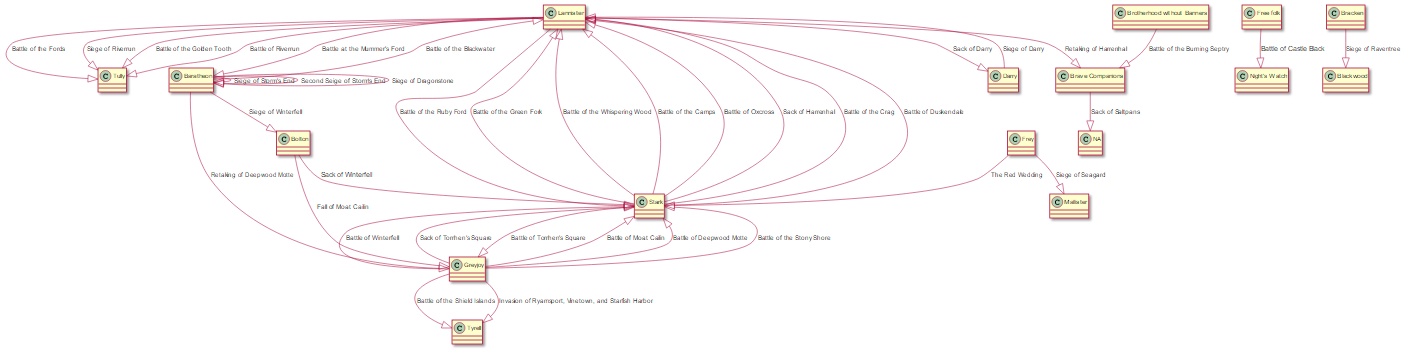
UML Visualizations
A Class Diagram of the various battles within the Game of Thrones.
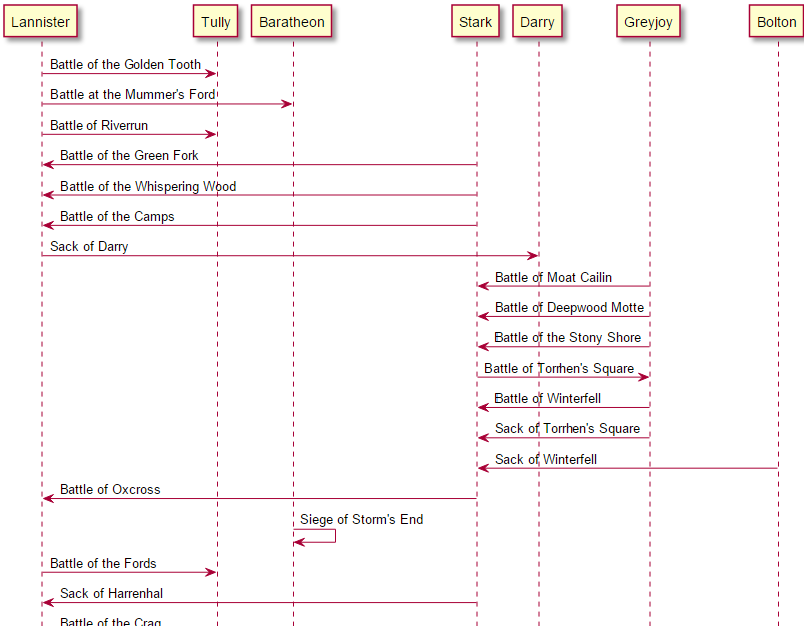
A Sequence Diagram of the various battles within the Game of Thrones.
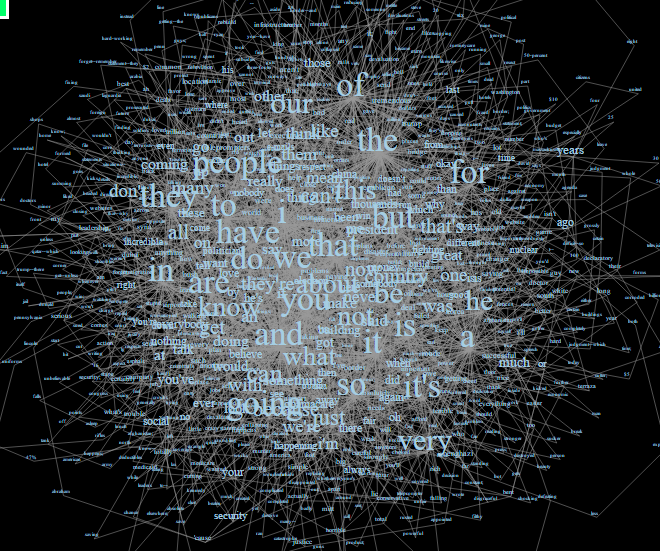
Network Visualizations
A large network comprised of every word spoken by Donald trump connected by the next word within the Iowa speech. This network visualization is founded on the high performance VivaGraph.
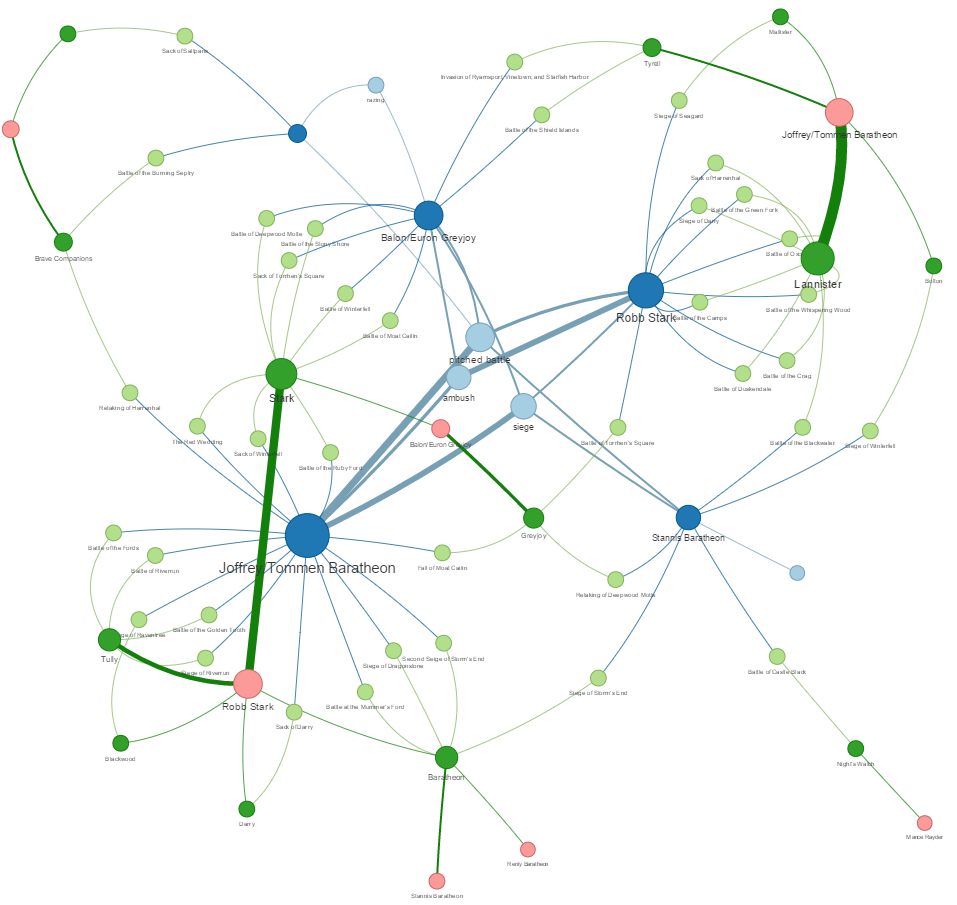
A vis.js visualization of the battles between the various houses within the Game of Thrones.
Timelines
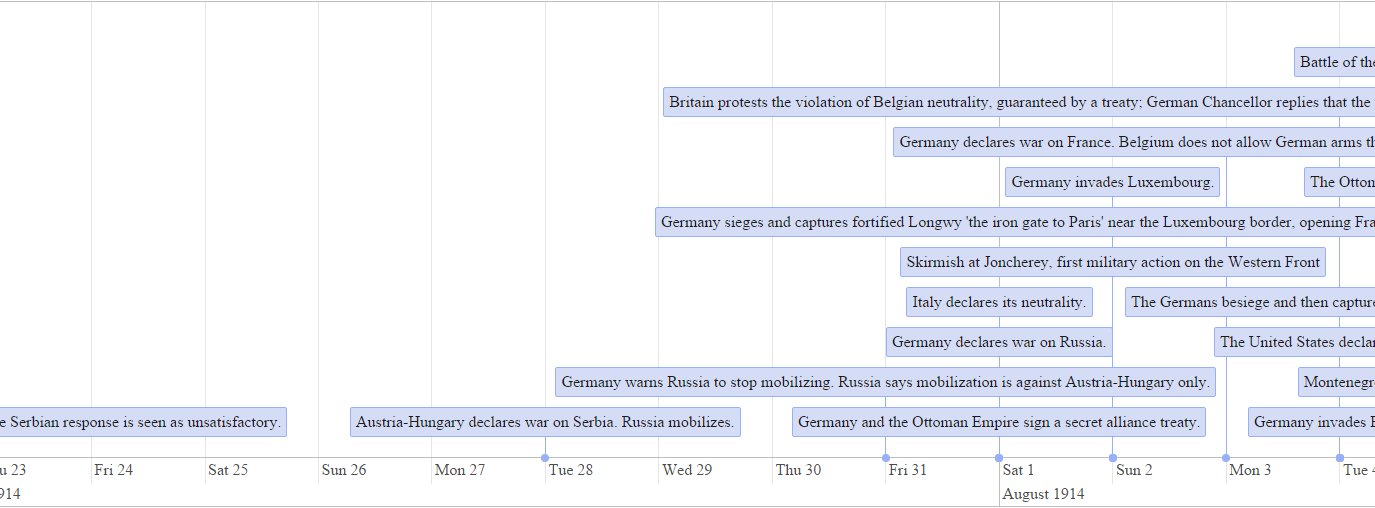
A vis.js timeline visualization of the sequence of events that lead up to, and occurred during World War I.
3D Graphs
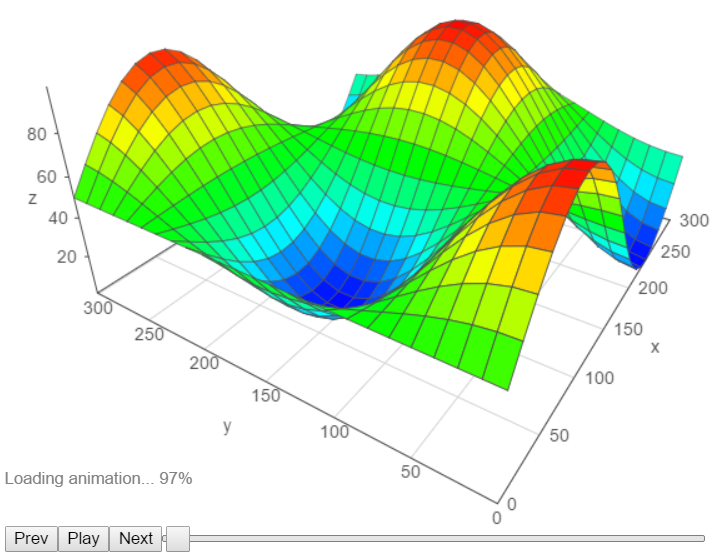
A 3D graph of some data generated via Dex using a vis.js visual.
About
Dex : The Data Explorer -- A data visualization tool written in Java/Groovy/JavaFX capable of powerful ETL and publishing web visualizations.