| CARVIEW |
Navigation Menu
-
Notifications
You must be signed in to change notification settings - Fork 658
performance profiling of first load of trace data #9465
New issue
Have a question about this project? Sign up for a free GitHub account to open an issue and contact its maintainers and the community.
By clicking “Sign up for GitHub”, you agree to our terms of service and privacy statement. We’ll occasionally send you account related emails.
Already on GitHub? Sign in to your account
Conversation
|
@mjkkirschner I've added a test. |
|
@aparajit-pratap thanks! I will build on top of this test with a large element binding example of the scale which replicates the issue. |
…ynamo into speedUpBindToType
add new test file with 1500 trace elements
make traceBinder internal
expose protoCore internals to dynamoCoreTests
|
@saintentropy @aparajit-pratap @QilongTang I have done the following:
PTAL |
|
|
||
| BeginRun(); | ||
| sw.Stop(); | ||
| Assert.Less(sw.Elapsed.Milliseconds, 20000); |
There was a problem hiding this comment.
Choose a reason for hiding this comment
The reason will be displayed to describe this comment to others. Learn more.
How much time would this take earlier, 20s? This time could be hardware specific. I don't think it takes 20s for me without your fixes.
There was a problem hiding this comment.
Choose a reason for hiding this comment
The reason will be displayed to describe this comment to others. Learn more.
I will check - with the sample files I was using with similar sized data it took 2.5 minutes.
There was a problem hiding this comment.
Choose a reason for hiding this comment
The reason will be displayed to describe this comment to others. Learn more.
Sorry, it took over a min when I ran it again. I might have made a mistake running it the first time. It looked a lot faster then. I think testing for <20s shouldn't be a problem on most machines if you claim that it actually takes just 2s.
There was a problem hiding this comment.
Choose a reason for hiding this comment
The reason will be displayed to describe this comment to others. Learn more.
I'm curious what the existing tests tested (the ones you re-enabled)? LGTM!
There was a problem hiding this comment.
Choose a reason for hiding this comment
The reason will be displayed to describe this comment to others. Learn more.
The tests also do some really simple element binding and element disposal testing.
|
@aparajit-pratap on my vm - the loading of trace in this test takes 34 seconds before the change, after it takes 1.1 seconds - I ran them both a few times, this appears to be the average on my machine. |
|
@mjkkirschner while these changes are great and will improve the deserialization of all kinds of custom classes that people have decided to save to their dynamo graph, isn't serializing the entire wrapped object for each bound element too much? I was just wondering if a special and more light-weight method could be implemented for those cases, one that stores only the unique id of the element as a string? Right now every public member of the wrapped object will get serialized, when all we need is the guid. All other parameters might have changed between the time the graph was saved last and the latest version of the Revit model it was used with and that would most likely invalidate the trace data. If that's viable, it could hopefully improve both the robustness and the performance of element binding in general. |
|
Hi @dimven So your initial point is definitely valid, it's just maybe not as bad initially - or bad in other ways 😄 . You can see what's in trace by base64 decoding it, and then base 64 decoding the individual elements again. |
|
Thanks for shining a light of things. A single element serializes to this: which is about 750 characters on average. That means that roughly for every 700 elements serialized to a dyn file you save something the size of an average novel :D If we could save just the GUID strings maybe as json, that'd be a reduction of over 90% |
* add element binding test to core
* re-enabe callsite tests, update files, and load deps manually
* add timing test
add new test file with 1500 trace elements
make traceBinder internal
expose protoCore internals to dynamoCoreTests
…#9505)
* performance profiling of first load of trace data (#9465)
* add element binding test to core
* re-enabe callsite tests, update files, and load deps manually
* add timing test
add new test file with 1500 trace elements
make traceBinder internal
expose protoCore internals to dynamoCoreTests
* modify file versions so they are not from the future
Purpose
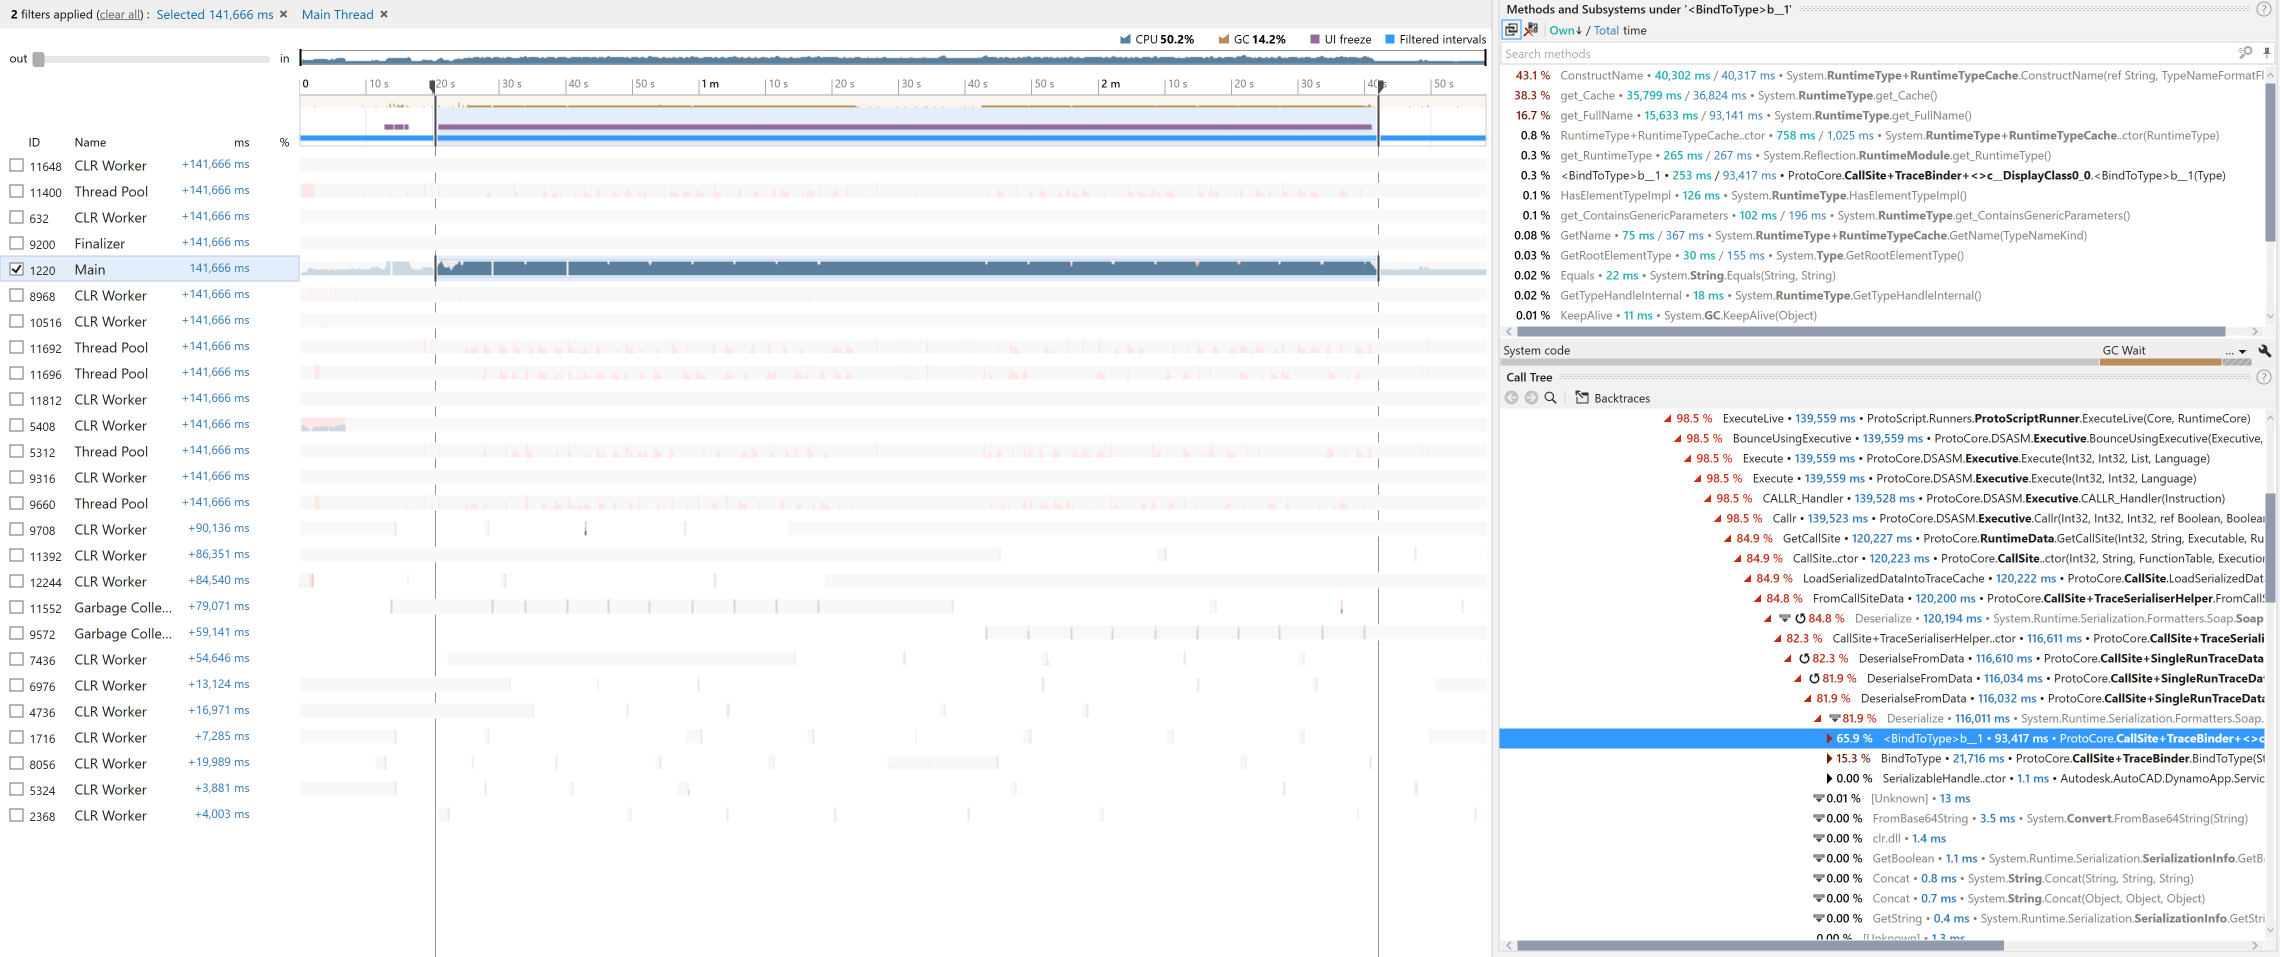
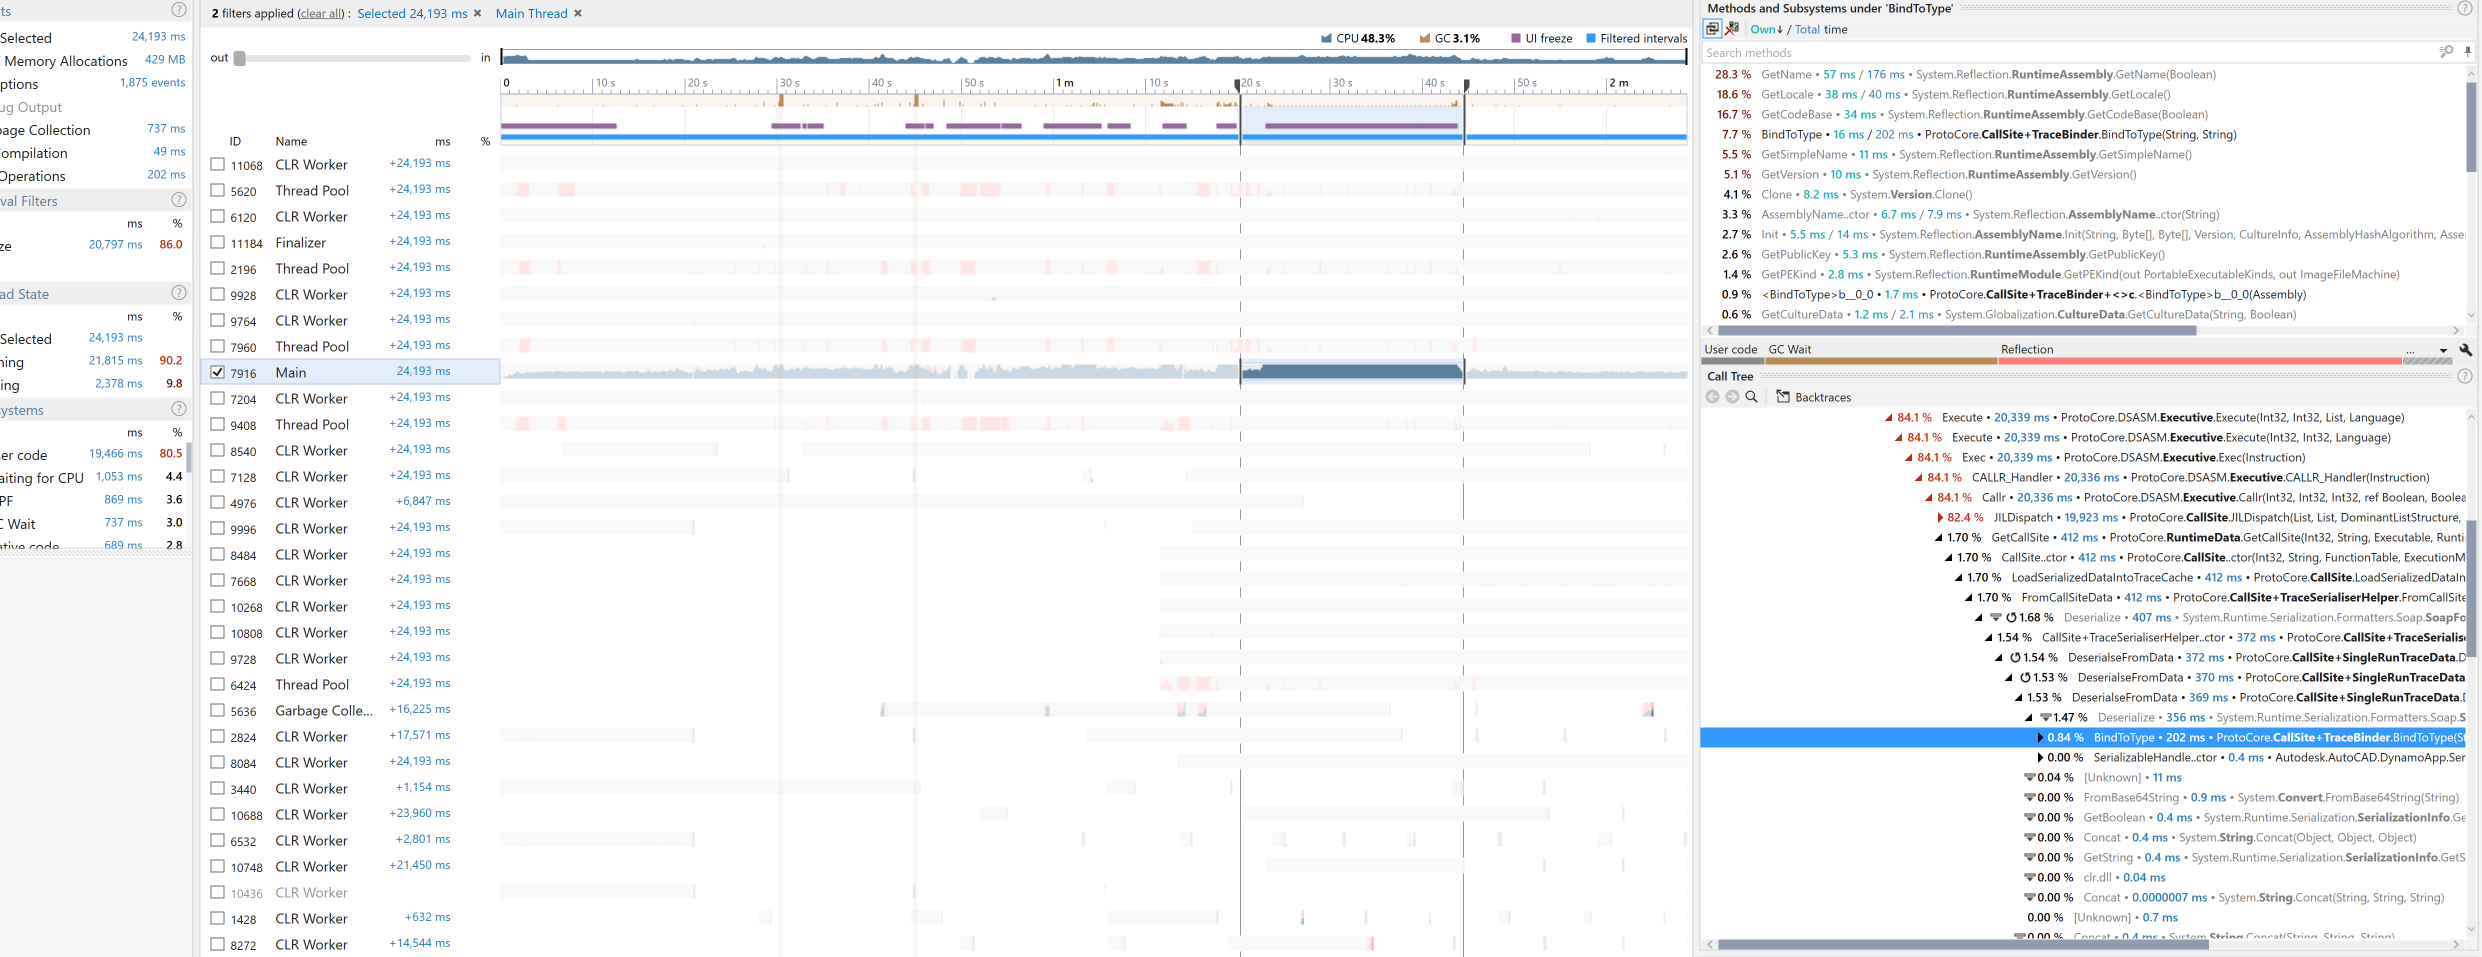
Element binding is very slow on first run when the size of the element binding data is greater than a few entires.
This change attempts to avoid the exponential cost of looping over all types in all assemblies to find a matching type name - instead we first try to look in assemblies that match in name only, then fallback to our slow matching strategy.
you can see in the below timeline profile that running the sample graph on first load took ~2.5 minutes and after this change runtime is ~25 seconds.
before:
after:
TODO:
Declarations
Check these if you believe they are true
*.resxfilesReviewers
@aparajit-pratap
@saintentropy
FYIs
@smangarole