| CARVIEW |
OpenTelemetry-native application performance monitoring
Auto-instrument your applications, visualize and correlate dependencies, and quickly pinpoint root causes — right down to the code.
Guided Demo
100% visibility, zero downtime
Spotlight anomalies and speed up troubleshooting across distributed microservices, serverless functions, AI models, third-party APIs, and more.
Bring your data. We'll do the rest.
STEP 2: Visualize and analyze — with AI-assisted investigations.
STEP 3: Pinpoint root cause — right down to the code.
WHY OTEL-NATIVE MATTERS
APM should be open. Period.
Data silos, proprietary formats, and closed ecosystems slow you down. Elastic is open source and OTel-native, delivering broad language support, improved interoperability, and detailed context for troubleshooting.

Ingest and analyze any OTel data
OpenTelemetry provides a portable standard for observability. You can bring OTel-native traces, logs, and metrics into Elastic from any third-party OTel tool — or from your own OTel collectors using custom processors and exporters — for analysis and visualization in Elastic.

Rich context across all your data
Elastic's unified schema extends OTel semantic conventions with resource attributes and execution context, allowing you to collect and correlate traces with logs and metrics from any source — while preserving full OTel compatibility.

Production-ready distribution
With Elastic Distributions of OpenTelemetry (EDOT), you get a stable, supported OTel distribution backed by experts that includes auto-instrumentation for Java, .NET, Python, Node.js, PHP, iOS, and Android.

No proprietary format
Elastic's native support for OTel schematic conventions and W3C trace context ensures your telemetry data isn’t locked into a proprietary format. That means easier migration and long-term flexibility as your architecture evolves.
VISUALIZE & ANALYZE
Pinpoint code issues and debug faster
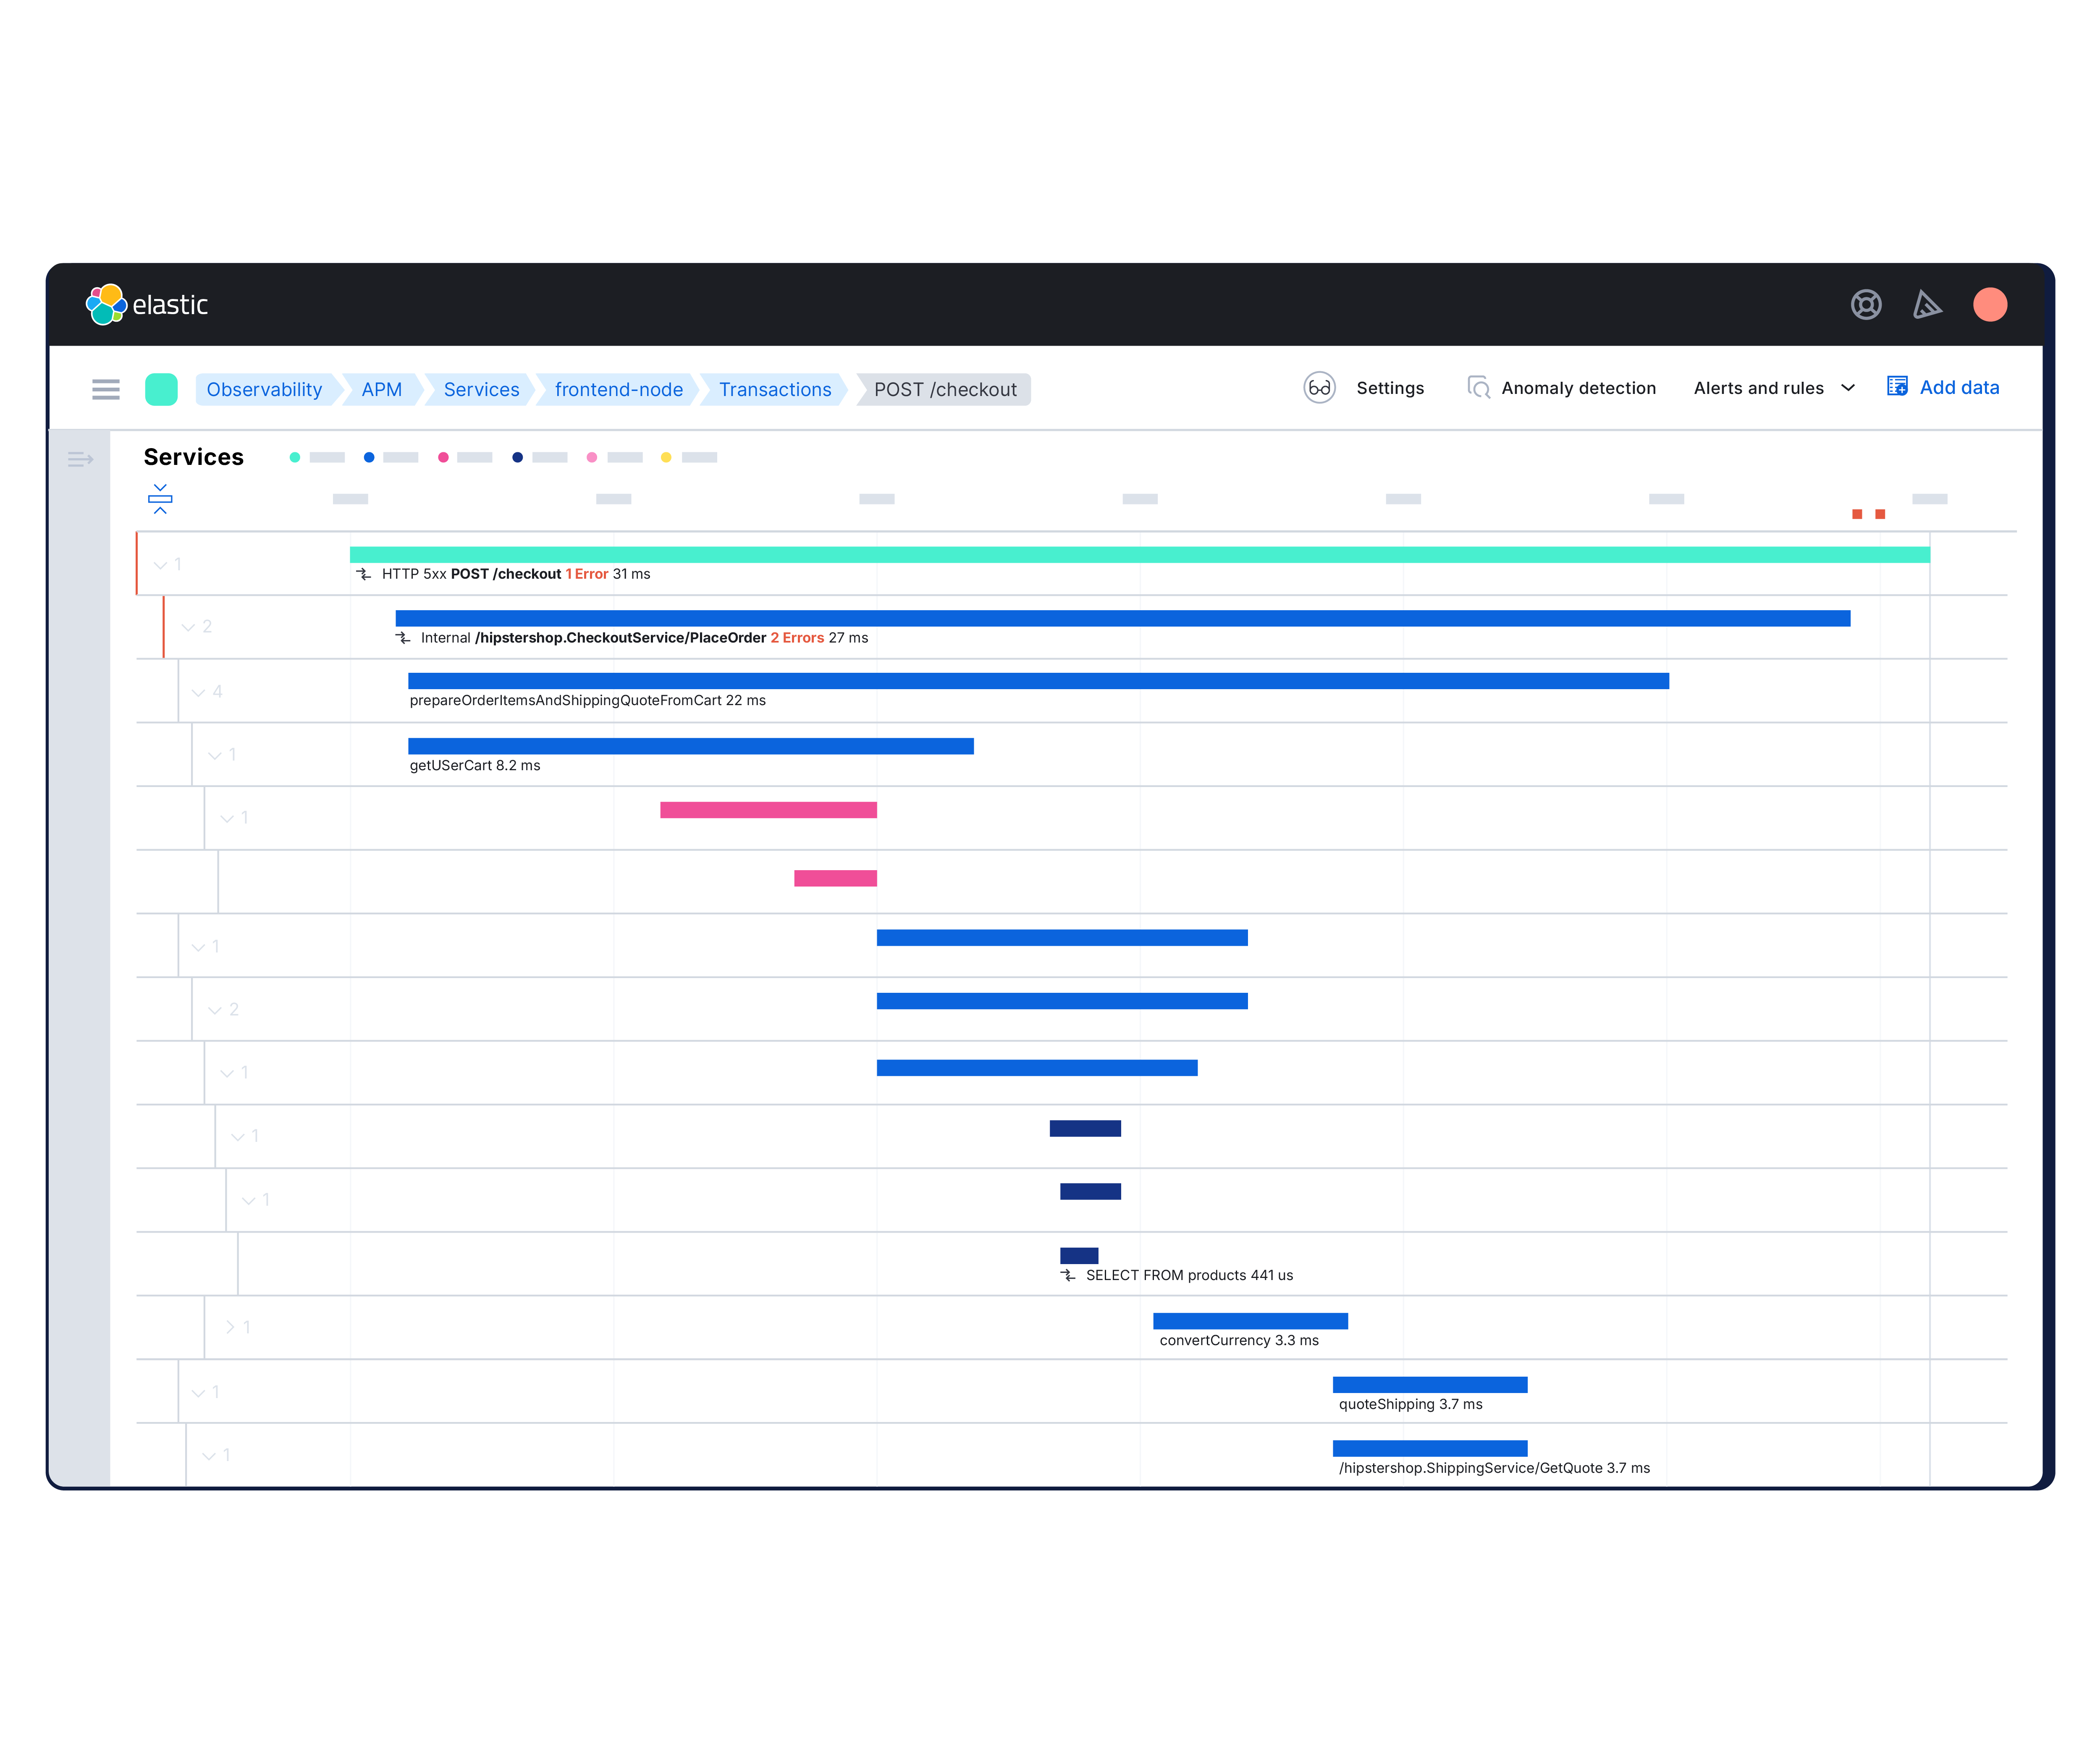
- Track requests across your stack with lightweight, OpenTelemetry-based distributed tracing. Head- and tail-based sampling cuts overhead without cutting context. Get the critical traces you need without the performance penalty.
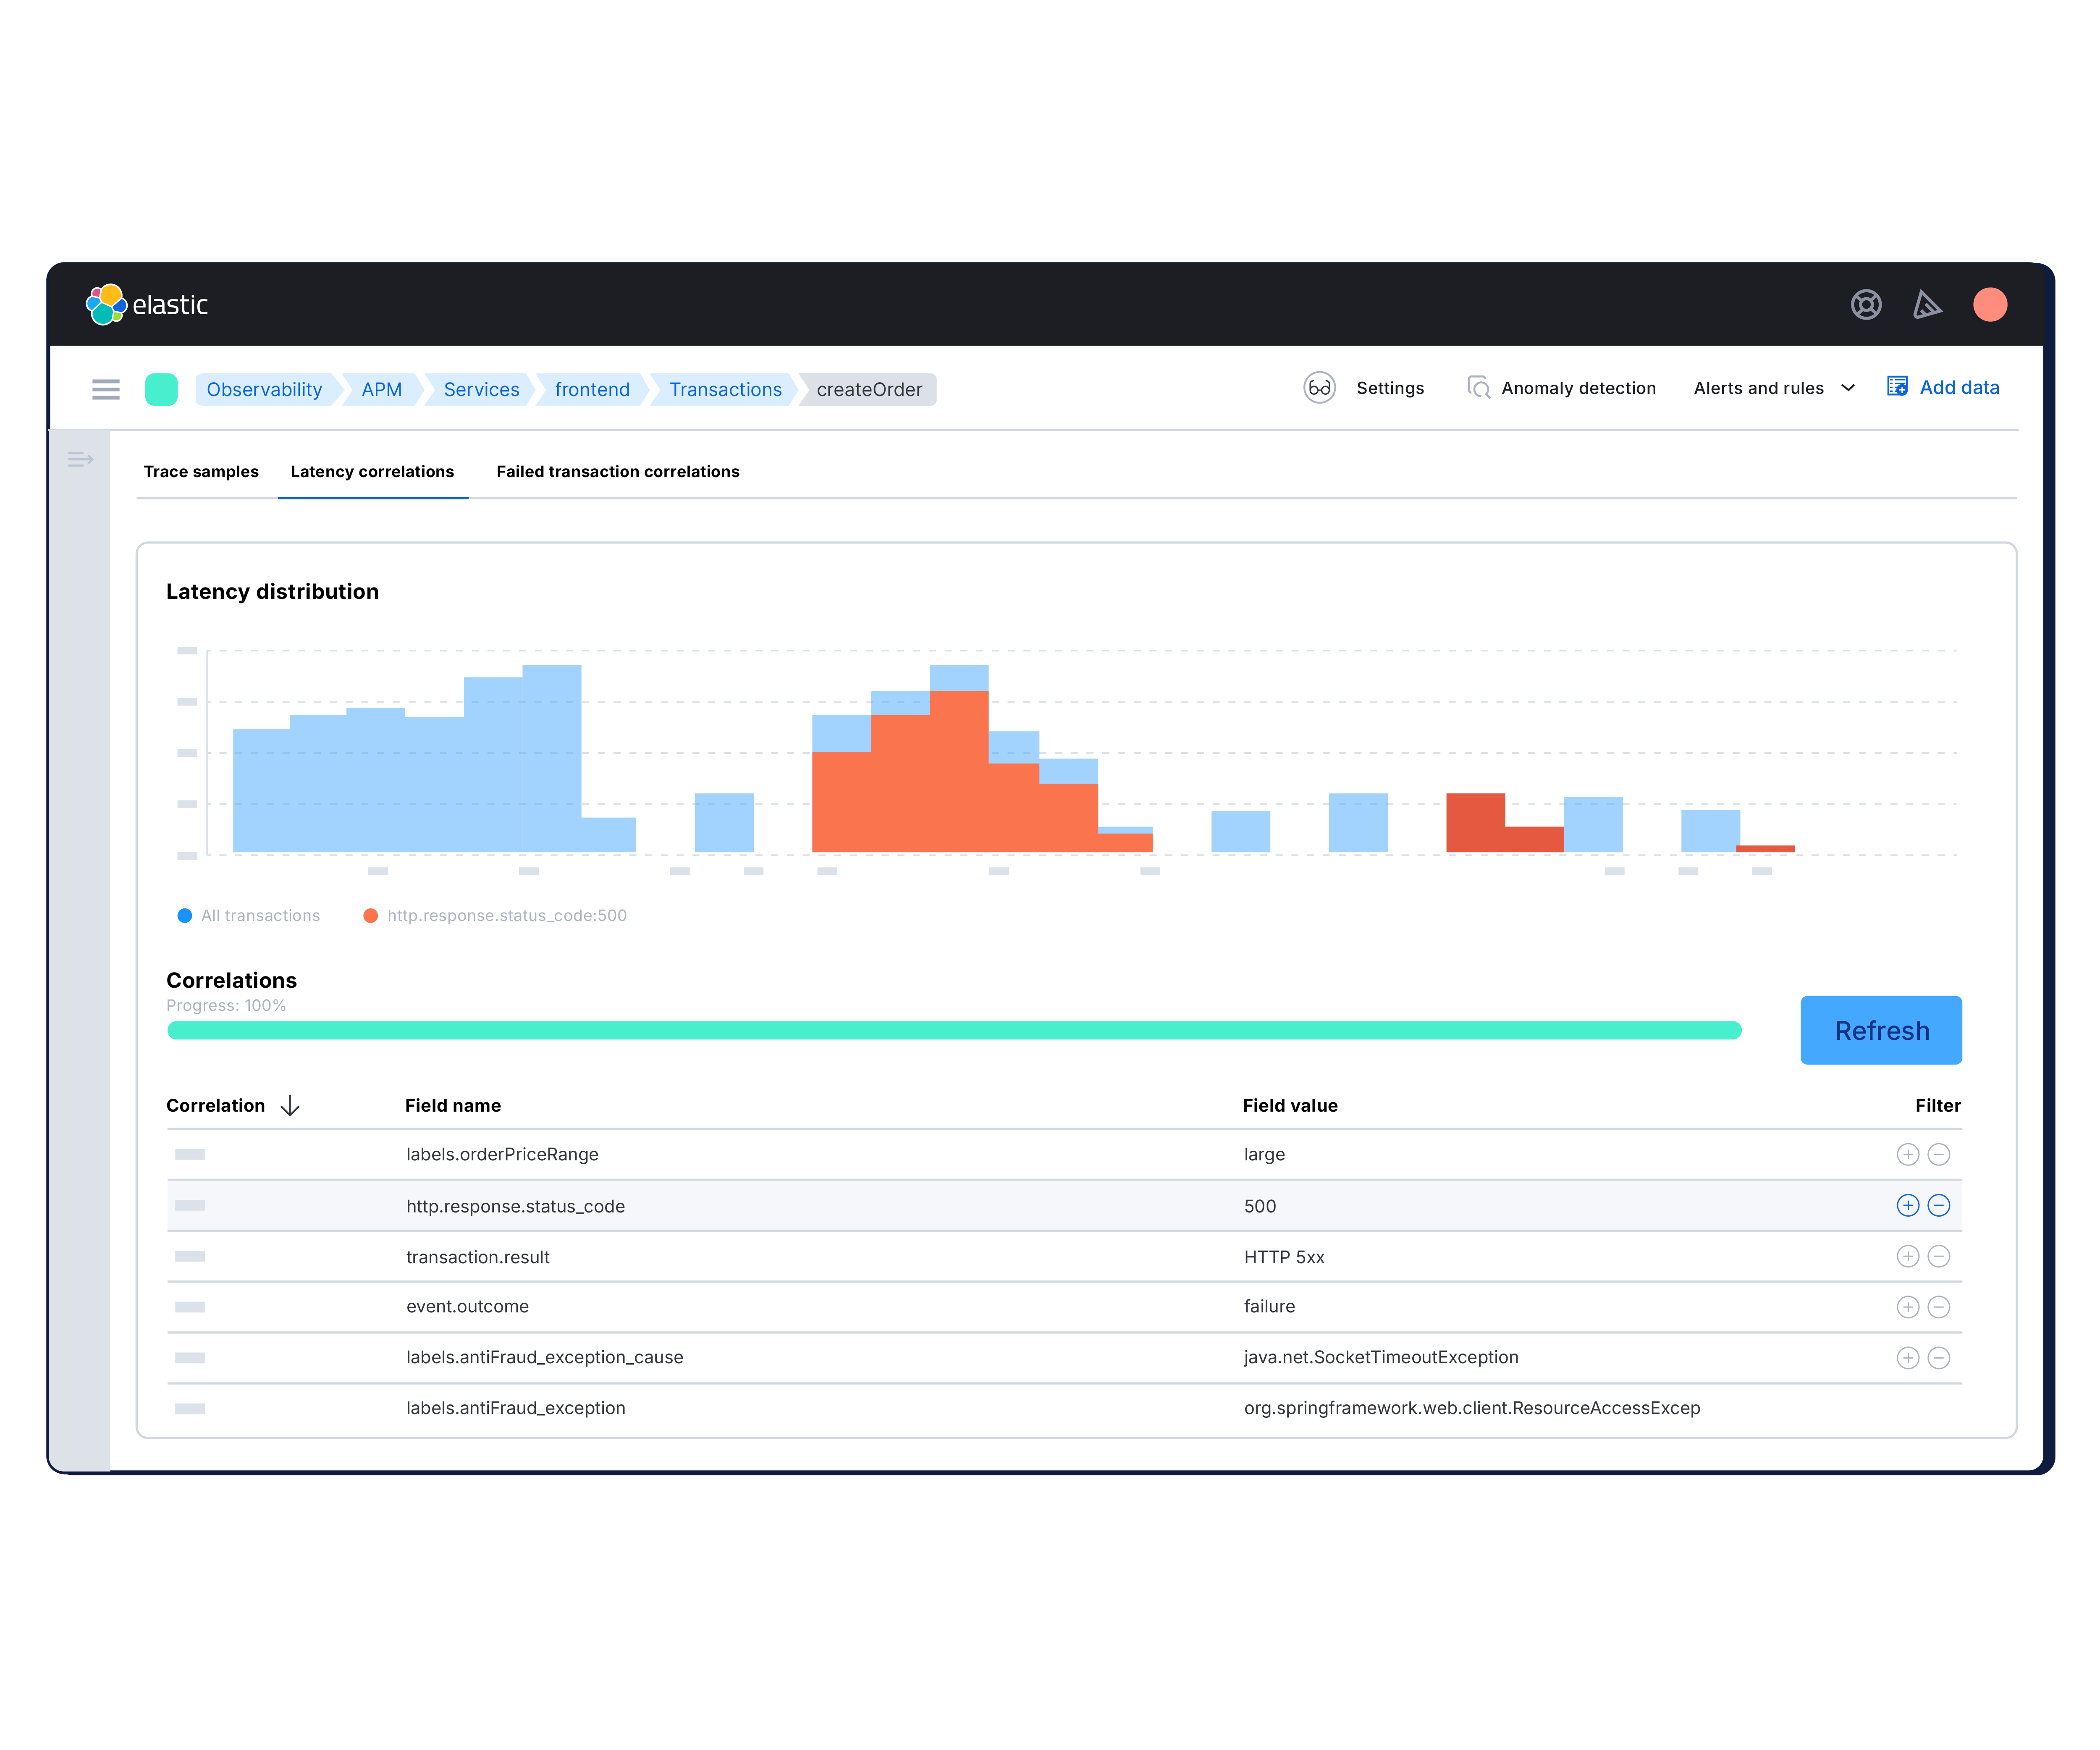
When issues occur, it's rarely a single root cause. Elastic APM uses machine learning to automatically correlate symptoms to possible causes by surfacing the outliers, patterns, and changes behind intermittent performance glitches.
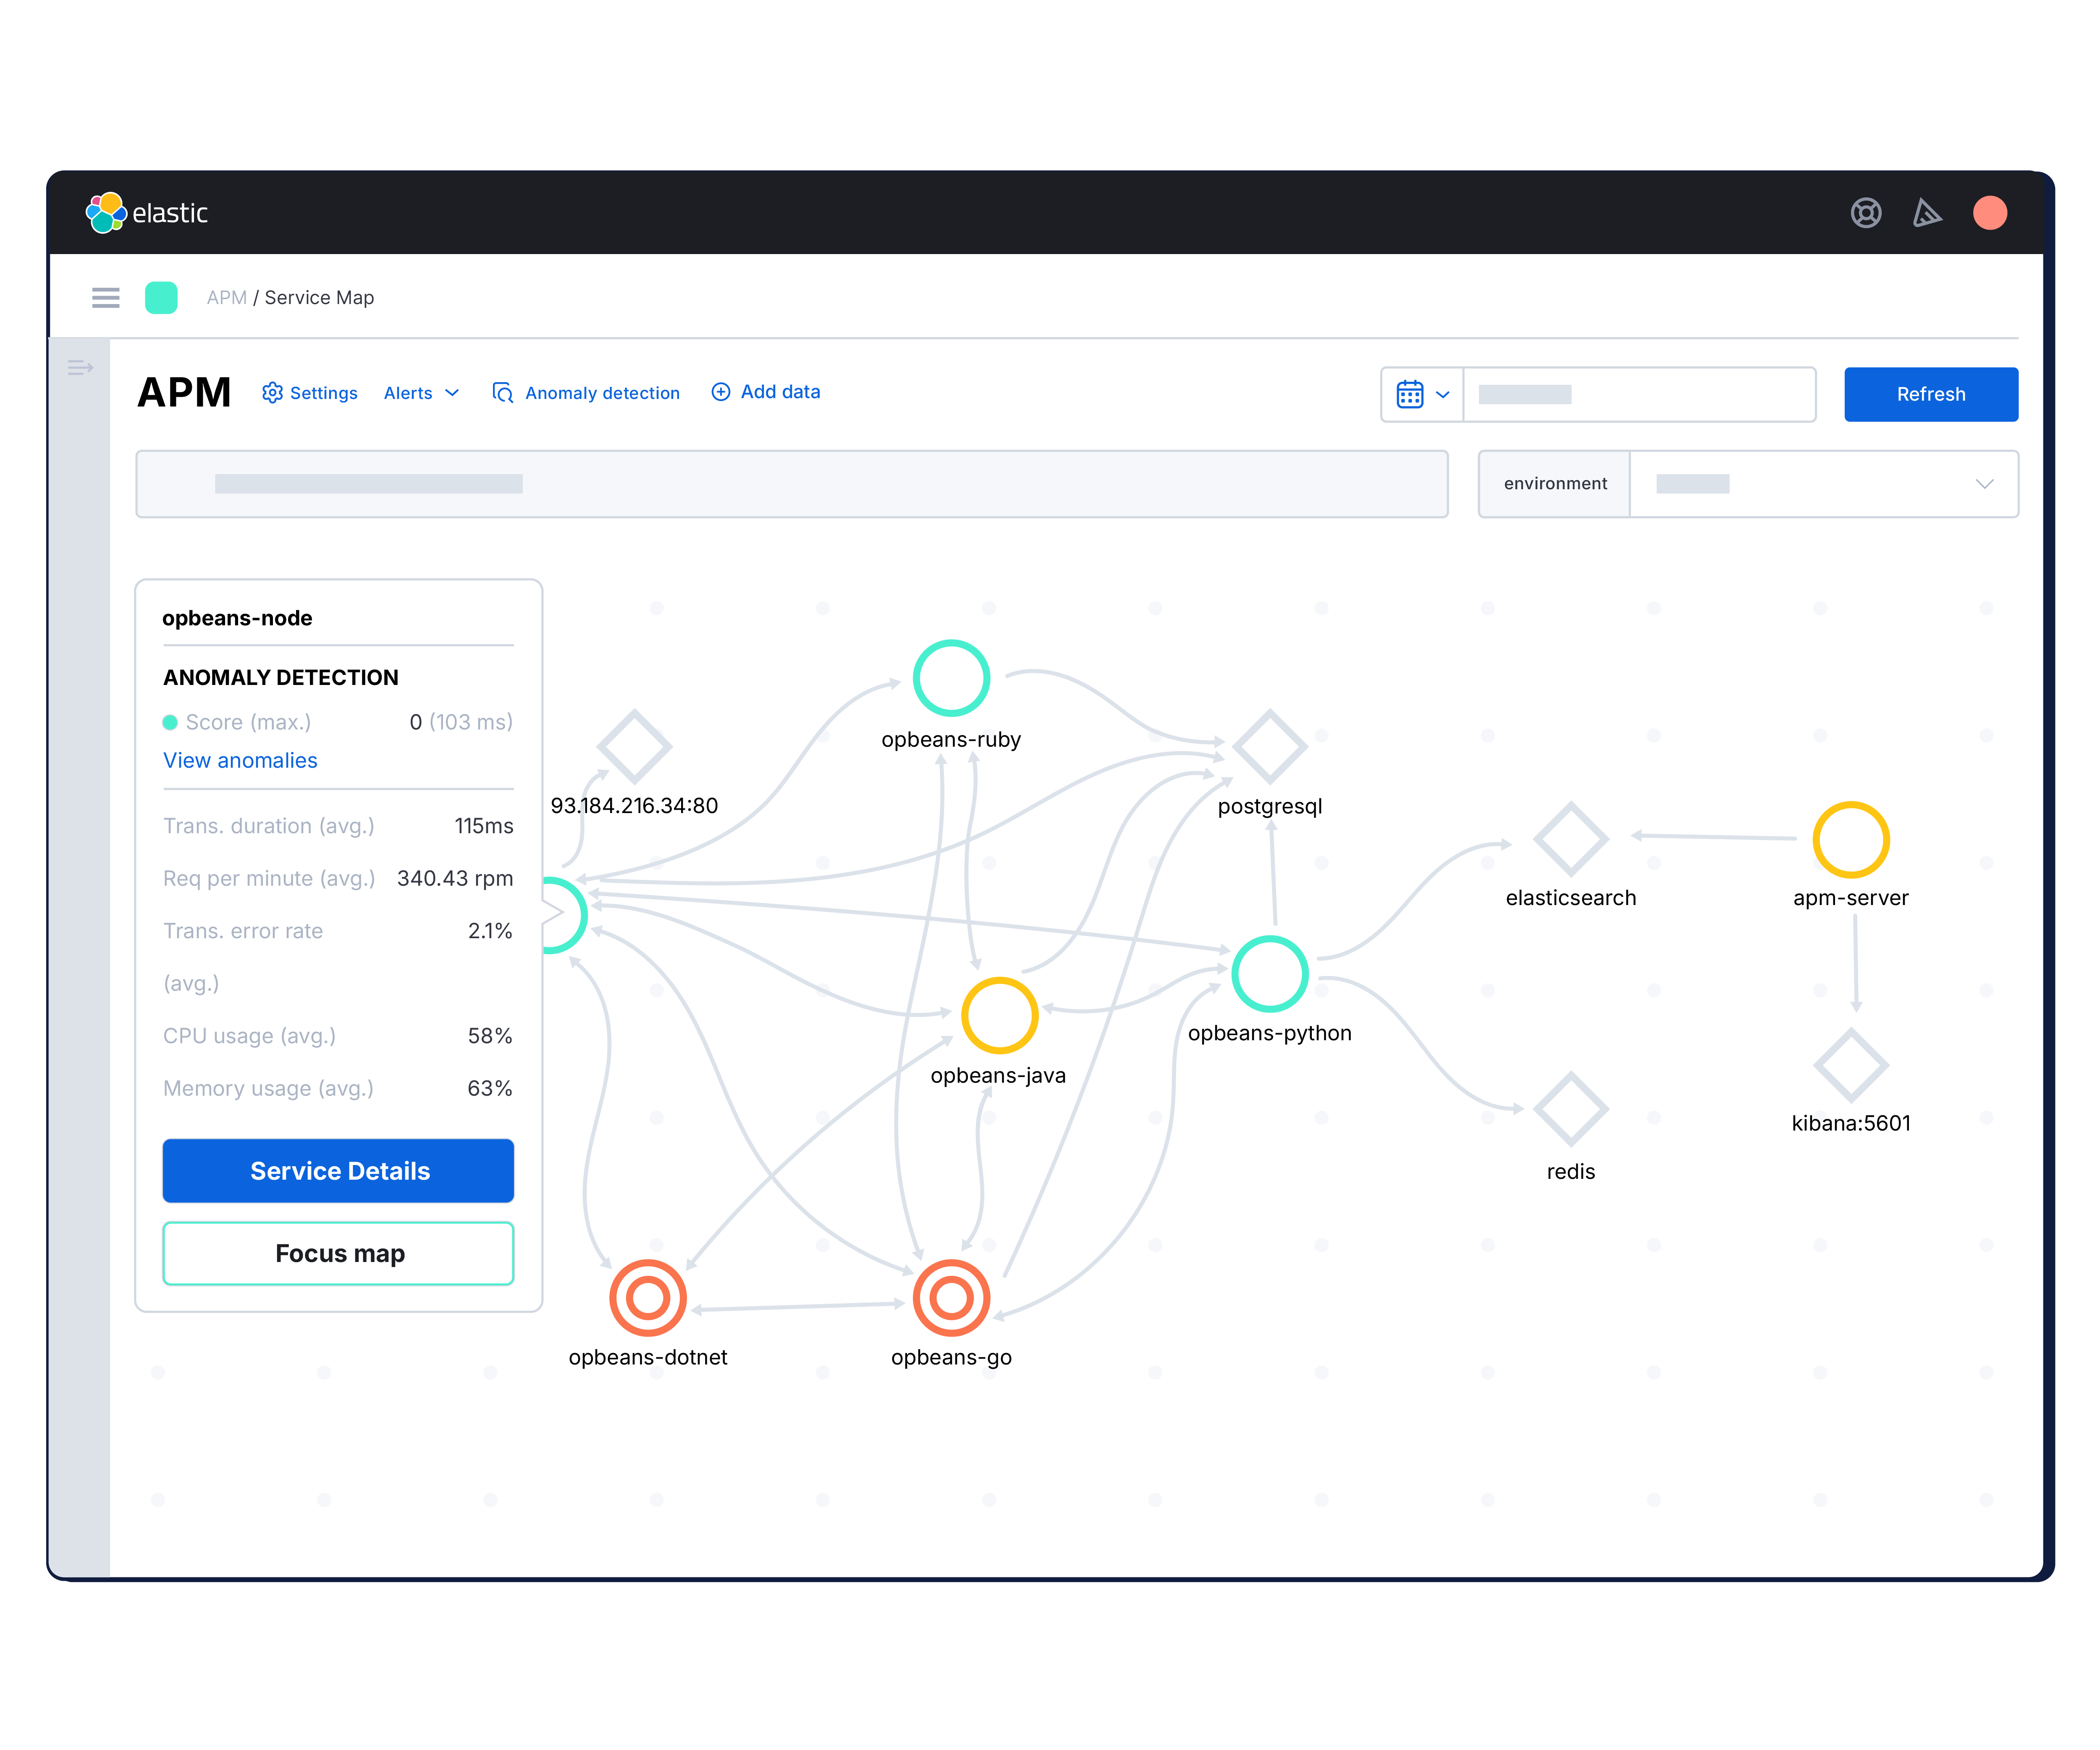
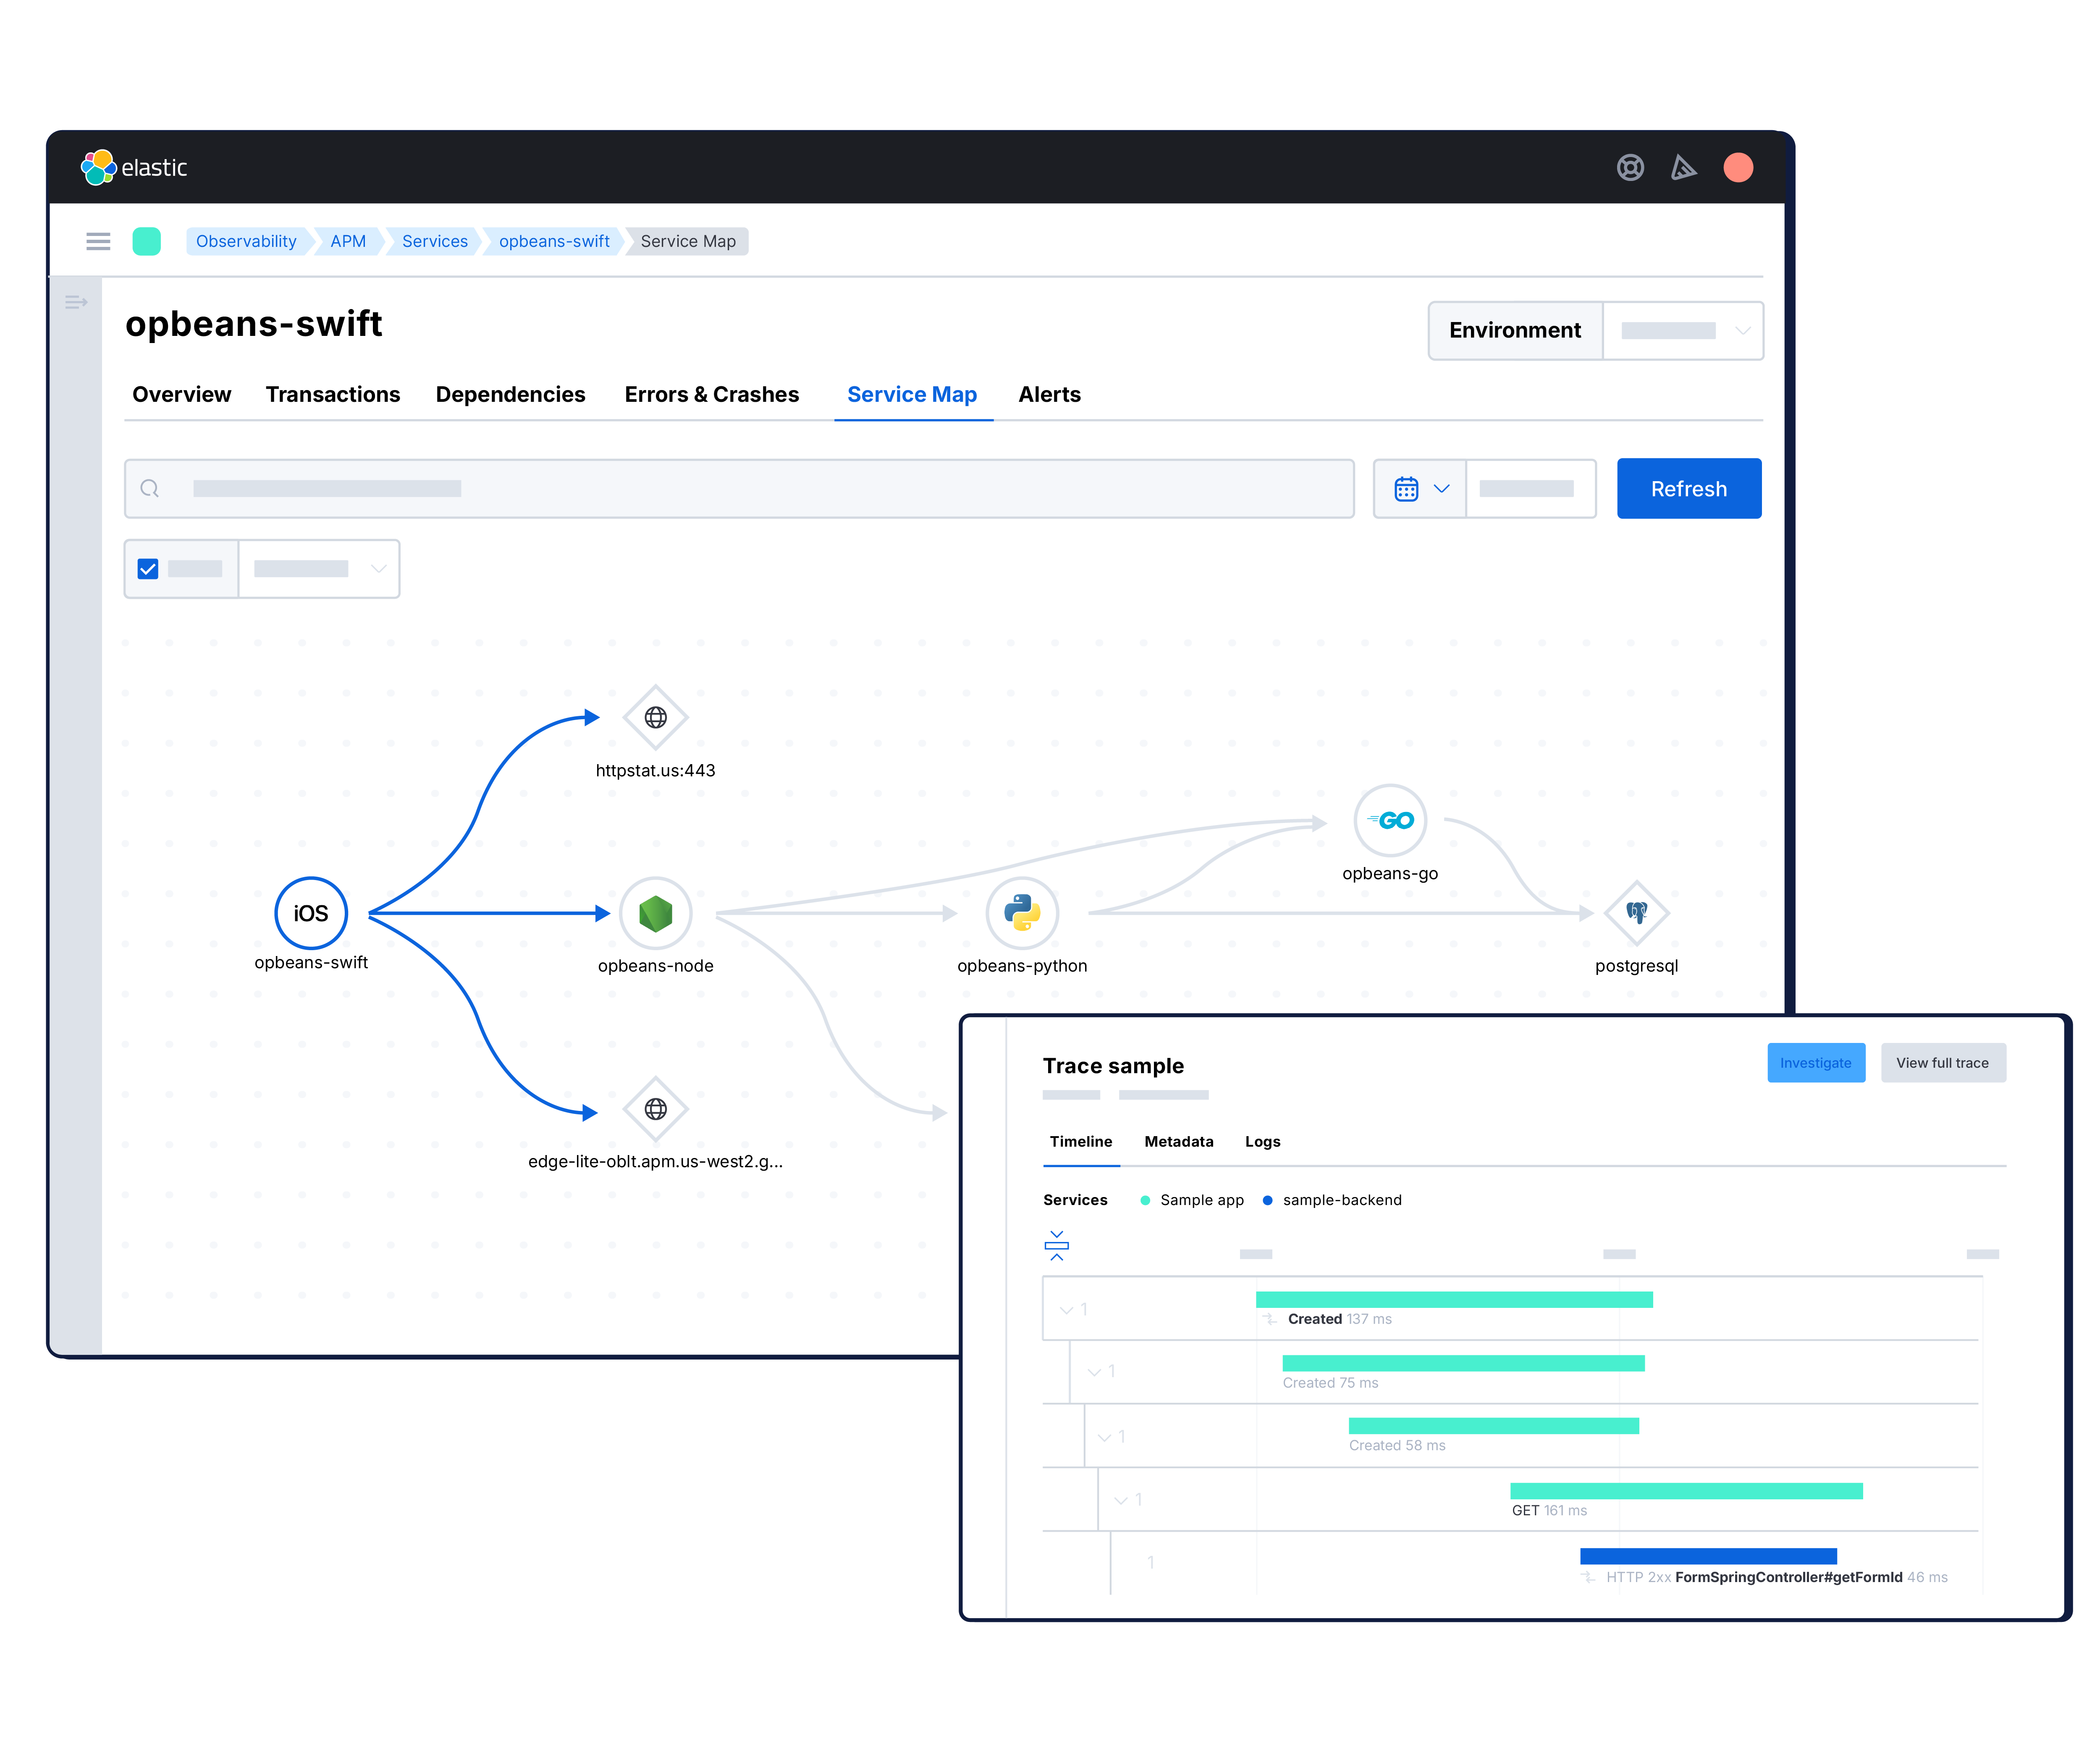
A map of your architecture — live and interactive — is your compass in production. Visualize critical anomalies across services running in clouds and containers. See what’s connected, what's struggling, and where to tune performance.
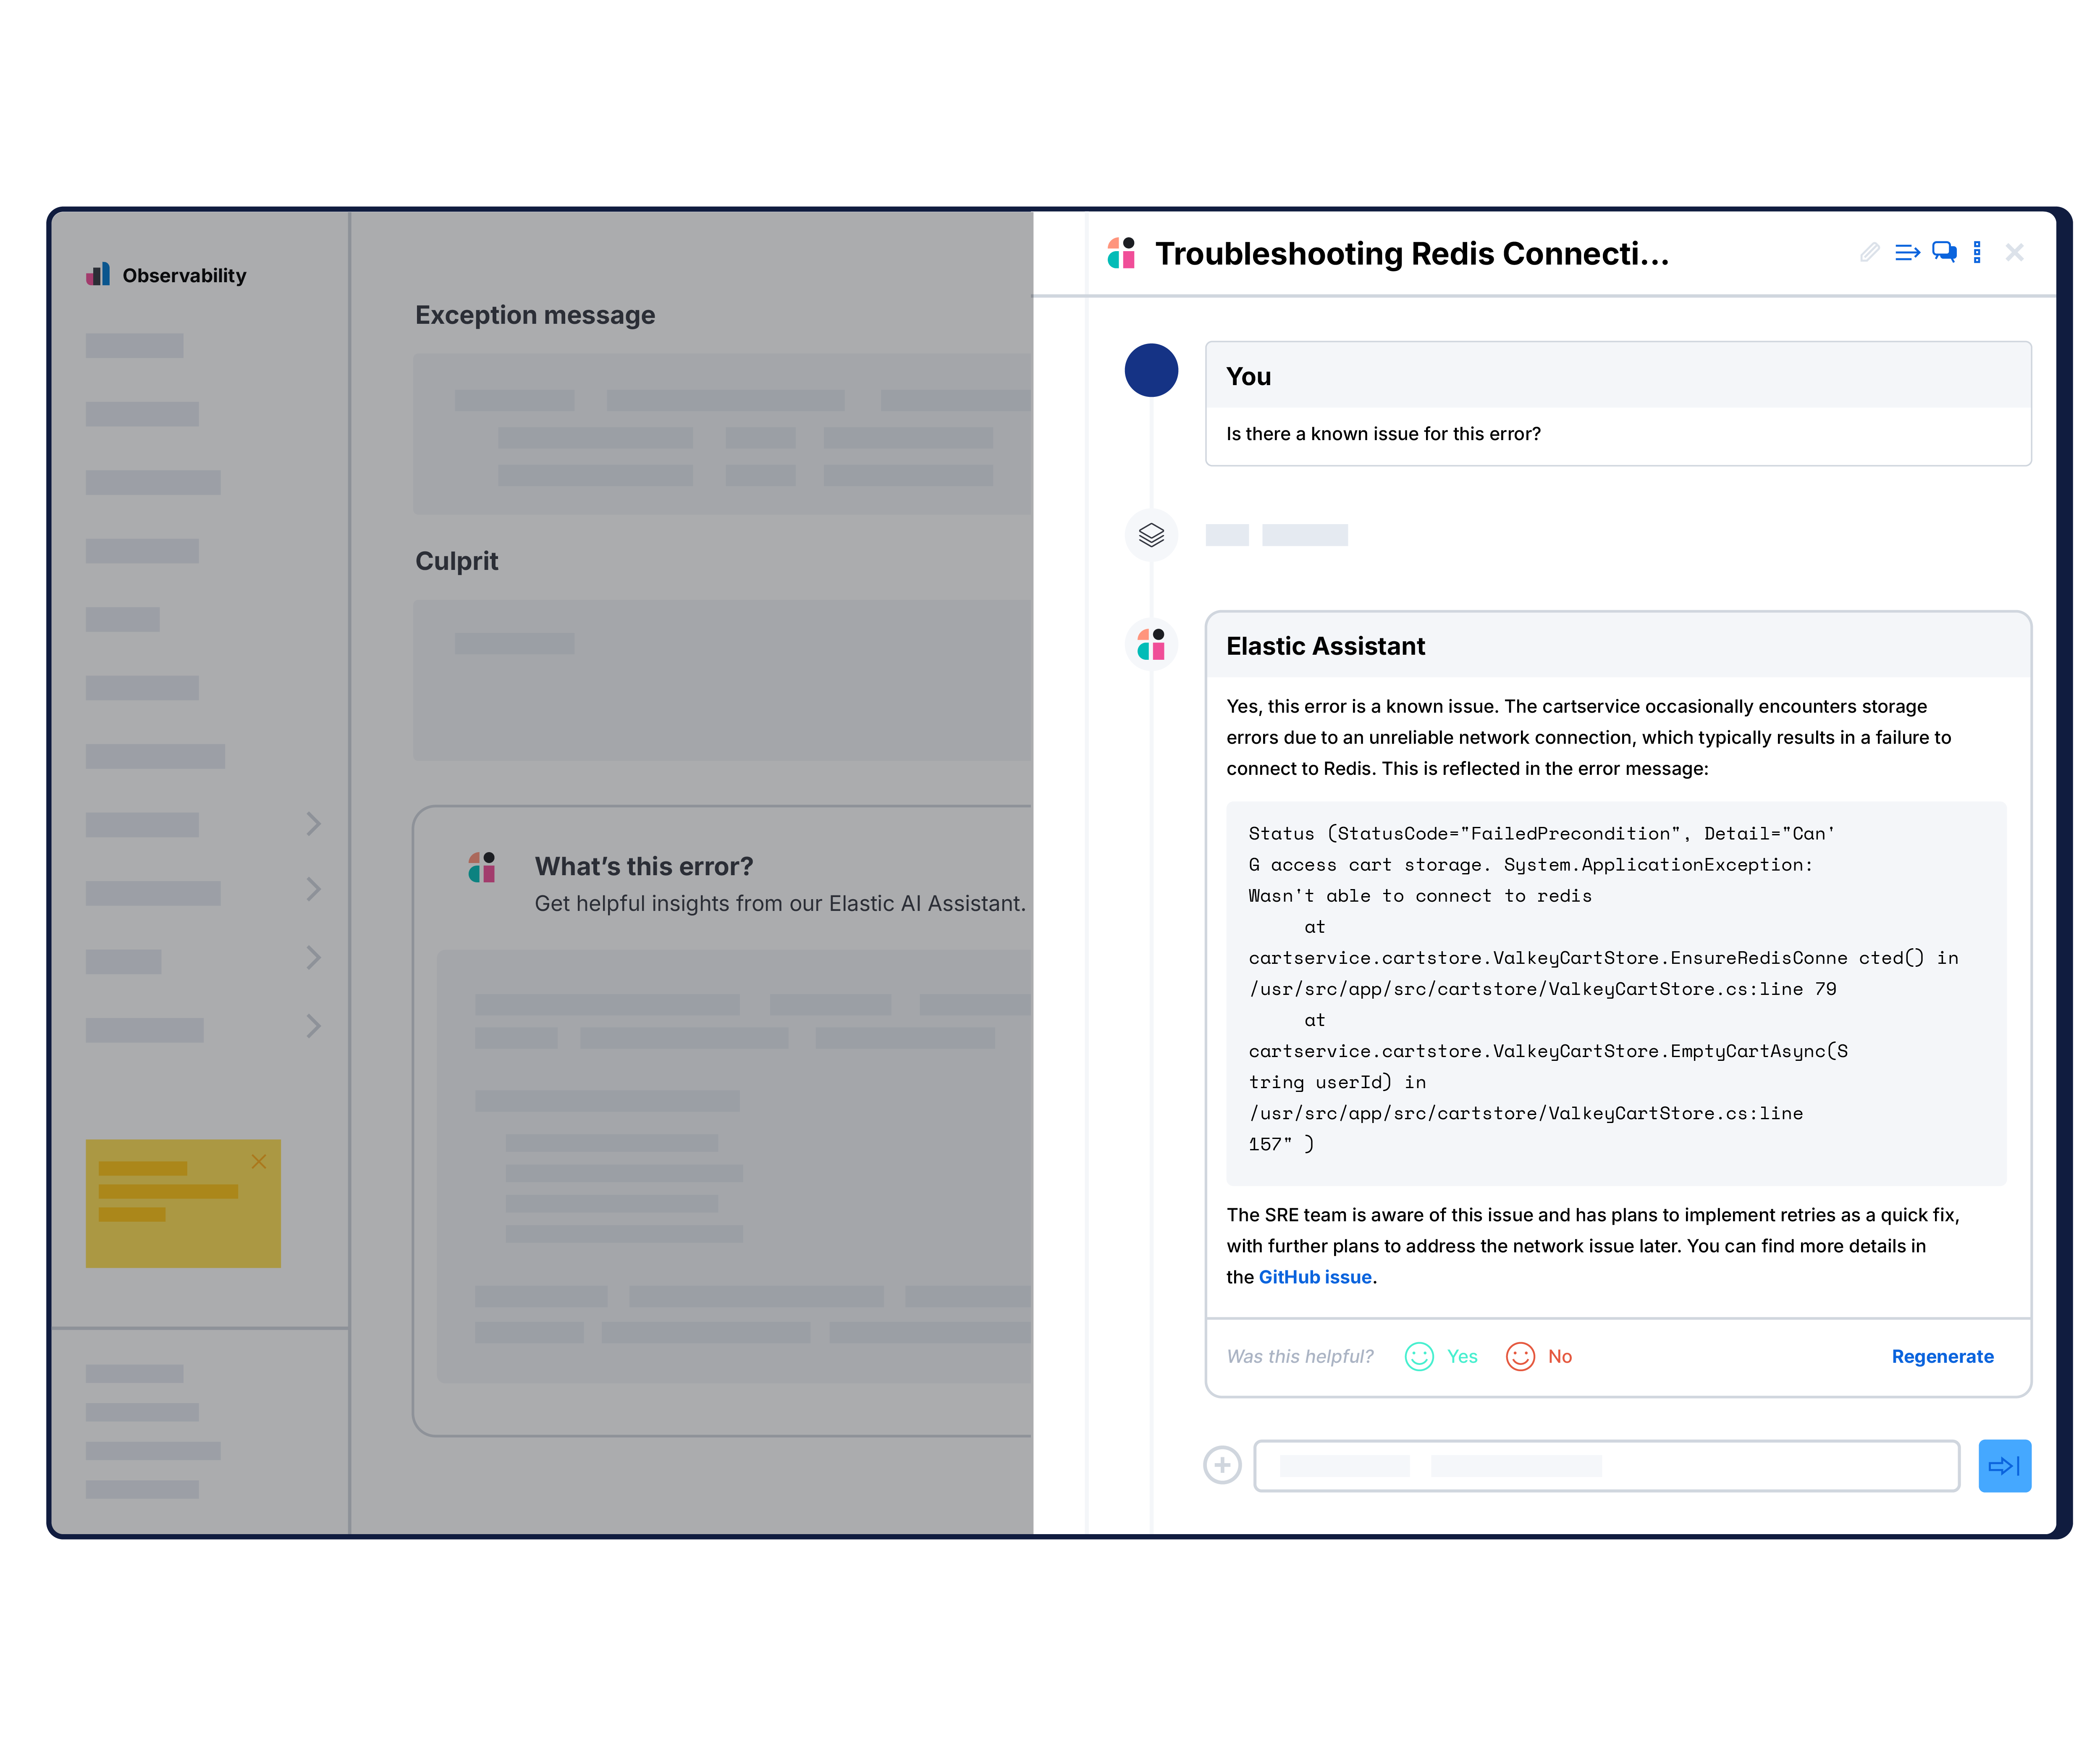
Elastic AI Assistant helps you better understand transaction latency issues and application errors and failures. It suggests relevant next steps based on internal runbooks and known GitHub issues.
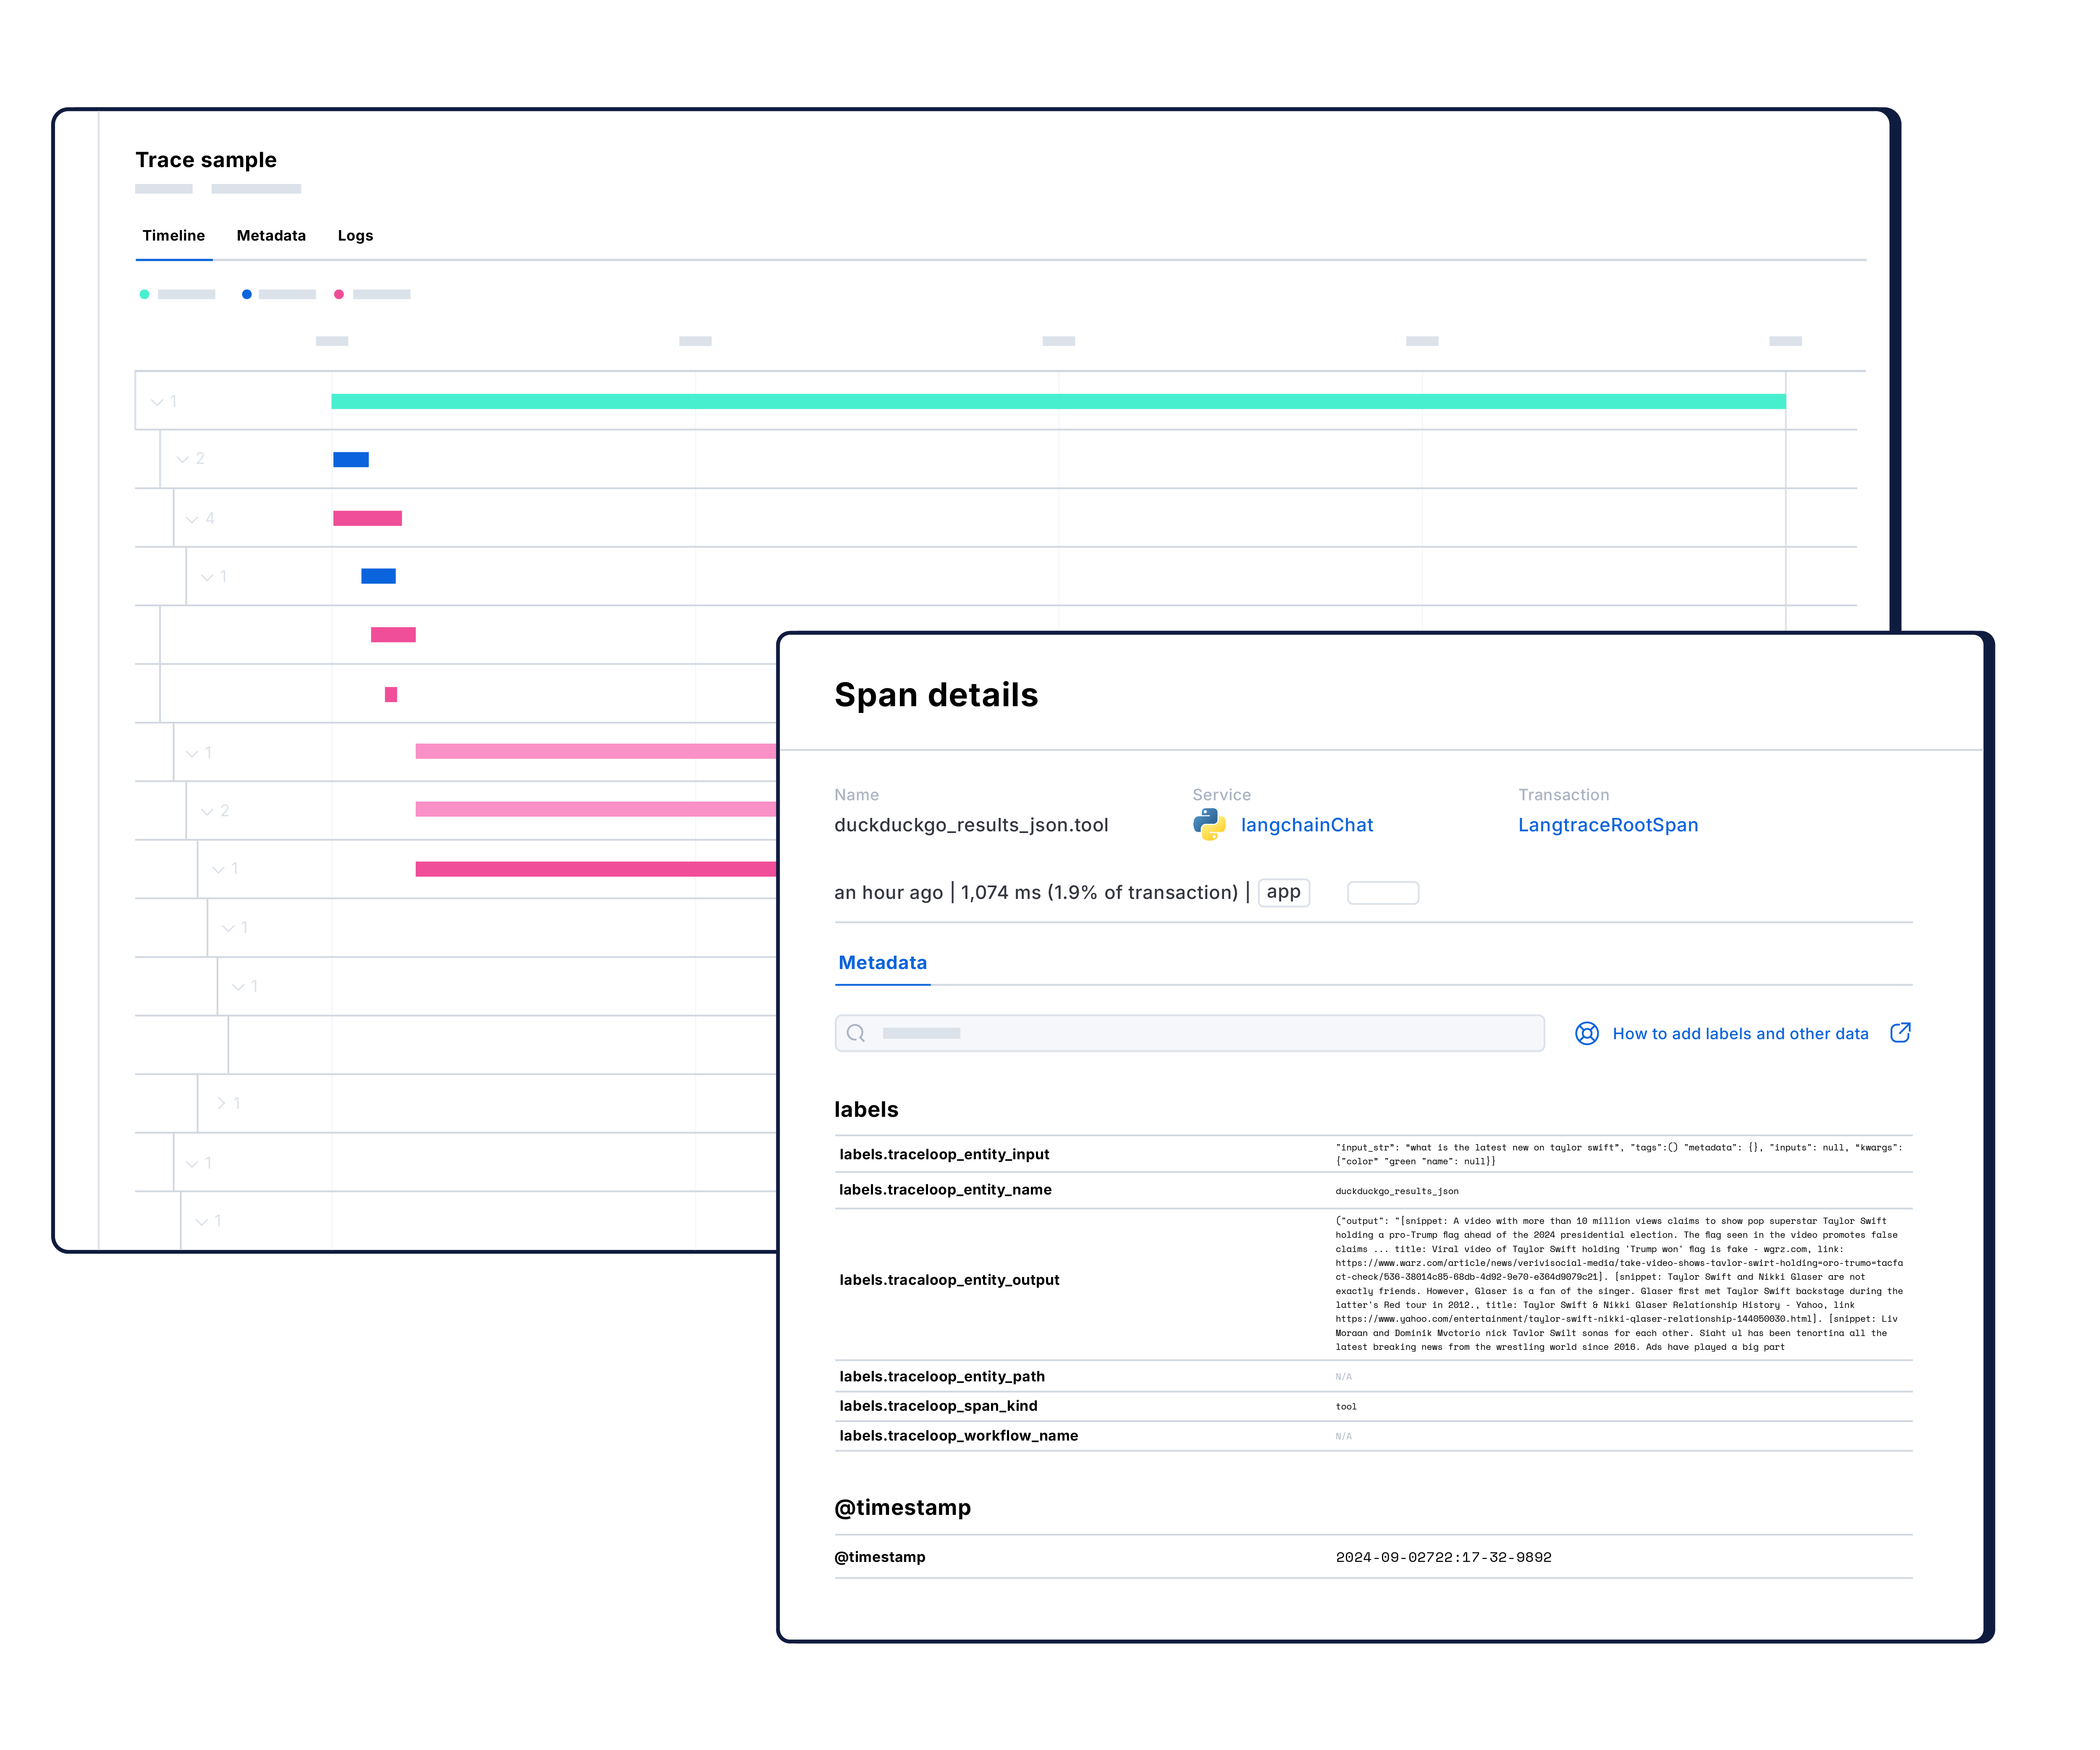
Optimize GenAI apps by tracing large language models (LLMs) with Elastic APM. Debug LangChain apps via EDOT or third-party tracing libraries like LangTrace, OpenLIT, or OpenLLMetry — or get a broader view with preconfigured LLM monitoring.
Instrument iOS and Android apps to monitor mobile performance with Elastic APM. Correlate with backend services for full end-to-end context.
Broad language support


See why companies like yours choose Elastic APM
Customer spotlight
 Equinox uses Elastic APM to monitor 200+ microservices, cutting time to deploy fixes by up to 50% and accelerating issue resolution across its stack.
Customer spotlight
 Wells Fargo relies on Elastic APM to monitor money-moving apps at scale — capturing 100% of distributed traces and correlating them with logs and other signals.
Customer spotlight
 Lufthansa's Miles & More loyalty program uses Elastic APM to monitor key services, employing unified views for faster detection and root cause analysis.