random.gauss() function in Python
Last Updated :
15 Jul, 2025
random module is used to generate random numbers in Python. Not actually random, rather this is used to generate pseudo-random numbers. That implies that these randomly generated numbers can be determined. gauss() is an inbuilt method of the random module. It is used to return a random floating point number with gaussian distribution.
Example:
Python
import random
mu = 100
sigma = 50
print(random.gauss(mu, sigma))
Output :
127.80261974806497
Explanation: This code generates and prints a random number from a Gaussian distribution with a mean (mu) of 100 and a standard deviation (sigma) of 50 using the random.gauss() function. The result will be a value close to 100 but can vary within a range due to the standard deviation.
Syntax
random.gauss(mu, sigma)
Parameters
- mu: mean
- sigma: standard deviation
Return Value
- Returns a random gaussian distribution floating number
Examples of random.gauss() function
1. Gaussian Distribution Plot
We can generate the number multiple times and plot a graph to observe the gaussian distribution.
Python
import random
import matplotlib.pyplot as plt

# store the random numbers in a list
nums = []
mu = 100
sigma = 50

for i in range(100):
	temp = random.gauss(mu, sigma)
	nums.append(temp)

# plotting a graph
plt.plot(nums)
plt.show()
Output :
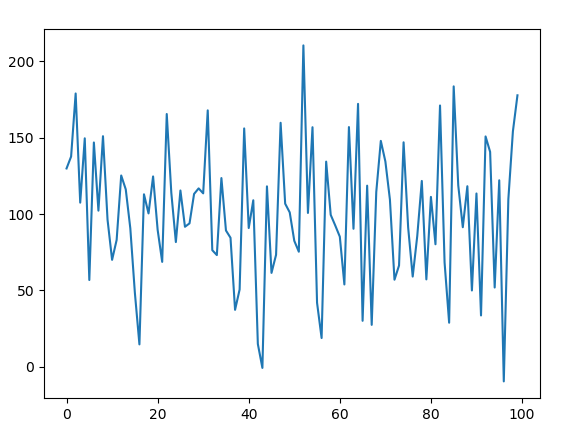 Gaussian Distribution Plot
Explanation: This code generates 100 random numbers following a Gaussian distribution with a mean of 100 and a standard deviation of 50. It stores these numbers in a list and then plots the values using matplotlib to visualize the distribution.
2. Gaussian Distribution Histogram
We can create a histogram to observe the density of the gaussian distribution.
Python
import random
import matplotlib.pyplot as plt

# store the random numbers in a list
nums = []
mu = 100
sigma = 50

for i in range(10000):
	temp = random.gauss(mu, sigma)
	nums.append(temp)

# plotting a graph
plt.hist(nums, bins = 200)
plt.show()
Output :
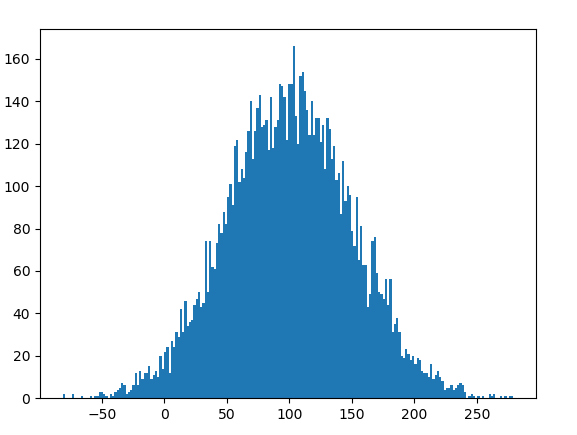 Gaussian Distribution Histogram
Explanation: This code generates 10,000 random numbers following a Gaussian distribution with a mean of 100 and a standard deviation of 50. It stores the numbers in a list and then plots a histogram using matplotlib to visualize the distribution with 200 bins.