| CARVIEW |
Select Language
HTTP/2 308
cache-control: public, max-age=0, must-revalidate
content-type: text/plain
date: Tue, 29 Jul 2025 09:37:06 GMT
location: /javascript/statistical-charts/
refresh: 0;url=/javascript/statistical-charts/
server: Vercel
strict-transport-security: max-age=63072000
x-vercel-id: bom1::78dj7-1753781826006-2d1e1f3c6032
HTTP/2 200
accept-ranges: bytes
access-control-allow-origin: *
age: 0
cache-control: max-age=600
content-encoding: gzip
content-type: text/html; charset=utf-8
date: Tue, 29 Jul 2025 09:37:06 GMT
etag: W/"687e6266-7b2c"
expires: Tue, 29 Jul 2025 09:47:06 GMT
last-modified: Mon, 21 Jul 2025 15:53:10 GMT
server: Vercel
strict-transport-security: max-age=63072000
vary: Accept-Encoding
via: 1.1 varnish
x-cache: MISS
x-cache-hits: 0
x-fastly-request-id: 7dde30a4b8843bbb1131a5b6ab15faf16151042b
x-github-request-id: F675:B90F7:73E89:8A9AB:68889641
x-origin-cache: HIT
x-proxy-cache: MISS
x-robots-tag: index
x-served-by: cache-bom-vanm7210090-BOM
x-timer: S1753781826.045713,VS0,VE214
x-vercel-cache: MISS
x-vercel-id: bom1::k27h4-1753781826032-3f43f237b16c
content-length: 6186
Statistical charts in JavaScript


Plotly.js Statistical Charts
Plotly.js makes interactive, publication-quality graphs online. Examples of how to make statistical charts such as boxplots and histograms.
Plotly Studio: Transform any dataset into an interactive data application in minutes with AI. Sign up for early access now.
-
Error BarsView Tutorial

-
Box PlotsView Tutorial

-
HistogramsView Tutorial

-
2d Density PlotsView Tutorial

-
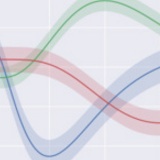
Continuous Error BarsView Tutorial
-
2D HistogramsView Tutorial

-
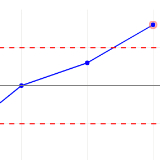
SPC Control ChartsView Tutorial
-
Violin PlotView Tutorial

-
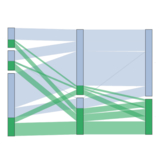
Parallel Categories DiagramView Tutorial
-
SplomView Tutorial

-
2D Histogram ContourView Tutorial
