| CARVIEW |
Select Language
HTTP/2 308
cache-control: public, max-age=0, must-revalidate
content-type: text/plain
date: Thu, 31 Jul 2025 03:36:27 GMT
location: /javascript/maps/
refresh: 0;url=/javascript/maps/
server: Vercel
strict-transport-security: max-age=63072000
x-vercel-id: bom1::hnqdb-1753932987473-e1a77d0ff6f5
HTTP/2 200
accept-ranges: bytes
access-control-allow-origin: *
age: 0
cache-control: max-age=600
content-encoding: gzip
content-type: text/html; charset=utf-8
date: Thu, 31 Jul 2025 03:36:27 GMT
etag: W/"687e6267-78ab"
expires: Thu, 31 Jul 2025 03:46:27 GMT
last-modified: Mon, 21 Jul 2025 15:53:11 GMT
server: Vercel
strict-transport-security: max-age=63072000
vary: Accept-Encoding
via: 1.1 varnish
x-cache: MISS
x-cache-hits: 0
x-fastly-request-id: 89cb90e561a065711b350740a727b418919c9468
x-github-request-id: 5D21:1E06F8:1C73F:27AD5:688AE4B5
x-origin-cache: HIT
x-proxy-cache: MISS
x-robots-tag: index
x-served-by: cache-bom-vanm7210037-BOM
x-timer: S1753932988.535490,VS0,VE213
x-vercel-cache: MISS
x-vercel-id: bom1::fbjjs-1753932987501-dfe555b0de4b
content-length: 6127
Maps in JavaScript


Plotly.js Maps
Plotly.js makes interactive, publication-quality graphs online. Examples of how to make maps.
Plotly Studio: Transform any dataset into an interactive data application in minutes with AI. Sign up for early access now.
-
Migrate to MaplibreView Tutorial
-
Tile Map LayersView Tutorial

-
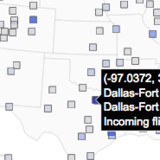
Tile Density HeatmapView Tutorial

-
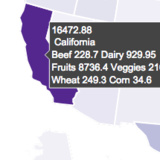
Choropleth Tile MapView Tutorial

-
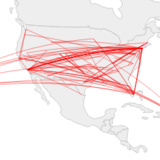
Lines on MapsView Tutorial
-
Bubble MapsView Tutorial

-
Scatter Plots on MapsView Tutorial
-
Scatter Plots on Tile MapsView Tutorial

-
Choropleth MapsView Tutorial
-
Filled Area on Tile MapsView Tutorial