You signed in with another tab or window. Reload to refresh your session.You signed out in another tab or window. Reload to refresh your session.You switched accounts on another tab or window. Reload to refresh your session.Dismiss alert
WebView Sample application with full featured Chrome Dev Tools debugging using
JavaFx WebView Debugger library.
To try it out download the WebViewDebugSample.jar to an empty directory. The application will
create public directory for its HTML page and resources and save a JSON file of script state
into WebViewDebugSample.json in this directory.
java -jar WebViewDebugSample.jar
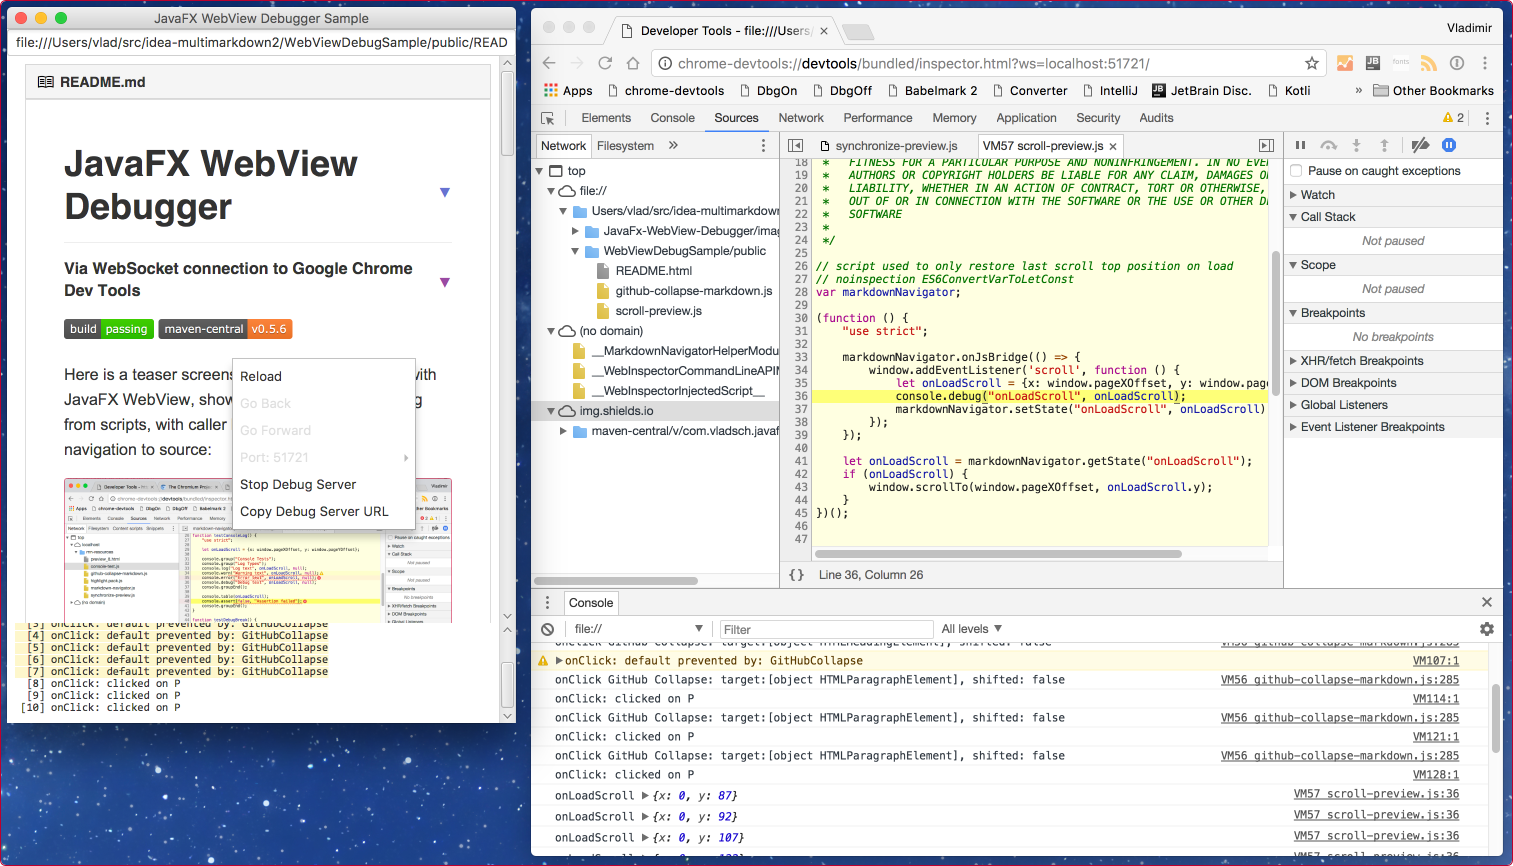
The application will launch and open the Javafx Web View Debugger Readme file as it was
converted to HTML by Markdown Navigator plugin, out of laziness and because this page has
enough script action to be a good example of debugger's use.
Using the context menu on the main page:
click on the Start Debug
,
On some Java you need to use the context menu to reload the page before connecting Chrome Dev
Tools. (If you got an application crash after connecting Google Chrome tools without doing
this step, then chances are good that this step is needed.)
Click on the Copy Debug Server URL
open Google Chrome, paste the URL in its address bar and hit ENTER.
Hit ⌘R on OS X or Ctrl+F5 on Windows/Linux to reload the page being debugged.
Enjoy full featured debugging of JavaFX WebView!
Context Menu Actions
Reload Pag : reload the current page
Reload Page & Pause: reload the current page and pause in debugger on script execution in the page body
Go Back: go to previous address in history
Go Forward: go to next address in history
Port: x : shows the current port
Change to: x-1: allows changing to previous port
Change to: x+1: allows changing to next port
Start Debugging: start debug web-socket server
Stop Debug Server: stop debug web-socket server
Copy Debug Server URL: copy the debug web-socket URL to clipboard


 ,
,